Обновлено
CHT 3 Consecutive Candles
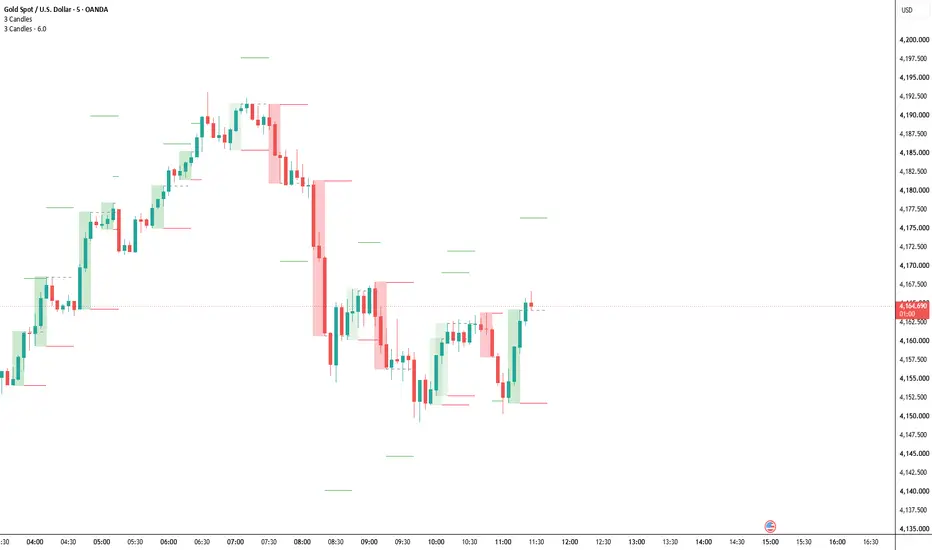
This indicator spots when a set number of bullish or bearish candles form in a row, and marks it directly on your chart with a coloured box and a label.
How it works
A candle counts as bullish if it closes above its open, and bearish if it closes below its open. When the chosen number of same-direction candles appear back to back (3 by default), the indicator draws a box around the whole run. Green means a bullish run and red means a bearish run. A label at the edge of the box shows the candle count and direction (3▲ or 3▼). A doji, where the open and close are equal, counts as neither and breaks the run.
How it works
A candle counts as bullish if it closes above its open, and bearish if it closes below its open. When the chosen number of same-direction candles appear back to back (3 by default), the indicator draws a box around the whole run. Green means a bullish run and red means a bearish run. A label at the edge of the box shows the candle count and direction (3▲ or 3▼). A doji, where the open and close are equal, counts as neither and breaks the run.
Информация о релизе
now the sl is at the top bottom of the box when before it would just be at the high/low of the 1st candle stick Информация о релизе
now there is a toggle option to see higher probiblity setups 
Отказ от ответственности
Информация и публикации не предназначены для предоставления и не являются финансовыми, инвестиционными, торговыми или другими видами советов или рекомендаций, предоставленных или одобренных TradingView. Подробнее читайте в Условиях использования.
Отказ от ответственности
Информация и публикации не предназначены для предоставления и не являются финансовыми, инвестиционными, торговыми или другими видами советов или рекомендаций, предоставленных или одобренных TradingView. Подробнее читайте в Условиях использования.