Обновлено
Seasonality
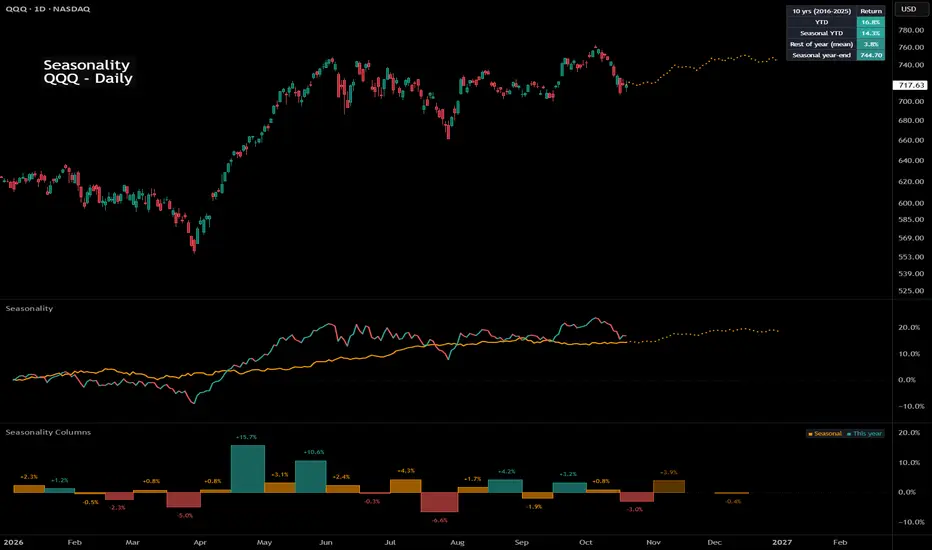
This is my attempt to bring an open source Seasonality indicator to TradingView.
There are still outstanding issues I couldn't figure out, so I am hoping some more seasoned Pine Script coders can take the lead from here.
What is Seasonality: https://www.investopedia.com/terms/s/seasonality.asp
How to Use
Known Issues
Areas for Improvement
There are still outstanding issues I couldn't figure out, so I am hoping some more seasoned Pine Script coders can take the lead from here.
What is Seasonality: https://www.investopedia.com/terms/s/seasonality.asp
How to Use
- The indicator plots the avg % change per bar for all complete years, up to 20 years back.
- It will only show in the daily resolution.
- For charts with more data, you need to scroll back a bit to get the line to display.
- Use Offset Adjust in the menu for charts that do not align perfectly to the start of the year.
- Use Smoothing in the menu to apply an EMA to the line.
- The panel shows YTD % gain, 5-day rolling seasonality, and 20-day rolling seasonality.
Known Issues
- Does not work for tickers with over 10,000 bars of data.
- Some tickers do not align correctly.
- Only works with tickers that have ~252 bars a year.
Areas for Improvement
- Figure out a way to use barssince() to get the precise amount of bars for each year. This will make the seasonality calculation and automatic offset more accurate.
- Have an option for calendar week, month, and year seasonality.
Информация о релизе
Cleaned up the script.Информация о релизе
Cleaned up the code some more so it is easier to read.Информация о релизе
Major update: rewritten from the ground up in Pine Script v6.WHAT'S NEW
• Calendar alignment: each year is placed on a common 365-day calendar by bar date, so stocks, ETFs, 24/7 crypto, forex and futures all line up correctly. The old "Offset Adjust" input is gone; nothing needs adjusting.
• Composite of the last N complete years (default 10), using a compounded mean (so one huge year can't dominate) or the median. Incomplete years (late start, early end, data gaps, thin data) are skipped automatically.
• Own pane: the orange seasonal composite and this year's YTD return on the same % axis, with the rest of the year dotted to Dec 31.
• Price chart: the seasonal path runs from today's close to Dec 31. Or start it from last year's close to compare this year with the seasonal path.
• Panel: YTD, Seasonal YTD, Rest of year (the average of past years from today to Dec 31) and the Seasonal year-end price. Hover any cell for details, including each year's value and the best and worst year.
• Optional US presidential-cycle filter, smoothing, and "Show on past years" to see how the pattern held up out of sample.
• Works on daily, weekly and monthly charts.
COMPANION: SEASONALITY COLUMNS
A new companion indicator, Seasonality Columns, shows the same composite as monthly (or weekly or quarterly) columns: what each period typically did (orange) next to what it did this year (green/red).
NOTE
Settings have changed. If the indicator is already on your chart, remove it and add it again.
This shows a historical tendency based on a small number of years. It is not a forecast or a price target.

Отказ от ответственности
Информация и публикации не предназначены для предоставления и не являются финансовыми, инвестиционными, торговыми или другими видами советов или рекомендаций, предоставленных или одобренных TradingView. Подробнее читайте в Условиях использования.
Отказ от ответственности
Информация и публикации не предназначены для предоставления и не являются финансовыми, инвестиционными, торговыми или другими видами советов или рекомендаций, предоставленных или одобренных TradingView. Подробнее читайте в Условиях использования.