Bollinger BandWidth with Channel Break Alerts
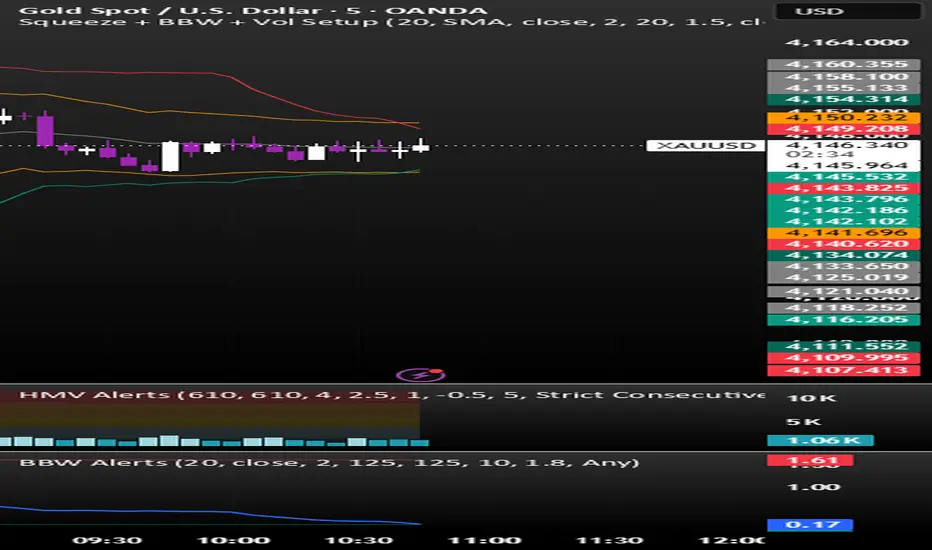
## Overview
The **Bollinger BandWidth with Channel Break Alerts** indicator measures relative volatility cycles—specifically identifying when the market moves from deep compression (squeeze) to explosive expansion (breakout).
Standard Bollinger Bands show channel boundaries directly on price. This indicator plots normalized **BandWidth (BBW)** as an oscillator to clearly track the compression floor and volatility ceiling over rolling lookback windows. It filters volatility breakouts with directional price action and relative candle-body momentum, pinpointing high-probability entry opportunities right as price breaks out of the squeeze.
---
## How It Works
### 1. Bollinger BandWidth Formula
The indicator calculates normalized BandWidth as a percentage:
$$\text{BBW} = \frac{\text{Upper Band} - \text{Lower Band}}{\text{Basis (SMA)}} \times 100$$
* A low BBW value signals a low-volatility consolidation phase (the squeeze).
* A rising BBW value signals expanding volatility and trending conditions.
### 2. Rolling Extremes (The Volatility Channel)
* **Lowest Contraction (Green Line):** Tracks the lowest BBW reading over your selected lookback window (`contractionLengthInput`, default: 125 bars). This defines the floor of the squeeze.
* **Highest Expansion (Red Line):** Tracks the peak BBW reading over your selected lookback window (`expansionLengthInput`, default: 125 bars). This marks maximum volatility where moves often exhaust.
### 3. Price Action & Candle Body Filter
Not all expansions lead to clean trends. To filter out false breaks, the script includes a relative candle-body filter:
* Compares the absolute body size ($\vert{}\text{Close} - \text{Open}\vert{}$) of the breakout bar against a simple moving average of previous candle bodies.
* Ensures only high-momentum candles trigger confirmed signals when configured.
---
## Key Visual Signals
| Marker / Signal | Visual Representation | Meaning |
| --- | --- | --- |
| **Bullish Channel Break** | Green Triangle Up (Bottom) | BBW crossed above the contraction floor while price closed above the middle basis. |
| **Bearish Channel Break** | Red Triangle Down (Bottom) | BBW crossed above the contraction floor while price closed below the middle basis. |
| **Touch Lower Limit** | Green Triangle Down (Bottom) | BBW touched the contraction floor—market is entering peak squeeze. |
| **Touch Upper Limit** | Red Triangle Up (Top) | BBW reached multi-period peak expansion—volatility exhaustion warning. |
| **Channel Break Highlight** | Green / Red Background Tint | Confirms active breakout bar direction at a glance. |
---
## Included Alerts
This script features dedicated alerts compatible with standard TradingView alert dialogs as well as dynamic webhook automations.
### 1. Channel Breakout Alerts (Trade Entry)
* **`BBW Channel Break - Bullish Entry`**: Fires when BBW crosses up out of the multi-period contraction channel while price action is bullish (`Close > Basis`). Best used for Long entry confirmation.
* **`BBW Channel Break - Bearish Entry`**: Fires when BBW crosses up out of the contraction channel while price action is bearish (`Close < Basis`). Best used for Short entry confirmation.
* **`BBW Channel Break - Any`**: Triggers whenever BBW breaks out of the squeeze floor regardless of directional bias.
### 2. Volatility Cycle Alerts
* **`BBW Touches Lower Limit`**: Alerts when the market hits maximum compression (Lowest Contraction line), warning you that a large move is preparing to load.
* **`BBW Touches Upper Limit`**: Alerts when volatility reaches its multi-period ceiling (Highest Expansion line), signaling potential trend exhaustion or parabolic climax.
* **`BBW Curves Up + Big Body Candle`**: Triggers when volatility curls upward from the base with an expanded candle body meeting your multiplier threshold.
### 3. Programmatic Webhook Alert (`alert()`)
The script includes dynamic `alert()` function calls containing real-time price, ticker, and timeframe data:
* `BUY SIGNAL: BBW broke out of squeeze channel upward...`
* `SELL SIGNAL: BBW broke out of squeeze channel downward...`
To receive both directional triggers under a single alert without creating separate alerts, choose **"Any alert() function call"** in the TradingView Alert Creation window.
---
## Recommended Settings & Tips
* **Trigger Setting:** Always set alert frequency to **"Once Per Bar Close"** to avoid false triggers from intra-bar wicks that collapse before the candle finishes.
* **Length Inputs (Default: 125):**
* On lower intraday timeframes (1m–15m), 100–150 bars captures several hours to a few sessions of consolidation.
* On daily/weekly swing charts, adjust between 50 and 100 bars to capture quarterly cycles.
* **Confirming with Price Action:** Use the middle SMA line (20 SMA) or local support/resistance levels as invalidation stops when trading squeeze breaks.

Отказ от ответственности
Информация и публикации не предназначены для предоставления и не являются финансовыми, инвестиционными, торговыми или другими видами советов или рекомендаций, предоставленных или одобренных TradingView. Подробнее читайте в Условиях использования.
Отказ от ответственности
Информация и публикации не предназначены для предоставления и не являются финансовыми, инвестиционными, торговыми или другими видами советов или рекомендаций, предоставленных или одобренных TradingView. Подробнее читайте в Условиях использования.