Обновлено
Smart Trend + Zones
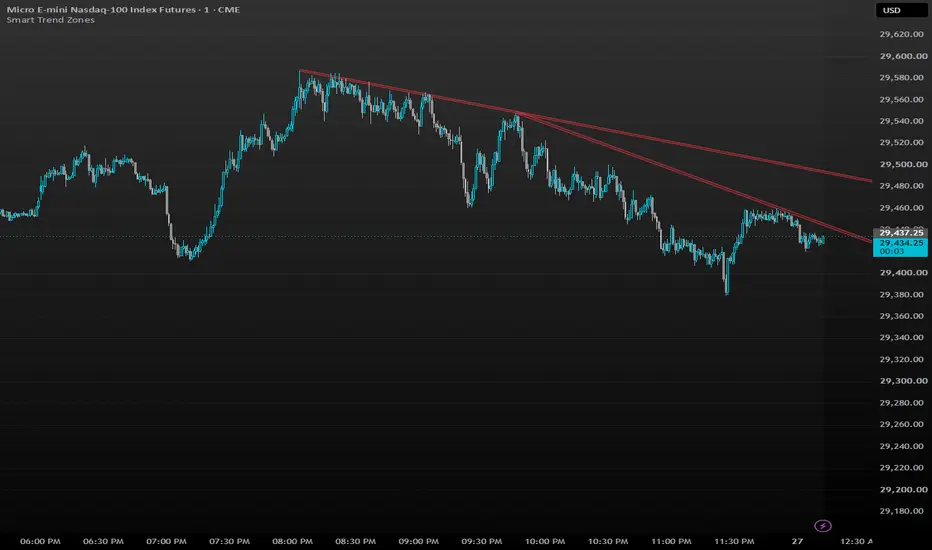
Smart Trend + Zones
Smart Trend Zones is a clean trend-zone indicator designed to replace traditional single trendlines with adjustable sloped support and resistance zones.
The indicator automatically searches confirmed pivot highs and pivot lows to identify potential trend structures. Instead of drawing a thin line, it creates a filled zone around the trendline, helping account for normal price movement, wick reactions, and small differences between touch points.
The chart remains clean by displaying only active bullish and bearish zones and optional confirmed breakout signals.
Main Features
Bullish Support Zones
Bullish zones are created beneath price using rising pivot lows.
These zones may act as dynamic support while the bullish structure remains valid.
A bullish zone is considered broken only when a candle closes below the lower boundary of the zone.
When this happens:
A confirmed sell signal is displayed.
The broken bullish zone is removed from the chart.
A wick below the zone does not trigger a break.
Bearish Resistance Zones
Bearish zones are created above price using falling pivot highs.
These zones may act as dynamic resistance while the bearish structure remains valid.
A bearish zone is considered broken only when a candle closes above the upper boundary of the zone.
When this happens:
A confirmed buy signal is displayed.
The broken bearish zone is removed from the chart.
A wick above the zone does not trigger a break.
Confirmed Signals
Signals are generated only after the breakout candle has closed.
Buy signal: Candle closes above a bearish resistance zone.
Sell signal: Candle closes below a bullish support zone.
This prevents temporary intrabar movement and wick penetration from creating premature signals.
Signal appearance can be customized using:
Arrow, triangle, diamond, or circle markers.
Adjustable marker size.
Custom buy and sell colors.
Maximum number of historical signal markers.
How to Use the Indicator
1. Identify the Active Trend Zones
Green zones represent potential bullish support.
Red zones represent potential bearish resistance.
A zone extending toward the current price means the trend structure is still active.
2. Watch How Price Reacts
Price may:
Touch the zone and reject.
Consolidate near the zone.
Wick through the zone and recover.
Close completely outside the zone.
A wick through the zone does not automatically invalidate it. The candle must close beyond the outer edge.
3. Trading With the Zone
A bullish support zone can be used to look for:
Bullish rejection candles.
Continuation setups.
Pullback entries.
Higher-low formations.
Confluence with another support level.
A bearish resistance zone can be used to look for:
Bearish rejection candles.
Continuation setups.
Pullback entries.
Lower-high formations.
Confluence with another resistance level.
4. Trading the Breakout Signal
A buy signal means price has closed above an active bearish resistance zone.
A sell signal means price has closed below an active bullish support zone.
The signal confirms that the previous trend-zone structure has been invalidated. It does not guarantee that price will continue in the breakout direction.
For additional confirmation, traders may combine the signal with:
Market structure.
Volume.
Support and resistance.
Fair value gaps.
Order blocks.
Session highs and lows.
Higher-timeframe direction.
Recommended Settings
These settings provide a balanced starting point and keep the chart clean.
Trend Detection
Start year: 2020
Start month: 1
Start day: 1
Pivot period: 10
Pivot points to search: 3
Minimum pivot touches: 2
Minimum bars between anchors: 10
Minimum bars between touches: 5
Maximum candidate age: 2500 bars
Maximum slope: 0 — disabled
Trend Zones
Show bullish support zones: On
Show bearish resistance zones: On
Zone width: 5 ticks
Touch tolerance: 1 tick
Close-break buffer: 0 ticks
Maximum active zones per side: 2
Overlap tolerance: 1 zone width
Fill transparency: 82
Border transparency: 20
Border width: 1
Suggested colors:
Bullish zone: Green
Bearish zone: Red
Break Signals
Show confirmed break signals: On
Signal style: Arrow
Signal size: Small
Buy color: Green
Sell color: Red
Maximum signal markers: 200
Important Settings Explained
Pivot Period
Controls how sensitive the swing detection is.
Lower values create more pivots and more zones.
Higher values create fewer but more significant zones.
A value of 10 is a good balanced starting point.
Minimum Pivot Touches
Controls how many confirmed pivot points are required to validate a zone.
2 touches: More zones and earlier detection.
3 touches: More selective and usually stronger.
4 or more touches: Very selective, but zones may appear later.
The recommended starting value is 2. Traders wanting fewer zones can increase it to 3.
Zone Width
Controls the thickness of each zone using the symbol’s minimum tick size.
A wider zone allows more price movement around the trendline. A narrower zone requires more precise reactions.
The recommended starting value is 5 ticks, but this may need adjustment depending on the instrument.
Touch Tolerance
Allows a pivot to be counted as a touch when it is slightly away from the trendline.
The recommended value is 1 tick.
Close-Break Buffer
Requires price to close an additional number of ticks beyond the zone before confirming a break.
0 confirms the break immediately after a close outside the zone.
A higher value can reduce marginal or one-tick breakouts.
Maximum Active Zones Per Side
Limits how many bullish and bearish zones can remain visible simultaneously.
A value of 2 keeps the chart clean while still showing nearby trend structure.
Overlap Tolerance
Controls how close two zones can be before they are treated as overlapping.
The indicator removes or avoids redundant zones to reduce chart clutter.
Notes
Confirmed pivots require candles on both sides of the swing point. Because of this, new zones appear only after the pivot has been confirmed.
Signals are confirmed at candle close and do not trigger from temporary intrabar price movement.
Settings may need to be adjusted for different markets and timeframes. Instruments with larger volatility may require a wider zone or breakout buffer.
This indicator is intended as a market-structure and trend-analysis tool. It should not be used as a standalone trading system.
For educational purposes only. Not financial advice.
Smart Trend Zones is a clean trend-zone indicator designed to replace traditional single trendlines with adjustable sloped support and resistance zones.
The indicator automatically searches confirmed pivot highs and pivot lows to identify potential trend structures. Instead of drawing a thin line, it creates a filled zone around the trendline, helping account for normal price movement, wick reactions, and small differences between touch points.
The chart remains clean by displaying only active bullish and bearish zones and optional confirmed breakout signals.
Main Features
Bullish Support Zones
Bullish zones are created beneath price using rising pivot lows.
These zones may act as dynamic support while the bullish structure remains valid.
A bullish zone is considered broken only when a candle closes below the lower boundary of the zone.
When this happens:
A confirmed sell signal is displayed.
The broken bullish zone is removed from the chart.
A wick below the zone does not trigger a break.
Bearish Resistance Zones
Bearish zones are created above price using falling pivot highs.
These zones may act as dynamic resistance while the bearish structure remains valid.
A bearish zone is considered broken only when a candle closes above the upper boundary of the zone.
When this happens:
A confirmed buy signal is displayed.
The broken bearish zone is removed from the chart.
A wick above the zone does not trigger a break.
Confirmed Signals
Signals are generated only after the breakout candle has closed.
Buy signal: Candle closes above a bearish resistance zone.
Sell signal: Candle closes below a bullish support zone.
This prevents temporary intrabar movement and wick penetration from creating premature signals.
Signal appearance can be customized using:
Arrow, triangle, diamond, or circle markers.
Adjustable marker size.
Custom buy and sell colors.
Maximum number of historical signal markers.
How to Use the Indicator
1. Identify the Active Trend Zones
Green zones represent potential bullish support.
Red zones represent potential bearish resistance.
A zone extending toward the current price means the trend structure is still active.
2. Watch How Price Reacts
Price may:
Touch the zone and reject.
Consolidate near the zone.
Wick through the zone and recover.
Close completely outside the zone.
A wick through the zone does not automatically invalidate it. The candle must close beyond the outer edge.
3. Trading With the Zone
A bullish support zone can be used to look for:
Bullish rejection candles.
Continuation setups.
Pullback entries.
Higher-low formations.
Confluence with another support level.
A bearish resistance zone can be used to look for:
Bearish rejection candles.
Continuation setups.
Pullback entries.
Lower-high formations.
Confluence with another resistance level.
4. Trading the Breakout Signal
A buy signal means price has closed above an active bearish resistance zone.
A sell signal means price has closed below an active bullish support zone.
The signal confirms that the previous trend-zone structure has been invalidated. It does not guarantee that price will continue in the breakout direction.
For additional confirmation, traders may combine the signal with:
Market structure.
Volume.
Support and resistance.
Fair value gaps.
Order blocks.
Session highs and lows.
Higher-timeframe direction.
Recommended Settings
These settings provide a balanced starting point and keep the chart clean.
Trend Detection
Start year: 2020
Start month: 1
Start day: 1
Pivot period: 10
Pivot points to search: 3
Minimum pivot touches: 2
Minimum bars between anchors: 10
Minimum bars between touches: 5
Maximum candidate age: 2500 bars
Maximum slope: 0 — disabled
Trend Zones
Show bullish support zones: On
Show bearish resistance zones: On
Zone width: 5 ticks
Touch tolerance: 1 tick
Close-break buffer: 0 ticks
Maximum active zones per side: 2
Overlap tolerance: 1 zone width
Fill transparency: 82
Border transparency: 20
Border width: 1
Suggested colors:
Bullish zone: Green
Bearish zone: Red
Break Signals
Show confirmed break signals: On
Signal style: Arrow
Signal size: Small
Buy color: Green
Sell color: Red
Maximum signal markers: 200
Important Settings Explained
Pivot Period
Controls how sensitive the swing detection is.
Lower values create more pivots and more zones.
Higher values create fewer but more significant zones.
A value of 10 is a good balanced starting point.
Minimum Pivot Touches
Controls how many confirmed pivot points are required to validate a zone.
2 touches: More zones and earlier detection.
3 touches: More selective and usually stronger.
4 or more touches: Very selective, but zones may appear later.
The recommended starting value is 2. Traders wanting fewer zones can increase it to 3.
Zone Width
Controls the thickness of each zone using the symbol’s minimum tick size.
A wider zone allows more price movement around the trendline. A narrower zone requires more precise reactions.
The recommended starting value is 5 ticks, but this may need adjustment depending on the instrument.
Touch Tolerance
Allows a pivot to be counted as a touch when it is slightly away from the trendline.
The recommended value is 1 tick.
Close-Break Buffer
Requires price to close an additional number of ticks beyond the zone before confirming a break.
0 confirms the break immediately after a close outside the zone.
A higher value can reduce marginal or one-tick breakouts.
Maximum Active Zones Per Side
Limits how many bullish and bearish zones can remain visible simultaneously.
A value of 2 keeps the chart clean while still showing nearby trend structure.
Overlap Tolerance
Controls how close two zones can be before they are treated as overlapping.
The indicator removes or avoids redundant zones to reduce chart clutter.
Notes
Confirmed pivots require candles on both sides of the swing point. Because of this, new zones appear only after the pivot has been confirmed.
Signals are confirmed at candle close and do not trigger from temporary intrabar price movement.
Settings may need to be adjusted for different markets and timeframes. Instruments with larger volatility may require a wider zone or breakout buffer.
This indicator is intended as a market-structure and trend-analysis tool. It should not be used as a standalone trading system.
For educational purposes only. Not financial advice.
Информация о релизе
adjusted short name
Отказ от ответственности
Информация и публикации не предназначены для предоставления и не являются финансовыми, инвестиционными, торговыми или другими видами советов или рекомендаций, предоставленных или одобренных TradingView. Подробнее читайте в Условиях использования.
Отказ от ответственности
Информация и публикации не предназначены для предоставления и не являются финансовыми, инвестиционными, торговыми или другими видами советов или рекомендаций, предоставленных или одобренных TradingView. Подробнее читайте в Условиях использования.