OPEN-SOURCE SCRIPT
Valuation Multi-Asset [Open]
Description
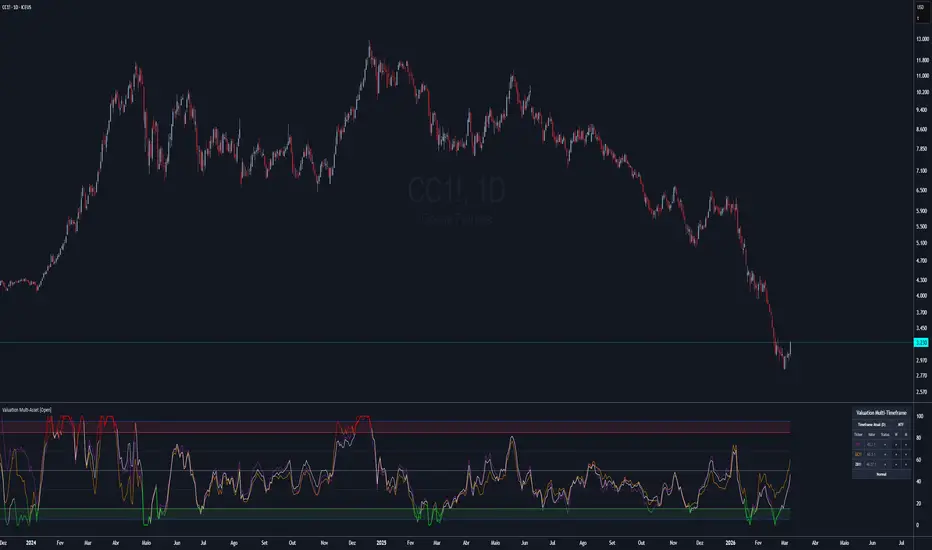
The Valuation Multi-Asset [Open] is a highly specialized Intermarket Analysis tool designed to determine the relative valuation of your chart's asset by comparing its performance against up to 6 global benchmarks simultaneously.
By releasing this V1.4 edition as an Open-Source tool, traders and Pine Script developers can study advanced concepts such as dynamic multi-timeframe (request.security) arrays, matrix-style data normalization, and complex real-time table drawing.
Underlying Concepts & Methodology
The script operates on the principle of asset correlation and historical mean reversion.
Ratio Calculation: It computes the pure price ratio between the Chart Asset and the selected Benchmark Assets (e.g., DXY, Gold, Bonds).
Smoothing & Normalization: It applies an Exponential Moving Average (EMA) to filter noise, and then normalizes the result over a long-term historical lookback period (default is 156 weeks/3 years).
Scoring (0-100): The normalized data is ranked into a Valuation Index.
< 15 (Green): Historically Undervalued (Cheap) relative to the benchmark.
> 85 (Red): Historically Overvalued (Expensive) relative to the benchmark.
Key Features
Expanded Capacity: Monitor up to 6 simultaneous assets on a single chart to build a complete macro correlation matrix.
MTF Dashboard: A built-in HUD summarizes the Valuation bias (Cheap/Neutral/Expensive) across Daily, Weekly, and Monthly timeframes.
ETF Reference Table: Includes a handy on-chart cheat sheet of major ETFs to use as benchmarks.
How to Use
Contextual Bias: Use the MTF dashboard to get a quick read. If 5 out of 6 comparisons say your asset is "Cheap" on the Weekly timeframe, the probability of a macro mean-reversion (Long trade) increases drastically.
[English Translation of User Interface]
To comply with House Rules regarding non-English UI, here is the translation of the script's settings menu:
1. Seleção de Ativos (Asset Selection)
Usar Timeframe Personalizado = Use Custom Timeframe
Mostrar Ativo (1-6) = Show Asset (Slots 1 to 6)
Símbolo = Symbol (Ticker)
2. Tabela de Referência de ETFs (ETF Reference Table)
Mostrar Tabela Ref. = Show Reference Table
Posição / Categoria = Table Position / Filter Category
3. Parâmetros do Índice (Index Parameters)
Comprimento EMA = Smoothing EMA Length
Comprimento R do VIndex = Valuation Index Lookback Period
4. Níveis de Valuation (Valuation Levels)
Sobrevaloração / Subvaloração = Overvaluation / Undervaluation (Thresholds)
Nível Neutro = Neutral Level
5. Configurações de Tabela (Table Settings)
Tamanho do Texto = Text Size
Tema = Theme (Dark/Light)
Usar Cores Personalizadas = Use Custom Colors
6. Análise Multi-Timeframe (MTF Analysis)
Mostrar D / W / M = Show Daily / Weekly / Monthly Columns
[Português]
Descrição
O Valuation Multi-Asset agora é Open-Source! Esta ferramenta de Análise Intermercado calcula a correlação relativa do seu ativo contra até 6 benchmarks globais (como Dólar, Ouro, SP500).
Ele normaliza os dados históricos e cria um placar de 0 a 100 para te dizer estatisticamente se o seu ativo está "Caro" ou "Barato" em relação ao resto do mundo.
Funcionalidades
6 Slots de Ativos: Monitore uma cesta completa de correlações.
Painel MTF: Resumo de valuation para os tempos Diário, Semanal e Mensal em uma única tabela.
Código Aberto: Estude a manipulação avançada de tabelas e request.security.
The Valuation Multi-Asset [Open] is a highly specialized Intermarket Analysis tool designed to determine the relative valuation of your chart's asset by comparing its performance against up to 6 global benchmarks simultaneously.
By releasing this V1.4 edition as an Open-Source tool, traders and Pine Script developers can study advanced concepts such as dynamic multi-timeframe (request.security) arrays, matrix-style data normalization, and complex real-time table drawing.
Underlying Concepts & Methodology
The script operates on the principle of asset correlation and historical mean reversion.
Ratio Calculation: It computes the pure price ratio between the Chart Asset and the selected Benchmark Assets (e.g., DXY, Gold, Bonds).
Smoothing & Normalization: It applies an Exponential Moving Average (EMA) to filter noise, and then normalizes the result over a long-term historical lookback period (default is 156 weeks/3 years).
Scoring (0-100): The normalized data is ranked into a Valuation Index.
< 15 (Green): Historically Undervalued (Cheap) relative to the benchmark.
> 85 (Red): Historically Overvalued (Expensive) relative to the benchmark.
Key Features
Expanded Capacity: Monitor up to 6 simultaneous assets on a single chart to build a complete macro correlation matrix.
MTF Dashboard: A built-in HUD summarizes the Valuation bias (Cheap/Neutral/Expensive) across Daily, Weekly, and Monthly timeframes.
ETF Reference Table: Includes a handy on-chart cheat sheet of major ETFs to use as benchmarks.
How to Use
Contextual Bias: Use the MTF dashboard to get a quick read. If 5 out of 6 comparisons say your asset is "Cheap" on the Weekly timeframe, the probability of a macro mean-reversion (Long trade) increases drastically.
[English Translation of User Interface]
To comply with House Rules regarding non-English UI, here is the translation of the script's settings menu:
1. Seleção de Ativos (Asset Selection)
Usar Timeframe Personalizado = Use Custom Timeframe
Mostrar Ativo (1-6) = Show Asset (Slots 1 to 6)
Símbolo = Symbol (Ticker)
2. Tabela de Referência de ETFs (ETF Reference Table)
Mostrar Tabela Ref. = Show Reference Table
Posição / Categoria = Table Position / Filter Category
3. Parâmetros do Índice (Index Parameters)
Comprimento EMA = Smoothing EMA Length
Comprimento R do VIndex = Valuation Index Lookback Period
4. Níveis de Valuation (Valuation Levels)
Sobrevaloração / Subvaloração = Overvaluation / Undervaluation (Thresholds)
Nível Neutro = Neutral Level
5. Configurações de Tabela (Table Settings)
Tamanho do Texto = Text Size
Tema = Theme (Dark/Light)
Usar Cores Personalizadas = Use Custom Colors
6. Análise Multi-Timeframe (MTF Analysis)
Mostrar D / W / M = Show Daily / Weekly / Monthly Columns
[Português]
Descrição
O Valuation Multi-Asset agora é Open-Source! Esta ferramenta de Análise Intermercado calcula a correlação relativa do seu ativo contra até 6 benchmarks globais (como Dólar, Ouro, SP500).
Ele normaliza os dados históricos e cria um placar de 0 a 100 para te dizer estatisticamente se o seu ativo está "Caro" ou "Barato" em relação ao resto do mundo.
Funcionalidades
6 Slots de Ativos: Monitore uma cesta completa de correlações.
Painel MTF: Resumo de valuation para os tempos Diário, Semanal e Mensal em uma única tabela.
Código Aberto: Estude a manipulação avançada de tabelas e request.security.
Скрипт с открытым кодом
В истинном духе TradingView, создатель этого скрипта сделал его открытым исходным кодом, чтобы трейдеры могли проверить и убедиться в его функциональности. Браво автору! Вы можете использовать его бесплатно, но помните, что перепубликация кода подчиняется нашим Правилам поведения.

Отказ от ответственности
Информация и публикации не предназначены для предоставления и не являются финансовыми, инвестиционными, торговыми или другими видами советов или рекомендаций, предоставленных или одобренных TradingView. Подробнее читайте в Условиях использования.
Скрипт с открытым кодом
В истинном духе TradingView, создатель этого скрипта сделал его открытым исходным кодом, чтобы трейдеры могли проверить и убедиться в его функциональности. Браво автору! Вы можете использовать его бесплатно, но помните, что перепубликация кода подчиняется нашим Правилам поведения.
Отказ от ответственности
Информация и публикации не предназначены для предоставления и не являются финансовыми, инвестиционными, торговыми или другими видами советов или рекомендаций, предоставленных или одобренных TradingView. Подробнее читайте в Условиях использования.