Polynomial Trend Exhaustion & Divergence
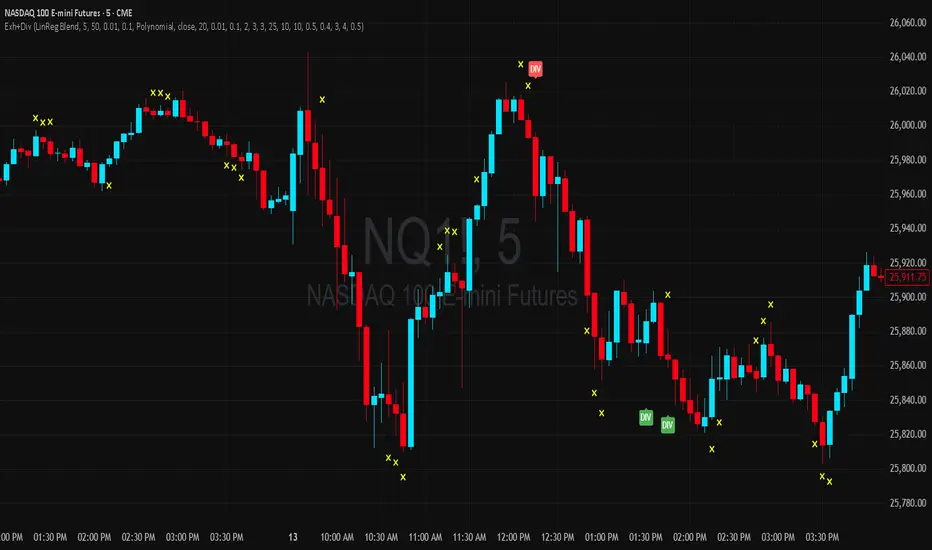
Polynomial Trend Exhaustion & Divergence
Overview
This indicator combines advanced polynomial regression analysis with momentum-based exhaustion detection and forecast-based divergence signals. It identifies potential trend reversals by analyzing when price momentum is fading (exhaustion) and when price direction conflicts with the mathematical trajectory projected by cubic polynomial forecasting (divergence).
The system uses optional source smoothing (Linear Regression Blend or Kalman filtering) to reduce noise before analysis, then applies two independent detection methods to generate high-probability reversal warnings.
Exhaustion Detection
What it detects: Trend exhaustion occurs when price is still moving in one direction but the underlying momentum is weakening—a classic early warning of potential reversal.
How it works:
The indicator calculates either a cubic polynomial regression or Kalman filter trend, then monitors the slope of that trend line. Exhaustion is detected when:
Bullish Exhaustion: The slope is positive (uptrend) but the rate of change of the slope is negative (momentum decelerating)
Bearish Exhaustion: The slope is negative (downtrend) but the rate of change of the slope is positive (momentum decelerating)
Signal filtering:
This produces clean, actionable warnings rather than noise during extended exhaustion phases.
Divergence Detection
What it detects: Divergence signals identify when the polynomial-projected future price path conflicts with current price direction—suggesting price may be overextended and due for a correction toward the forecast.
How it works:
The indicator fits a cubic polynomial to recent price data and extrapolates it forward by a configurable number of bars. It then compares:
Current price direction (rising or falling over the lookback period)
Forecast position (above or below current price)
Divergence triggers when:
Signal filtering:
Key Features
Overview
This indicator combines advanced polynomial regression analysis with momentum-based exhaustion detection and forecast-based divergence signals. It identifies potential trend reversals by analyzing when price momentum is fading (exhaustion) and when price direction conflicts with the mathematical trajectory projected by cubic polynomial forecasting (divergence).
The system uses optional source smoothing (Linear Regression Blend or Kalman filtering) to reduce noise before analysis, then applies two independent detection methods to generate high-probability reversal warnings.
Exhaustion Detection
What it detects: Trend exhaustion occurs when price is still moving in one direction but the underlying momentum is weakening—a classic early warning of potential reversal.
How it works:
The indicator calculates either a cubic polynomial regression or Kalman filter trend, then monitors the slope of that trend line. Exhaustion is detected when:
Bullish Exhaustion: The slope is positive (uptrend) but the rate of change of the slope is negative (momentum decelerating)
Bearish Exhaustion: The slope is negative (downtrend) but the rate of change of the slope is positive (momentum decelerating)
Signal filtering:
- Consecutive Bars Required: Exhaustion conditions must persist for a configurable number of bars before triggering
- Max Repeat Signals: Limits how many consecutive exhaustion signals can fire to prevent clustering
- Cooldown Period: After hitting the max signal limit, the indicator pauses before allowing new signals
This produces clean, actionable warnings rather than noise during extended exhaustion phases.
Divergence Detection
What it detects: Divergence signals identify when the polynomial-projected future price path conflicts with current price direction—suggesting price may be overextended and due for a correction toward the forecast.
How it works:
The indicator fits a cubic polynomial to recent price data and extrapolates it forward by a configurable number of bars. It then compares:
Current price direction (rising or falling over the lookback period)
Forecast position (above or below current price)
Divergence triggers when:
- Bullish Divergence: Price is falling but the polynomial forecast is above current price (suggesting upward reversion)
- Bearish Divergence: Price is rising but the polynomial forecast is below current price (suggesting downward reversion)
Signal filtering:
- Minimum Divergence (ATR): The forecast must be at least X ATRs away from price
- Minimum Price Movement (ATR): Price must have moved at least X ATRs over the lookback period (filters out sideways noise)
- Consecutive Bars Required: Divergence conditions must persist for X bars before triggering
- Cooldown Period: Minimum bars between divergence signals of the same type
Key Features
- Dual trend methods: Choose between Polynomial Regression or Kalman filtering for the base trend calculation
- Source smoothing options: None, LinReg Blend, or Kalman filter applied to OHLC data before analysis
- ATR-normalized thresholds: All filter thresholds adapt to current volatility
- Anti-clustering logic: Built-in repeat limits and cooldowns prevent signal spam during extended conditions
- Full alert support: All four signal types (Bull/Bear Exhaustion, Bullish/Bearish Divergence) have dedicated alert conditions

discord.gg/REapC6SGtz
b3artrades@gmail.com
b3artrades@gmail.com
Отказ от ответственности
Информация и публикации не предназначены для предоставления и не являются финансовыми, инвестиционными, торговыми или другими видами советов или рекомендаций, предоставленных или одобренных TradingView. Подробнее читайте в Условиях использования.
discord.gg/REapC6SGtz
b3artrades@gmail.com
b3artrades@gmail.com
Отказ от ответственности
Информация и публикации не предназначены для предоставления и не являются финансовыми, инвестиционными, торговыми или другими видами советов или рекомендаций, предоставленных или одобренных TradingView. Подробнее читайте в Условиях использования.