Обновлено
Turtle Soup Reversal Map [AGPro Series]
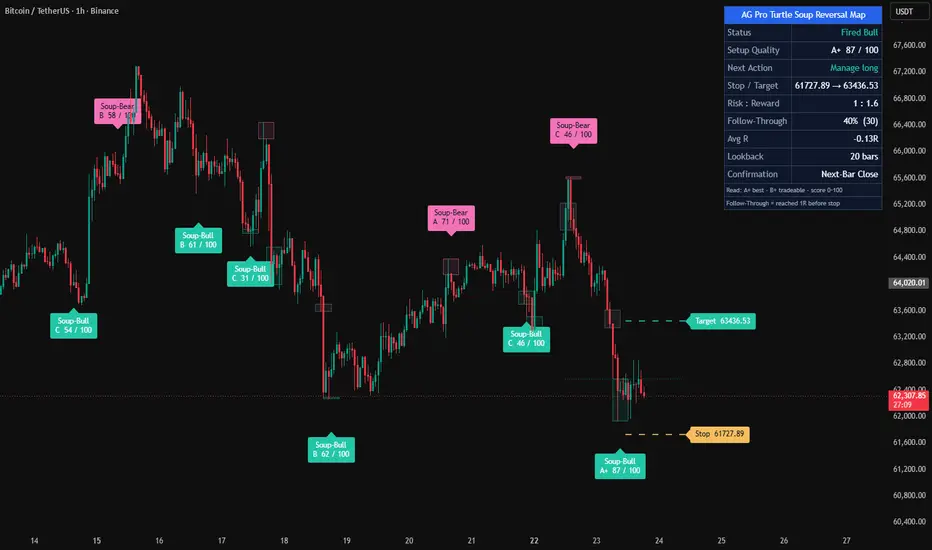
Turtle Soup Reversal Map [AGPro Series]
🔹 Overview
Turtle Soup Reversal Map is a mean-reversion pattern detector inspired by Linda Raschke's classic "Turtle Soup" setup — a counter-attack on failed 20-bar breakouts. When price pierces a multi-bar extreme and then closes back inside the prior range, institutional traders often interpret it as trapped breakout participants being flushed. This script automates the detection, qualifies each setup with a transparent 0–100 score, and projects a reference target alongside an auto-resolving rejection zone. It is designed for traders who want a disciplined, rule-based way to spot failed breakouts without drawing them manually.
🔹 Unique Edge
Unlike generic liquidity-sweep or wick-rejection indicators, Turtle Soup Reversal Map is built around Raschke's specific 20-bar-extreme rule — a pattern with decades of documented performance in swing-trading literature. Three characteristics separate it from similar tools:
• Strict N-bar-extreme definition (not a simple swing-high/low fade). Price must violate the exact prior-lookback extreme, not just a minor pivot.
• Five-component adaptive quality score — wick rejection, volume spike, overshoot magnitude, higher-timeframe trend alignment, and key-level proximity. Each component is a transparent weighted contribution, with clear A+ / A / B / C grades.
• Full lifecycle state engine — Pending → Fired → Target/Stop/Invalidated. Setups that do not confirm within their window are auto-invalidated (not left hanging), and live win-rate plus average R-multiple are tracked over the most recent resolved setups.
🔹 Methodology
The script continuously monitors for price piercing the highest high or lowest low of the prior N bars (default 20, range 10–50). When a sweep occurs, a Pending setup is created. Confirmation is then evaluated in one of two user-selectable modes:
• Same-Bar Close — the violating bar must close back inside the prior range on the same bar (faster, more signals).
• Next-Bar Close — Raschke's original specification; the next bar must close back inside the prior range (slower, higher reliability).
If confirmation fires, the setup becomes Fired and a reference target is projected from the confirmation close (default 2.5 × ATR(14)). Stop is placed at the sweep extreme plus a configurable ATR buffer. Setups that fail to confirm within their window, or where price overshoots the stop before confirmation, are automatically invalidated.
The quality score blends: wick-to-range ratio at the extreme bar, relative volume spike versus its 20-bar average, overshoot magnitude (ATR-normalized with a sweet-spot curve), counter-trend alignment against a user-defined higher timeframe, and proximity to round numbers or recent pivot levels.
🔹 Signals & Alerts
The script produces three alert types, all configurable:
• Pending — sweep detected, awaiting confirmation.
• Fired — confirmation closed back inside prior range.
• Invalidated — setup dismissed due to overshoot or window timeout.
Each alert message includes direction (Bull/Bear), current grade, ticker, and timeframe. Fired setups are visualized with a labeled confirmation marker, a dashed target-projection line, a dotted stop-reference line, and an auto-closing rejection zone. Labels display the Soup-Bull / Soup-Bear name, grade, and numeric score.
🔹 Key Inputs
• Lookback Bars — size of the extreme window (default 20, range 10–50).
• Confirmation Mode — Same-Bar Close or Next-Bar Close.
• Invalidation Distance (ATR) — stop buffer beyond the sweep extreme (default 0.5).
• Target Projection (ATR) — reference reversal target distance from entry (default 2.5).
• Quality Score Components — each of the five score components can be toggled independently for custom configurations.
• HTF for Trend — higher timeframe used for the trend-alignment component (default 240 min).
• Stats Sample Size — rolling window of resolved setups used for win-rate and average reward metrics (default 30).
• Visual & Panel Options — zones, lines, labels, target projection, panel location, font sizes, and per-element toggles.
🔹 How to Use
1. Apply to any liquid instrument and timeframe. The pattern's rule set is symbol-agnostic but performs differently across assets — review the live Win Rate and Avg Reward metrics in the panel to calibrate expectations.
2. Watch the Status field in the panel. Idle means no active setup; Pending Bull/Bear means a sweep has occurred and the script is waiting for confirmation; Fired Bull/Bear means confirmation closed and a target has been projected.
3. Filter setups by grade. A+ and A setups have stronger confluence — particularly wick rejection, volume, and HTF alignment. B setups are acceptable under favorable market regimes; C grades are educational only.
4. Treat the target projection as a reference, not a trade instruction. The stop reference line marks where the structural invalidation lies. Always combine with your own risk management.
5. The historical Win Rate is computed over the last N resolved setups on the current chart; it reflects the pattern's fit with the current symbol and timeframe, not a guarantee.
🔹 Limitations & Transparency
This indicator identifies historical setups algorithmically. It does not predict future price movement, and no indicator does. Turtle Soup is a counter-trend mean-reversion pattern — in strong trending regimes, false signals increase; in consolidation and range-bound conditions, it performs best. The displayed Win Rate and Avg Reward are historical, rolling, chart-dependent, and should not be interpreted as future expectations. Target and stop references are geometric projections based on ATR, not optimized parameters.
🔹 Risk Disclosure
This script is a technical analysis tool for educational and research purposes. It is not a trading strategy, not a recommendation, and not financial advice. Past performance does not guarantee future results. Always conduct your own analysis and use proper risk management. Trade at your own risk.
🔹 Overview
Turtle Soup Reversal Map is a mean-reversion pattern detector inspired by Linda Raschke's classic "Turtle Soup" setup — a counter-attack on failed 20-bar breakouts. When price pierces a multi-bar extreme and then closes back inside the prior range, institutional traders often interpret it as trapped breakout participants being flushed. This script automates the detection, qualifies each setup with a transparent 0–100 score, and projects a reference target alongside an auto-resolving rejection zone. It is designed for traders who want a disciplined, rule-based way to spot failed breakouts without drawing them manually.
🔹 Unique Edge
Unlike generic liquidity-sweep or wick-rejection indicators, Turtle Soup Reversal Map is built around Raschke's specific 20-bar-extreme rule — a pattern with decades of documented performance in swing-trading literature. Three characteristics separate it from similar tools:
• Strict N-bar-extreme definition (not a simple swing-high/low fade). Price must violate the exact prior-lookback extreme, not just a minor pivot.
• Five-component adaptive quality score — wick rejection, volume spike, overshoot magnitude, higher-timeframe trend alignment, and key-level proximity. Each component is a transparent weighted contribution, with clear A+ / A / B / C grades.
• Full lifecycle state engine — Pending → Fired → Target/Stop/Invalidated. Setups that do not confirm within their window are auto-invalidated (not left hanging), and live win-rate plus average R-multiple are tracked over the most recent resolved setups.
🔹 Methodology
The script continuously monitors for price piercing the highest high or lowest low of the prior N bars (default 20, range 10–50). When a sweep occurs, a Pending setup is created. Confirmation is then evaluated in one of two user-selectable modes:
• Same-Bar Close — the violating bar must close back inside the prior range on the same bar (faster, more signals).
• Next-Bar Close — Raschke's original specification; the next bar must close back inside the prior range (slower, higher reliability).
If confirmation fires, the setup becomes Fired and a reference target is projected from the confirmation close (default 2.5 × ATR(14)). Stop is placed at the sweep extreme plus a configurable ATR buffer. Setups that fail to confirm within their window, or where price overshoots the stop before confirmation, are automatically invalidated.
The quality score blends: wick-to-range ratio at the extreme bar, relative volume spike versus its 20-bar average, overshoot magnitude (ATR-normalized with a sweet-spot curve), counter-trend alignment against a user-defined higher timeframe, and proximity to round numbers or recent pivot levels.
🔹 Signals & Alerts
The script produces three alert types, all configurable:
• Pending — sweep detected, awaiting confirmation.
• Fired — confirmation closed back inside prior range.
• Invalidated — setup dismissed due to overshoot or window timeout.
Each alert message includes direction (Bull/Bear), current grade, ticker, and timeframe. Fired setups are visualized with a labeled confirmation marker, a dashed target-projection line, a dotted stop-reference line, and an auto-closing rejection zone. Labels display the Soup-Bull / Soup-Bear name, grade, and numeric score.
🔹 Key Inputs
• Lookback Bars — size of the extreme window (default 20, range 10–50).
• Confirmation Mode — Same-Bar Close or Next-Bar Close.
• Invalidation Distance (ATR) — stop buffer beyond the sweep extreme (default 0.5).
• Target Projection (ATR) — reference reversal target distance from entry (default 2.5).
• Quality Score Components — each of the five score components can be toggled independently for custom configurations.
• HTF for Trend — higher timeframe used for the trend-alignment component (default 240 min).
• Stats Sample Size — rolling window of resolved setups used for win-rate and average reward metrics (default 30).
• Visual & Panel Options — zones, lines, labels, target projection, panel location, font sizes, and per-element toggles.
🔹 How to Use
1. Apply to any liquid instrument and timeframe. The pattern's rule set is symbol-agnostic but performs differently across assets — review the live Win Rate and Avg Reward metrics in the panel to calibrate expectations.
2. Watch the Status field in the panel. Idle means no active setup; Pending Bull/Bear means a sweep has occurred and the script is waiting for confirmation; Fired Bull/Bear means confirmation closed and a target has been projected.
3. Filter setups by grade. A+ and A setups have stronger confluence — particularly wick rejection, volume, and HTF alignment. B setups are acceptable under favorable market regimes; C grades are educational only.
4. Treat the target projection as a reference, not a trade instruction. The stop reference line marks where the structural invalidation lies. Always combine with your own risk management.
5. The historical Win Rate is computed over the last N resolved setups on the current chart; it reflects the pattern's fit with the current symbol and timeframe, not a guarantee.
🔹 Limitations & Transparency
This indicator identifies historical setups algorithmically. It does not predict future price movement, and no indicator does. Turtle Soup is a counter-trend mean-reversion pattern — in strong trending regimes, false signals increase; in consolidation and range-bound conditions, it performs best. The displayed Win Rate and Avg Reward are historical, rolling, chart-dependent, and should not be interpreted as future expectations. Target and stop references are geometric projections based on ATR, not optimized parameters.
🔹 Risk Disclosure
This script is a technical analysis tool for educational and research purposes. It is not a trading strategy, not a recommendation, and not financial advice. Past performance does not guarantee future results. Always conduct your own analysis and use proper risk management. Trade at your own risk.
Информация о релизе
🔧 UPDATE NOTES - v1.5This update focuses on chart readability by removing label crowding.
The core purpose of the script remains unchanged.
This release improves how the existing setups are presented on the chart.
This script continues to function as an analytical and visualization tool.
It does not attempt to predict price direction or provide guaranteed outcomes.
------------------------
What Changed
------------------------
- On-chart label count is now capped
A new "Max Labels on Chart" setting keeps only the most recent setup labels visible. Older labels are removed automatically, so the chart no longer accumulates a long history of stacked labels.
- Setup labels keep a minimum spacing
The "Label Spacing (bars)" setting controls the minimum number of bars between consecutive labels, across both directions, so nearby setups no longer overlap. The default spacing has been increased for a cleaner look.
- Setups stay fully tracked
Even when a label is spaced out or removed by the cap, the underlying setup is still detected, scored, and counted in the panel and the win-rate and reward statistics. Nothing is lost from the analysis.
- Cleaner panel and alert text
Refined a few panel placeholders and alert messages to use plain, consistent characters for better cross-platform display.
------------------------
Visual Improvements
------------------------
- Removed accumulated historical labels for a much cleaner chart
- Reduced label overlap in clustered setup areas
- Kept the existing zones, reference lines, and target projections unchanged
- Adjusted default label spacing for a more balanced appearance
------------------------
Interface & Usability
------------------------
- Label spacing and maximum label count are fully adjustable from the settings
- Kept the existing panel layout and metric stack unchanged
- Enhanced overall presentation without changing core logic
------------------------
Behavior Notes
------------------------
This update does not change the core analytical logic of the script.
The detection, quality scoring, state engine, target projection, and statistics all behave exactly as before.
Users should interpret outputs the same way as before, but with a cleaner, less crowded chart.
------------------------
Limitations Reminder
------------------------
The script remains a rule-based analytical and visualization tool.
Market conditions such as volatility, liquidity, and timeframe differences may affect how setups, zones, and labels appear.
Outputs should always be interpreted within broader market context.
------------------------
Risk Reminder
------------------------
This script is for educational and analytical purposes only.
It does not provide financial advice or guaranteed trading outcomes.
Users remain responsible for their own decisions.
Информация о релизе
🔧 UPDATE NOTES - v1.9This update focuses on readability, chart cleanliness and turning the tool
into a clearer trade-decision read.
The core purpose of the script remains unchanged. It still detects 20-bar
extreme sweeps that fail and reverse (the classic Turtle Soup mean-reversion
setup) and scores their quality from 0 to 100. This release improves how that
logic is presented, organized and interpreted on the chart, and adds a clearer
next-action layer.
This script continues to function as an analytical and visualization tool.
It does not attempt to predict price direction or provide guaranteed outcomes.
------------------------
What Changed
------------------------
• Decision-engine panel
The panel now answers "what should I do now?" directly. A "Next Action" row
(Stand aside / Await confirm / Manage long / Manage short), a "Stop / Target"
row and a "Risk : Reward" row turn the read into an actionable plan rather than
a static status display.
• Honest, representative proof metric
The old win-rate measured every setup against the full extended target, which
under-represented how these reversals actually behave. It is replaced by a
stop-aware "Follow-Through" rate: the share of confirmed setups that advanced a
full 1R in the setup direction before the protective stop was reached. "Avg R"
is retained alongside it as the realized expectancy against the displayed target.
• Confirmed-bar statistics
Setup confirmation and resolution now commit only on confirmed bars, removing
intrabar repainting of the statistics and producing stable follow-through and
reward numbers.
• Contrast-aware text everywhere
Label and panel text now derives its color from the background luminance, so
score badges and panel values stay crisp and legible on every theme and symbol.
• ATR hardening
All ATR-based distances, projections and score normalizations now run through a
guarded ATR value, preventing distortion on illiquid symbols or warm-up bars.
------------------------
Visual Improvements
------------------------
• Zero label overlap: setup labels are now anchored just beyond the protective
stop, so the stop and target lines can no longer cross or sit on top of the
label text. Verified clean across multiple symbols and timeframes.
• Cleaner projections: target, stop and reference lines now belong to the active
setup only and are removed automatically the moment a setup resolves. The chart
no longer accumulates trailing dotted line fragments from past setups.
• Lighter footprint on higher timeframes: rejection zones are now compact, faded
markers at the sweep extreme instead of large blocks, so they provide context
without competing with price. Fired setups keep their directional color as
history, while failed (invalidated) sweeps are recolored to a neutral grey so
the chart stays full and textured while success and failure remain distinct.
• Matching stop and target lines: the protective stop and the projected target
are now drawn in the same dashed style for the active fired setup, each with
its own labelled price tag ("Stop ..." and "Target ..."), placed at the
projection edge so they never overlap the setup badge or candles.
• Cleaner early history: a warm-up guard prevents unreliable setups from being
generated on the very first bars of loaded data.
------------------------
Interface & Usability
------------------------
• Optimized panel layout for clearer information flow (status → action →
stop/target → risk:reward → proof stats → settings).
• Improved label readability and balanced default visual settings.
• Drawing density is capped by a single "Max Drawings on Chart" control.
------------------------
Behavior Notes
------------------------
This update does not change the core detection logic of the script. The sweep,
quality score and confirmation rules are unchanged. The goal is to improve
clarity, cleanliness and usability, and to present the proof statistics more
honestly.
Users should interpret outputs the same way as before, now with an explicit
next-action read and a follow-through metric instead of a target-only win rate.
------------------------
Limitations Reminder
------------------------
The script remains a rule-based analytical tool. Market conditions such as
volatility, liquidity and timeframe differences may affect how setups appear and
how often follow-through is reached. Outputs should always be interpreted within
broader market context.
------------------------
Risk Reminder
------------------------
This script is for educational and analytical purposes only. It does not provide
financial advice or guaranteed trading outcomes. Users remain responsible for
their own decisions.

Crypto Setup Planner: agprolabs.com/product/crypto-setup-planner/
Dynamic Channels Elite: agprolabs.com/product/dynamic-channels-elite/
Trading Suite: agprolabs.com/product/trading-suite-agpro-series/
Dynamic Channels Elite: agprolabs.com/product/dynamic-channels-elite/
Trading Suite: agprolabs.com/product/trading-suite-agpro-series/
Отказ от ответственности
Информация и публикации не предназначены для предоставления и не являются финансовыми, инвестиционными, торговыми или другими видами советов или рекомендаций, предоставленных или одобренных TradingView. Подробнее читайте в Условиях использования.
Crypto Setup Planner: agprolabs.com/product/crypto-setup-planner/
Dynamic Channels Elite: agprolabs.com/product/dynamic-channels-elite/
Trading Suite: agprolabs.com/product/trading-suite-agpro-series/
Dynamic Channels Elite: agprolabs.com/product/dynamic-channels-elite/
Trading Suite: agprolabs.com/product/trading-suite-agpro-series/
Отказ от ответственности
Информация и публикации не предназначены для предоставления и не являются финансовыми, инвестиционными, торговыми или другими видами советов или рекомендаций, предоставленных или одобренных TradingView. Подробнее читайте в Условиях использования.