OPEN-SOURCE SCRIPT
ICT Swing Structure [STL/STH/ ITL/ITH /LTL/LTH]
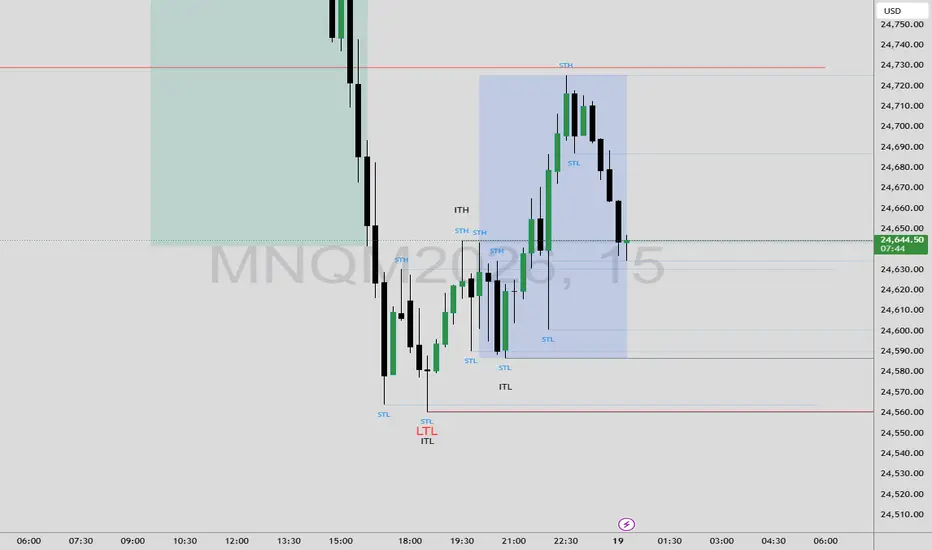
ICT Swing Structure [STL/STH · ITL/ITH · LTL/LTH]
This indicator automatically identifies and labels the three degrees of market structure as taught in the ICT (Inner Circle Trader) 2022 Mentorship — Short-Term, Intermediate-Term, and Long-Term swing highs and lows.
Price swings are classified into a nested hierarchy:
STH / STL — Short-Term Highs and Lows, the most frequent pivots on any timeframe
ITH / ITL — Intermediate-Term Highs and Lows, formed when a short-term swing is confirmed by surrounding short-term pivots on both sides
LTH / LTL — Long-Term Highs and Lows, the most significant turning points requiring intermediate-term confirmation on both sides
Each degree is displayed with a distinct color-coded label and a horizontal reference line extending forward from the swing point. Line lengths are scaled to significance — ST levels extend the shortest distance, LT levels the longest — keeping the chart clean while highlighting what matters most.
Fully customizable with toggles for each degree, adjustable pivot sensitivity, and individual color controls for ST, IT, and LT levels.
Best used as part of a top-down analysis workflow to define HTF bias, identify liquidity pools, and frame precision entries across all asset classes and timeframes.
This indicator automatically identifies and labels the three degrees of market structure as taught in the ICT (Inner Circle Trader) 2022 Mentorship — Short-Term, Intermediate-Term, and Long-Term swing highs and lows.
Price swings are classified into a nested hierarchy:
STH / STL — Short-Term Highs and Lows, the most frequent pivots on any timeframe
ITH / ITL — Intermediate-Term Highs and Lows, formed when a short-term swing is confirmed by surrounding short-term pivots on both sides
LTH / LTL — Long-Term Highs and Lows, the most significant turning points requiring intermediate-term confirmation on both sides
Each degree is displayed with a distinct color-coded label and a horizontal reference line extending forward from the swing point. Line lengths are scaled to significance — ST levels extend the shortest distance, LT levels the longest — keeping the chart clean while highlighting what matters most.
Fully customizable with toggles for each degree, adjustable pivot sensitivity, and individual color controls for ST, IT, and LT levels.
Best used as part of a top-down analysis workflow to define HTF bias, identify liquidity pools, and frame precision entries across all asset classes and timeframes.
Скрипт с открытым кодом
В истинном духе TradingView, создатель этого скрипта сделал его открытым исходным кодом, чтобы трейдеры могли проверить и убедиться в его функциональности. Браво автору! Вы можете использовать его бесплатно, но помните, что перепубликация кода подчиняется нашим Правилам поведения.

Отказ от ответственности
Информация и публикации не предназначены для предоставления и не являются финансовыми, инвестиционными, торговыми или другими видами советов или рекомендаций, предоставленных или одобренных TradingView. Подробнее читайте в Условиях использования.
Скрипт с открытым кодом
В истинном духе TradingView, создатель этого скрипта сделал его открытым исходным кодом, чтобы трейдеры могли проверить и убедиться в его функциональности. Браво автору! Вы можете использовать его бесплатно, но помните, что перепубликация кода подчиняется нашим Правилам поведения.
Отказ от ответственности
Информация и публикации не предназначены для предоставления и не являются финансовыми, инвестиционными, торговыми или другими видами советов или рекомендаций, предоставленных или одобренных TradingView. Подробнее читайте в Условиях использования.