Обновлено
The Islnd Tap and Fill
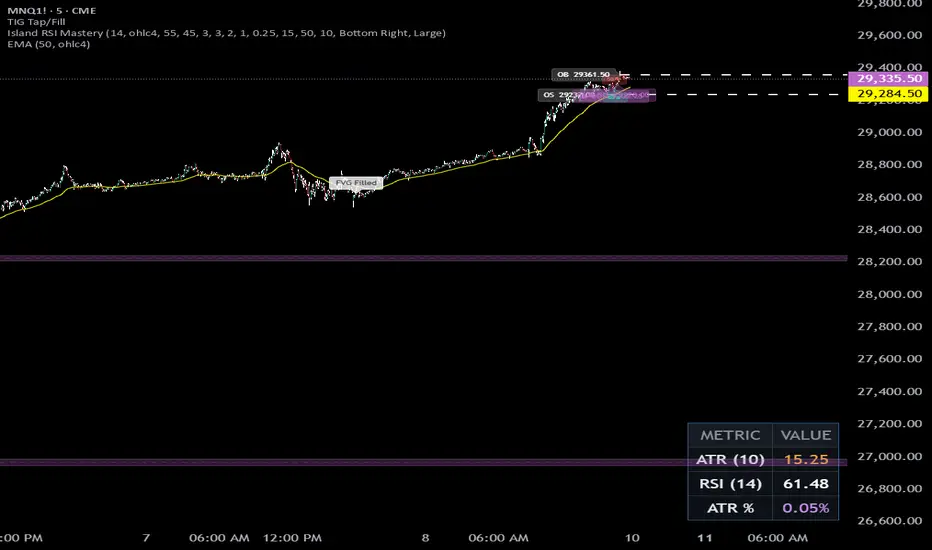
The Islnd Tap and Fill indicator automatically identifies and visualizes Bullish and Bearish Gaps using a three‑candle pattern.
It plots colored zones extended to the right, draws an optional midline with price labels, and tracks each gap’s lifecycle.
When price first trades back into a gap, the indicator marks a “Tap”; when price fully closes through the gap, it removes the zone and associated markings and prints an “FVG Filled” label.
This provides a clear, structured view of where price has left and later revisited imbalanced areas, supporting precise entry, management, and exit decisions.
It plots colored zones extended to the right, draws an optional midline with price labels, and tracks each gap’s lifecycle.
When price first trades back into a gap, the indicator marks a “Tap”; when price fully closes through the gap, it removes the zone and associated markings and prints an “FVG Filled” label.
This provides a clear, structured view of where price has left and later revisited imbalanced areas, supporting precise entry, management, and exit decisions.
Информация о релизе
Improved v2.0
Отказ от ответственности
Информация и публикации не предназначены для предоставления и не являются финансовыми, инвестиционными, торговыми или другими видами советов или рекомендаций, предоставленных или одобренных TradingView. Подробнее читайте в Условиях использования.
Отказ от ответственности
Информация и публикации не предназначены для предоставления и не являются финансовыми, инвестиционными, торговыми или другими видами советов или рекомендаций, предоставленных или одобренных TradingView. Подробнее читайте в Условиях использования.