OPEN-SOURCE SCRIPT
Обновлено GMS Ultimate Indicator
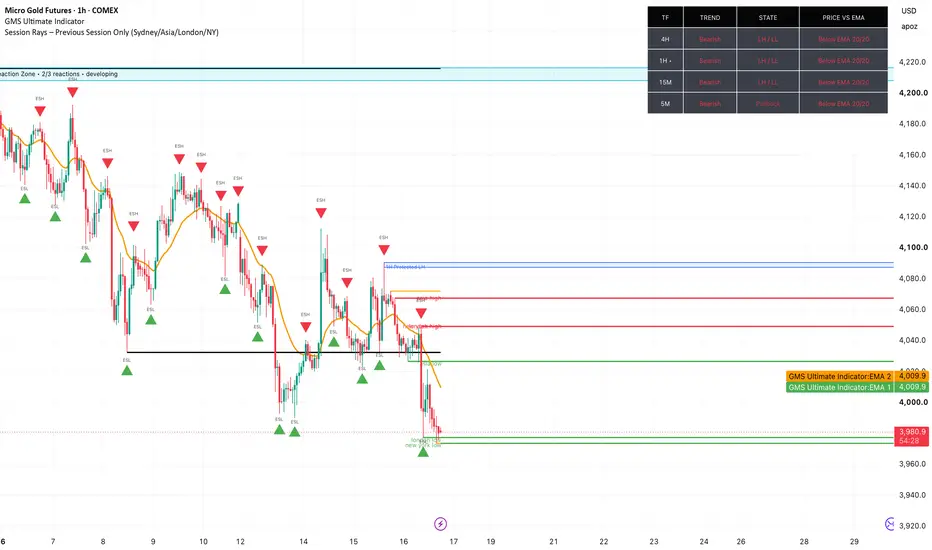
GMS Ultimate Indicator 9.0 is a customizable multi timeframe market structure and price action tool designed to help traders stay aligned with the dominant side of the market.
It analyzes the Daily, 4H, 1H, 15M, 5M, and 1M trends using HH/HL and LH/LL structure, while identifying pullbacks, consolidation, liquidity sweeps, BOS, CHOCH, protected structure, reaction zones, retests, and rejection candles. Its setup engine helps locate higher probability entries within the broader trend, with adjustable alerts, dashboard layouts, and display settings.
For analysis and educational purposes only. Use proper risk management and backtesting.
It analyzes the Daily, 4H, 1H, 15M, 5M, and 1M trends using HH/HL and LH/LL structure, while identifying pullbacks, consolidation, liquidity sweeps, BOS, CHOCH, protected structure, reaction zones, retests, and rejection candles. Its setup engine helps locate higher probability entries within the broader trend, with adjustable alerts, dashboard layouts, and display settings.
For analysis and educational purposes only. Use proper risk management and backtesting.
Информация о релизе
GMS Ultimate Indicator is a customizable multi timeframe market structure and price action tool designed to help traders stay aligned with the market’s direction. It tracks 4H, 1H, 15M, and 5M trend conditions, structure state, and price position relative to selected EMAs.The indicator also identifies BOS, CHOCH, swing highs and lows, liquidity pools and sweeps, previous day/week levels, protected 1H structure, 4H reaction zones, retests, rejection candles, potential setups, targets, and alerts.
Built for scalpers, intraday traders, and swing traders who use market structure and price action. For analysis and educational purposes only.
Информация о релизе
GMS Ultimate Indicator is a customizable multi timeframe market structure and price action tool designed to help traders stay aligned with the market’s direction. It tracks 4H, 1H, 15M, and 5M trend conditions, structure state, and price position relative to selected EMAs.The indicator also identifies BOS, CHOCH, swing highs and lows, liquidity pools and sweeps, previous day/week levels, protected 1H structure, 4H reaction zones, retests, rejection candles, potential setups, targets, and alerts.
Built for scalpers, intraday traders, and swing traders who use market structure and price action. For analysis and educational purposes only.
Информация о релизе
GMS Ultimate Indicator is a customizable multi timeframe market structure and price action tool designed to help traders stay aligned with the market’s direction. It tracks 4H, 1H, 15M, and 5M trend conditions, structure state, and price position relative to selected EMAs.The indicator also identifies BOS, CHOCH, swing highs and lows, liquidity pools and sweeps, previous day/week levels, protected 1H structure, 4H reaction zones, retests, rejection candles, potential setups, targets, and alerts.
Built for scalpers, intraday traders, and swing traders who use market structure and price action. For analysis and educational purposes only.
Информация о релизе
GMS Ultimate Indicator is a customizable multi timeframe market structure and price action tool designed to help traders stay aligned with the market’s direction. It tracks 4H, 1H, 15M, and 5M trend conditions, structure state, and price position relative to selected EMAs.The indicator also identifies BOS, CHOCH, swing highs and lows, liquidity pools and sweeps, previous day/week levels, protected 1H structure, 4H reaction zones, retests, rejection candles, potential setups, targets, and alerts.
Built for scalpers, intraday traders, and swing traders who use market structure and price action. For analysis and educational purposes only.
Информация о релизе
Updated : 12.9GMS Ultimate Indicator is a customizable multi timeframe market structure and price action tool designed to help traders stay aligned with the dominant side of the market.
It analyzes the Daily, 4H, 1H, 15M, 5M, and 1M trends using HH/HL and LH/LL structure, while identifying pullbacks, consolidation, liquidity sweeps, BOS, CHOCH, protected structure, reaction zones, retests, and rejection candles. Its setup engine helps locate higher probability entries within the broader trend, with adjustable alerts, dashboard layouts, and display settings.
For analysis and educational purposes only. Use proper risk management and backtesting.
Информация о релизе
Updated v 13.0 GMS Ultimate Indicator is a customizable multi timeframe market structure and price action tool designed to help traders stay aligned with the dominant side of the market.
It analyzes the Daily, 4H, 1H, 15M, 5M, and 1M trends using HH/HL and LH/LL structure, while identifying pullbacks, consolidation, liquidity sweeps, BOS, CHOCH, protected structure, reaction zones, retests, and rejection candles. Its setup engine helps locate higher probability entries within the broader trend, with adjustable alerts, dashboard layouts, and display settings.
For analysis and educational purposes only. Use proper risk management and backtesting.
Скрипт с открытым кодом
В истинном духе TradingView, создатель этого скрипта сделал его открытым исходным кодом, чтобы трейдеры могли проверить и убедиться в его функциональности. Браво автору! Вы можете использовать его бесплатно, но помните, что перепубликация кода подчиняется нашим Правилам поведения.

Отказ от ответственности
Информация и публикации не предназначены для предоставления и не являются финансовыми, инвестиционными, торговыми или другими видами советов или рекомендаций, предоставленных или одобренных TradingView. Подробнее читайте в Условиях использования.
Скрипт с открытым кодом
В истинном духе TradingView, создатель этого скрипта сделал его открытым исходным кодом, чтобы трейдеры могли проверить и убедиться в его функциональности. Браво автору! Вы можете использовать его бесплатно, но помните, что перепубликация кода подчиняется нашим Правилам поведения.
Отказ от ответственности
Информация и публикации не предназначены для предоставления и не являются финансовыми, инвестиционными, торговыми или другими видами советов или рекомендаций, предоставленных или одобренных TradingView. Подробнее читайте в Условиях использования.