Обновлено
HTF Candle Box [rare_gold_steak]
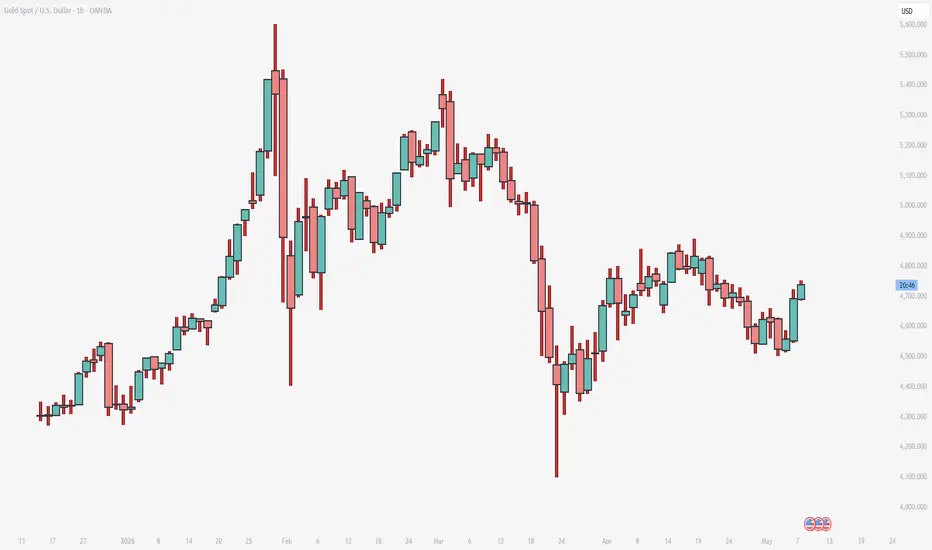
See the bigger picture
This indicator will overlay higher timeframe candles directly on your chart, so you can see the structure far more clearly. Whether you're on 1H showing 1D candles, or on 1D showing Weekly candles, it will make price easier to read at a glance
Plots the box as a normal candle would:
Everything is customizable. Enjoy
This indicator will overlay higher timeframe candles directly on your chart, so you can see the structure far more clearly. Whether you're on 1H showing 1D candles, or on 1D showing Weekly candles, it will make price easier to read at a glance
Plots the box as a normal candle would:
- Open — where price started the day
- Close — where price ended the day
- High — highest point reached
- Low — lowest point reached
Everything is customizable. Enjoy
Информация о релизе
Updated to show GREEN/RED candles on default. Can be turned off in the settings.
Отказ от ответственности
Информация и публикации не предназначены для предоставления и не являются финансовыми, инвестиционными, торговыми или другими видами советов или рекомендаций, предоставленных или одобренных TradingView. Подробнее читайте в Условиях использования.
Отказ от ответственности
Информация и публикации не предназначены для предоставления и не являются финансовыми, инвестиционными, торговыми или другими видами советов или рекомендаций, предоставленных или одобренных TradingView. Подробнее читайте в Условиях использования.