CRT 5m - Candle Range Theory
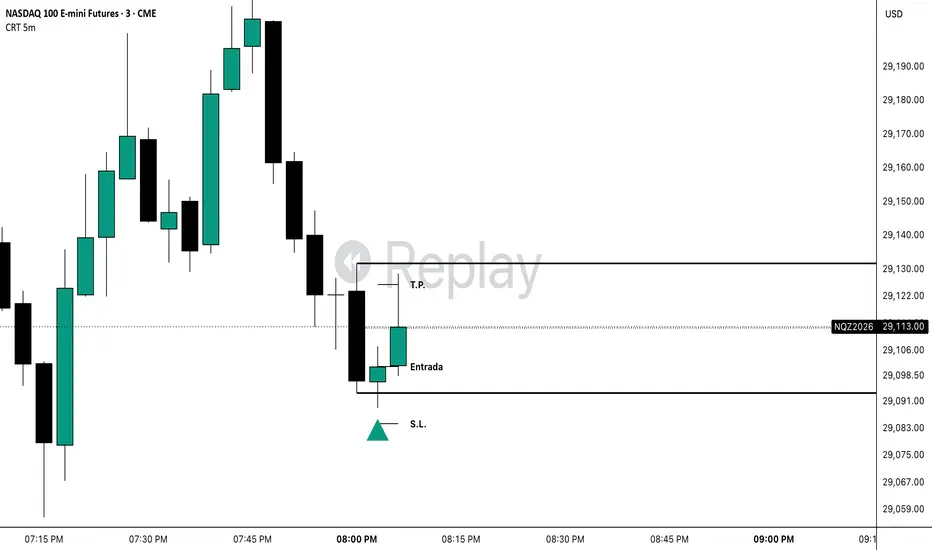
CRT 5m: Candle Range Theory
A visual tool that finds CRT (Candle Range Theory) setups on the 5-minute chart. It marks the range candle, shows where the setup invalidates, and plots entry, stop loss and take profit levels.
What it does
1. Range candle
Marks the high and low of the range candle, plus an optional 50% (equilibrium) line.
2. CRT detection
A sweep candle moves beyond one extreme of the range candle but closes back inside the range. If it closes outside, there is no CRT.
Bearish CRT: the sweep candle takes the high and closes back inside. The idea is a move toward the low of the range.
Bullish CRT: the sweep candle takes the low and closes back inside. The idea is a move toward the high of the range.
If a single candle breaks both sides of the range (an outside bar), it is ignored.
3. Entry, stop loss and take profit
All levels are measured on the sweep candle.
Entry: the price when the setup is confirmed.
Fibonacci 0: the candle extreme (the low for bullish setups, the high for bearish ones).
Stop loss: Fib -0.25 by default, which is 0.25 times the candle height beyond the extreme. The distance is adjustable.
Take profit: Fib 2 by default, adjustable.
Invalidation: if price touches the stop loss first, the entire CRT turns red. If a single candle touches both levels, the stop loss is assumed to be hit first.
4. Clean chart
By default it shows only one CRT at a time.
A new setup is not drawn until the current one touches its stop loss or take profit. When a new one appears, the old one is deleted. You can turn this off and keep several visible.
5. Immediate signal (optional)
The signal can appear as soon as the sweep conditions are met, without waiting for the candle to close. It also works in Replay mode and on live charts.
The signal stays even if price pulls back before the close, and the levels become fixed once the candle closes.
You can turn this off so signals appear only on candle close.
Customization
Colors, thickness and style (solid, dashed or dotted) for the range lines, the 50% line, and the entry, stop loss and take profit lines. The lines are black by default.
Line length, label size, bold text, and an option to show prices in the labels.
Marker shape (triangle, arrow, diamond, circle or square), size and color for bullish and bearish setups.
Color used when the stop loss is hit.
Optional filters: minimum range candle size (in ATR) and requiring the sweep candle to match the setup direction.
Alerts for bullish and bearish CRTs.
How to use it
Add the indicator to a 5-minute chart.
Wait for a candle to sweep the high or low of the previous candle and close back inside its range.
Use the plotted levels as a visual reference for entry, stop loss and take profit.
Adjust the stop loss and take profit Fibonacci levels in “CRT detection” to match your plan.
Set alerts from the alert menu if you want notifications.
Notes
It is designed for the 5-minute chart. Other timeframes will detect setups on that chart’s candles.
With the take profit at Fib 2 and the stop loss at Fib -0.25, the risk-to-reward ratio is roughly 0.8:1. Adjust both to fit your own approach.
A single sweep candle is evaluated at a time: the one right after the range candle.
Because the immediate signal fires before the candle closes, a candle can still close outside the range and no longer qualify as a CRT. Turn the option off if you prefer to wait for the close.
Test it on replay or demo before using it with real money, and track your results.
Disclaimer
This indicator is for educational and informational purposes only and is not financial advice. Past performance does not guarantee future results. Trading involves risk, and you are responsible for your own decisions.
A visual tool that finds CRT (Candle Range Theory) setups on the 5-minute chart. It marks the range candle, shows where the setup invalidates, and plots entry, stop loss and take profit levels.
What it does
1. Range candle
Marks the high and low of the range candle, plus an optional 50% (equilibrium) line.
2. CRT detection
A sweep candle moves beyond one extreme of the range candle but closes back inside the range. If it closes outside, there is no CRT.
Bearish CRT: the sweep candle takes the high and closes back inside. The idea is a move toward the low of the range.
Bullish CRT: the sweep candle takes the low and closes back inside. The idea is a move toward the high of the range.
If a single candle breaks both sides of the range (an outside bar), it is ignored.
3. Entry, stop loss and take profit
All levels are measured on the sweep candle.
Entry: the price when the setup is confirmed.
Fibonacci 0: the candle extreme (the low for bullish setups, the high for bearish ones).
Stop loss: Fib -0.25 by default, which is 0.25 times the candle height beyond the extreme. The distance is adjustable.
Take profit: Fib 2 by default, adjustable.
Invalidation: if price touches the stop loss first, the entire CRT turns red. If a single candle touches both levels, the stop loss is assumed to be hit first.
4. Clean chart
By default it shows only one CRT at a time.
A new setup is not drawn until the current one touches its stop loss or take profit. When a new one appears, the old one is deleted. You can turn this off and keep several visible.
5. Immediate signal (optional)
The signal can appear as soon as the sweep conditions are met, without waiting for the candle to close. It also works in Replay mode and on live charts.
The signal stays even if price pulls back before the close, and the levels become fixed once the candle closes.
You can turn this off so signals appear only on candle close.
Customization
Colors, thickness and style (solid, dashed or dotted) for the range lines, the 50% line, and the entry, stop loss and take profit lines. The lines are black by default.
Line length, label size, bold text, and an option to show prices in the labels.
Marker shape (triangle, arrow, diamond, circle or square), size and color for bullish and bearish setups.
Color used when the stop loss is hit.
Optional filters: minimum range candle size (in ATR) and requiring the sweep candle to match the setup direction.
Alerts for bullish and bearish CRTs.
How to use it
Add the indicator to a 5-minute chart.
Wait for a candle to sweep the high or low of the previous candle and close back inside its range.
Use the plotted levels as a visual reference for entry, stop loss and take profit.
Adjust the stop loss and take profit Fibonacci levels in “CRT detection” to match your plan.
Set alerts from the alert menu if you want notifications.
Notes
It is designed for the 5-minute chart. Other timeframes will detect setups on that chart’s candles.
With the take profit at Fib 2 and the stop loss at Fib -0.25, the risk-to-reward ratio is roughly 0.8:1. Adjust both to fit your own approach.
A single sweep candle is evaluated at a time: the one right after the range candle.
Because the immediate signal fires before the candle closes, a candle can still close outside the range and no longer qualify as a CRT. Turn the option off if you prefer to wait for the close.
Test it on replay or demo before using it with real money, and track your results.
Disclaimer
This indicator is for educational and informational purposes only and is not financial advice. Past performance does not guarantee future results. Trading involves risk, and you are responsible for your own decisions.

Отказ от ответственности
Информация и публикации не предназначены для предоставления и не являются финансовыми, инвестиционными, торговыми или другими видами советов или рекомендаций, предоставленных или одобренных TradingView. Подробнее читайте в Условиях использования.
Отказ от ответственности
Информация и публикации не предназначены для предоставления и не являются финансовыми, инвестиционными, торговыми или другими видами советов или рекомендаций, предоставленных или одобренных TradingView. Подробнее читайте в Условиях использования.