FVG Low Momentum Volume Stats
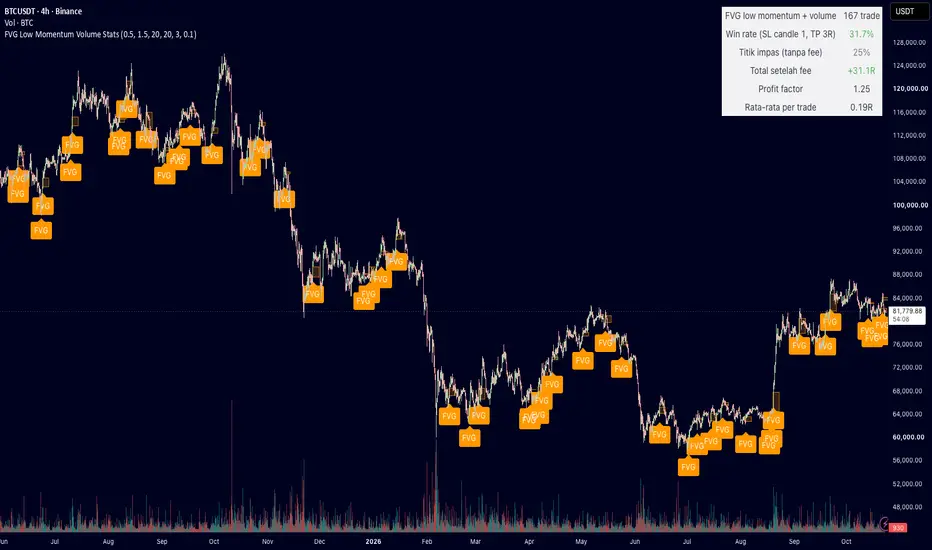
FVG Low Momentum Volume Stats marks bullish fair value gaps (FVG) where the third candle is small ("low momentum") and the middle candle has above-average volume, simulates a limit-entry trade for each gap, and shows the results in a statistics panel.
Rules (all thresholds are inputs):
- Bullish FVG: low of candle 3 above the high of candle 1, candle 2 closes green.
- Low momentum: candle 3 body <= 0.5x candle 2 body AND candle 3 range <= 0.5x candle 2 range.
- Volume: candle 2 volume >= 1.5x the average volume of the previous 20 candles.
Trade simulation:
- Limit entry at the top of the gap if price returns within 20 candles; stop loss at the low of candle 1; take profit at 3R (input). Overlapping trades are allowed; if stop and target are hit in the same candle, the stop is counted first.
- Fees of 0.1% per side are deducted in R.
- The panel shows trades, win rate, break-even win rate for the chosen R, total R after fees, profit factor and average R per trade for the selected date range.
Notes: signals are confirmed on candle close and do not repaint. Historical statistics only; results depend on symbol, timeframe and period; not a trading recommendation.
Rules (all thresholds are inputs):
- Bullish FVG: low of candle 3 above the high of candle 1, candle 2 closes green.
- Low momentum: candle 3 body <= 0.5x candle 2 body AND candle 3 range <= 0.5x candle 2 range.
- Volume: candle 2 volume >= 1.5x the average volume of the previous 20 candles.
Trade simulation:
- Limit entry at the top of the gap if price returns within 20 candles; stop loss at the low of candle 1; take profit at 3R (input). Overlapping trades are allowed; if stop and target are hit in the same candle, the stop is counted first.
- Fees of 0.1% per side are deducted in R.
- The panel shows trades, win rate, break-even win rate for the chosen R, total R after fees, profit factor and average R per trade for the selected date range.
Notes: signals are confirmed on candle close and do not repaint. Historical statistics only; results depend on symbol, timeframe and period; not a trading recommendation.

Отказ от ответственности
Информация и публикации не предназначены для предоставления и не являются финансовыми, инвестиционными, торговыми или другими видами советов или рекомендаций, предоставленных или одобренных TradingView. Подробнее читайте в Условиях использования.
Отказ от ответственности
Информация и публикации не предназначены для предоставления и не являются финансовыми, инвестиционными, торговыми или другими видами советов или рекомендаций, предоставленных или одобренных TradingView. Подробнее читайте в Условиях использования.