OPEN-SOURCE SCRIPT
Обновлено quick levels and zones
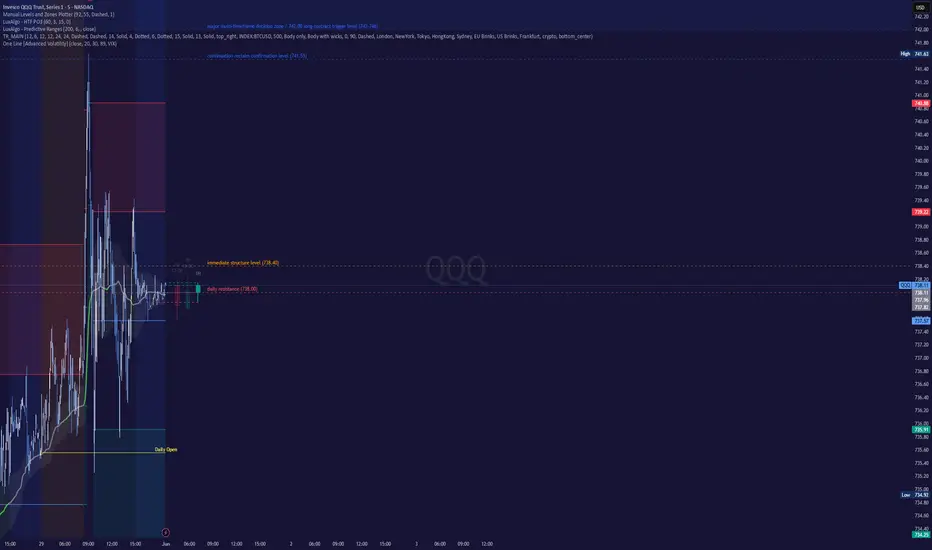
Manual Levels and Zones Plotter is a lightweight, high-utility tool designed to instantly map out your entire technical analysis framework from a single text block. Simply paste your raw text notes, level levels, or automated scanner outputs directly into the indicator settings, and the script handles the rest.
🚀 Key Features
Instant Bulk Plotting: Parses multiple lines of text simultaneously. No more manual line drawings or repeating actions for every single price point.
Dynamic Range & Zone Detection: If a line contains a price range (e.g., 742–746 major resistance zone), the script automatically detects it and draws a shaded visual box (zone) instead of a single line.
Smart Color Coding: Automatically identifies key market terms within your text notes and applies contextual color profiles:
🔴 Red: Exhaustion, Resistance, Outliers
🟢 Green: Support, Expansion Targets
🟠 Orange: Pivot points, Line-in-the-sand levels
⚪ Gray: Standard micro or unclassified levels
Smart Label Staggering: Labels are dynamically staggered off the right edge of the price action (bar_index + spacer) to prevent overlap and maintain a pristine, readable chart view.
Replay & Real-Time Performance Optimized: Built using persistent garbage-collection arrays running strictly on barstate.islast. It renders flawlessly during historical Bar Replay sessions without lagging your chart or cluttering background memory.
🛠 How to Use It
Open the indicator settings window.
In the "Paste Levels Here" text area, paste your levels. Each level must be on its own line, starting with the numeric price value.
Example format:
Plaintext
766.70 outlier monthly resistance
742–746 major resistance zone
733.55 daily pivot / line in the sand
708.43 weekly support
Toggle "Extend Across Entire Screen?" to choose between historical infinite projections or localized, clean right-side tracking.
🚀 Key Features
Instant Bulk Plotting: Parses multiple lines of text simultaneously. No more manual line drawings or repeating actions for every single price point.
Dynamic Range & Zone Detection: If a line contains a price range (e.g., 742–746 major resistance zone), the script automatically detects it and draws a shaded visual box (zone) instead of a single line.
Smart Color Coding: Automatically identifies key market terms within your text notes and applies contextual color profiles:
🔴 Red: Exhaustion, Resistance, Outliers
🟢 Green: Support, Expansion Targets
🟠 Orange: Pivot points, Line-in-the-sand levels
⚪ Gray: Standard micro or unclassified levels
Smart Label Staggering: Labels are dynamically staggered off the right edge of the price action (bar_index + spacer) to prevent overlap and maintain a pristine, readable chart view.
Replay & Real-Time Performance Optimized: Built using persistent garbage-collection arrays running strictly on barstate.islast. It renders flawlessly during historical Bar Replay sessions without lagging your chart or cluttering background memory.
🛠 How to Use It
Open the indicator settings window.
In the "Paste Levels Here" text area, paste your levels. Each level must be on its own line, starting with the numeric price value.
Example format:
Plaintext
766.70 outlier monthly resistance
742–746 major resistance zone
733.55 daily pivot / line in the sand
708.43 weekly support
Toggle "Extend Across Entire Screen?" to choose between historical infinite projections or localized, clean right-side tracking.
Информация о релизе
fixed alignmentИнформация о релизе
stuffИнформация о релизе
fixed the alignmentИнформация о релизе
more optionsСкрипт с открытым кодом
В истинном духе TradingView, создатель этого скрипта сделал его открытым исходным кодом, чтобы трейдеры могли проверить и убедиться в его функциональности. Браво автору! Вы можете использовать его бесплатно, но помните, что перепубликация кода подчиняется нашим Правилам поведения.

Отказ от ответственности
Информация и публикации не предназначены для предоставления и не являются финансовыми, инвестиционными, торговыми или другими видами советов или рекомендаций, предоставленных или одобренных TradingView. Подробнее читайте в Условиях использования.
Скрипт с открытым кодом
В истинном духе TradingView, создатель этого скрипта сделал его открытым исходным кодом, чтобы трейдеры могли проверить и убедиться в его функциональности. Браво автору! Вы можете использовать его бесплатно, но помните, что перепубликация кода подчиняется нашим Правилам поведения.
Отказ от ответственности
Информация и публикации не предназначены для предоставления и не являются финансовыми, инвестиционными, торговыми или другими видами советов или рекомендаций, предоставленных или одобренных TradingView. Подробнее читайте в Условиях использования.