MTF Trend Dashboard
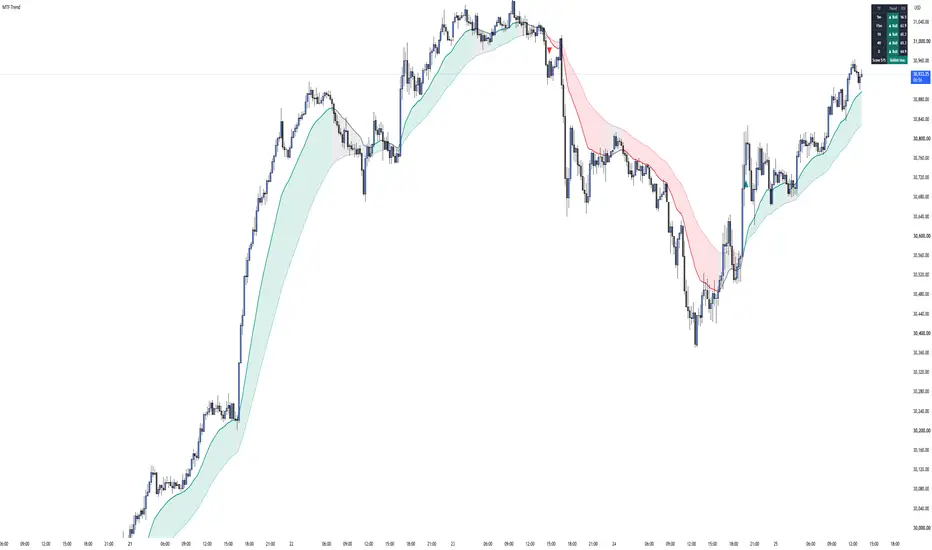
MTF Trend Dashboard shows the trend of five timeframes in one table, so you can check multi-timeframe alignment without switching charts.
How it works:
Each timeframe is classified as:
- Bullish: price above the fast EMA, fast EMA above the slow EMA, and RSI above 50
- Bearish: price below the fast EMA, fast EMA below the slow EMA, and RSI below 50
- Neutral: anything else
The Score row adds all timeframes together (from -5 to +5) and shows an overall bias.
On the chart:
- Fast and slow EMA with a cloud colored by the current trend
- Optional triangles for EMA crossovers
Alerts:
- Bullish / bearish EMA cross
- All timeframes bullish / bearish
Settings:
All EMA lengths, RSI length, the five timeframes, and the table position and size can be changed.
Note: this is a trend-analysis tool, not a trading signal or financial advice. Values on higher timeframes update in real time and can change until the higher-timeframe bar closes.
How it works:
Each timeframe is classified as:
- Bullish: price above the fast EMA, fast EMA above the slow EMA, and RSI above 50
- Bearish: price below the fast EMA, fast EMA below the slow EMA, and RSI below 50
- Neutral: anything else
The Score row adds all timeframes together (from -5 to +5) and shows an overall bias.
On the chart:
- Fast and slow EMA with a cloud colored by the current trend
- Optional triangles for EMA crossovers
Alerts:
- Bullish / bearish EMA cross
- All timeframes bullish / bearish
Settings:
All EMA lengths, RSI length, the five timeframes, and the table position and size can be changed.
Note: this is a trend-analysis tool, not a trading signal or financial advice. Values on higher timeframes update in real time and can change until the higher-timeframe bar closes.

Отказ от ответственности
Информация и публикации не предназначены для предоставления и не являются финансовыми, инвестиционными, торговыми или другими видами советов или рекомендаций, предоставленных или одобренных TradingView. Подробнее читайте в Условиях использования.
Отказ от ответственности
Информация и публикации не предназначены для предоставления и не являются финансовыми, инвестиционными, торговыми или другими видами советов или рекомендаций, предоставленных или одобренных TradingView. Подробнее читайте в Условиях использования.