Pivot Trail - Swing Levels
PIVOT TRAIL - SWING LEVELS
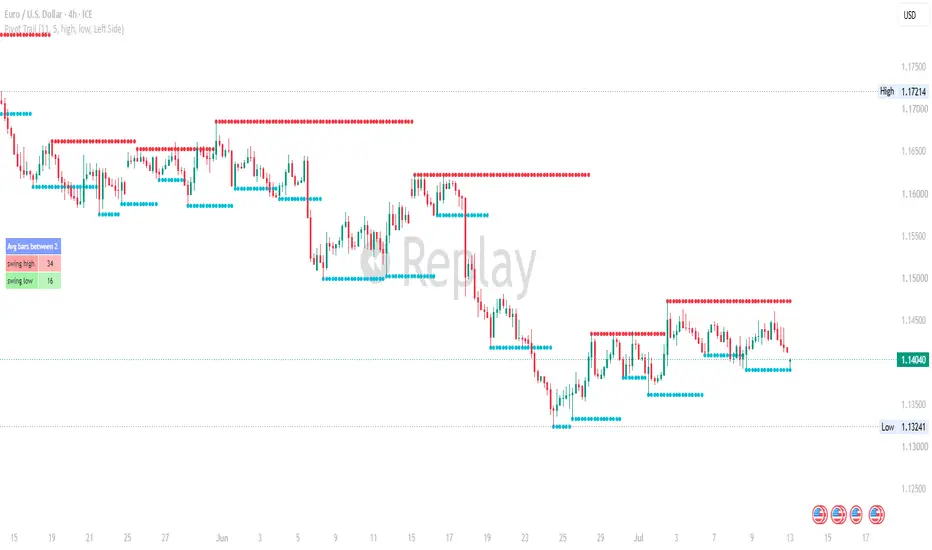
Pivot Trail plots confirmed swing highs and swing lows as dotted horizontal levels that follow price. It also shows how often swings tend to form on your chart.
HOW IT WORKS
A swing high is a bar whose high is the highest among the chosen number of bars on both sides of it. A swing low is the same idea for lows. Each swing is confirmed only after those bars have closed, so confirmed levels never repaint.
Each level starts at the actual pivot candle, not the candle where it was confirmed. It then holds until the next swing of the same type forms. A short live segment keeps the newest level reaching the current bar.
FEATURES
- Red dotted trail for swing highs, cyan dotted trail for swing lows
- Separate strength settings for highs and lows
- Selectable source for each side (default: High for highs, Low for lows)
- Info table showing the average number of bars between two consecutive swing highs and two consecutive swing lows
- Table can sit on the left or right side of the chart
SETTINGS
- Swing high strength (default 11): bars required on each side to confirm a swing high
- Swing low strength (default 5): bars required on each side to confirm a swing low
- Swing high source / Swing low source: price series used for detection
- Show Info Table: turns the table on or off
- Table Position: Left Side or Right Side
HOW TO USE
- Treat the levels as support and resistance zones: swing highs often act as resistance, swing lows as support.
- A close beyond a level can point to a break of structure or a trend change.
- Use the table to gauge swing rhythm. A high average means slower, wider swings; a low average means faster, tighter ones.
- Higher strength values give fewer, more significant swings. Lower values give more frequent, more sensitive ones.
NOTES
- Swings are confirmed with a delay equal to the strength setting, which is how pivots avoid repainting.
- Works on any symbol and timeframe.
- This is a charting tool, not financial advice. Always combine it with your own analysis and risk management.
Pivot Trail plots confirmed swing highs and swing lows as dotted horizontal levels that follow price. It also shows how often swings tend to form on your chart.
HOW IT WORKS
A swing high is a bar whose high is the highest among the chosen number of bars on both sides of it. A swing low is the same idea for lows. Each swing is confirmed only after those bars have closed, so confirmed levels never repaint.
Each level starts at the actual pivot candle, not the candle where it was confirmed. It then holds until the next swing of the same type forms. A short live segment keeps the newest level reaching the current bar.
FEATURES
- Red dotted trail for swing highs, cyan dotted trail for swing lows
- Separate strength settings for highs and lows
- Selectable source for each side (default: High for highs, Low for lows)
- Info table showing the average number of bars between two consecutive swing highs and two consecutive swing lows
- Table can sit on the left or right side of the chart
SETTINGS
- Swing high strength (default 11): bars required on each side to confirm a swing high
- Swing low strength (default 5): bars required on each side to confirm a swing low
- Swing high source / Swing low source: price series used for detection
- Show Info Table: turns the table on or off
- Table Position: Left Side or Right Side
HOW TO USE
- Treat the levels as support and resistance zones: swing highs often act as resistance, swing lows as support.
- A close beyond a level can point to a break of structure or a trend change.
- Use the table to gauge swing rhythm. A high average means slower, wider swings; a low average means faster, tighter ones.
- Higher strength values give fewer, more significant swings. Lower values give more frequent, more sensitive ones.
NOTES
- Swings are confirmed with a delay equal to the strength setting, which is how pivots avoid repainting.
- Works on any symbol and timeframe.
- This is a charting tool, not financial advice. Always combine it with your own analysis and risk management.

Отказ от ответственности
Информация и публикации не предназначены для предоставления и не являются финансовыми, инвестиционными, торговыми или другими видами советов или рекомендаций, предоставленных или одобренных TradingView. Подробнее читайте в Условиях использования.
Отказ от ответственности
Информация и публикации не предназначены для предоставления и не являются финансовыми, инвестиционными, торговыми или другими видами советов или рекомендаций, предоставленных или одобренных TradingView. Подробнее читайте в Условиях использования.