OPEN-SOURCE SCRIPT
nifty vwap 3
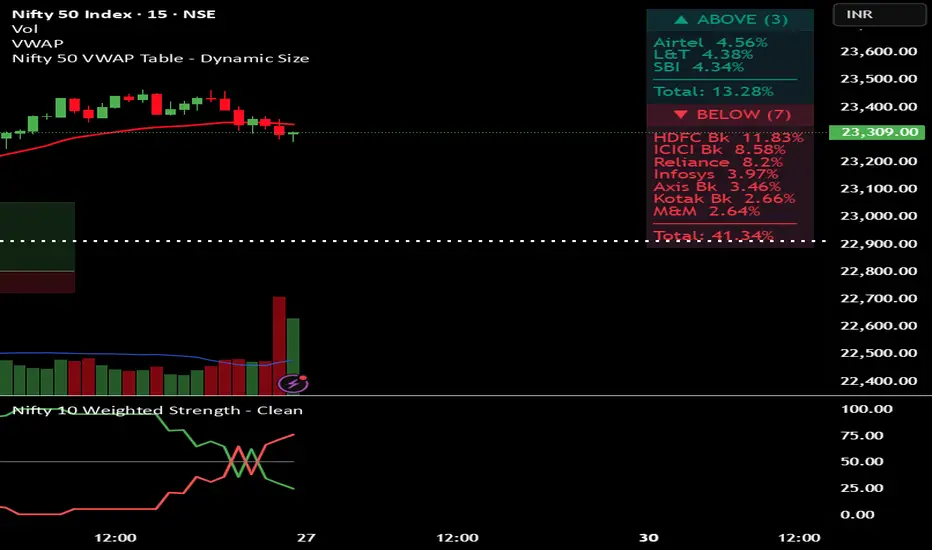
Monitors the "Big Players"
It tracks the 10 most important stocks (like HDFC Bank, Reliance, and ICICI Bank) because these stocks carry the most "weight" and usually decide where the Nifty index goes.
2. The VWAP Test (The Filter)
For each stock, the code checks:
Is the current price Above its average price (VWAP)?
Or is it Below its average price?
Why? If a stock is above VWAP, it is considered Strong (buyers are in control). If it is below, it is Weak (sellers are in control).
3. Calculates "Power" (Weightage)
Instead of just counting stocks, it calculates their combined percentage in the Nifty.
Example: If only 3 stocks are "Above VWAP" but they are the biggest ones (like HDFC and Reliance), the "Total Weight" might still be very high (e.g., 30%), suggesting the market has underlying strength despite fewer stocks being green.
4. Visual Table
It puts all this info into a neat Table on the top-right of your chart.
Teal Section: Shows stocks that are Strong/Bullish.
Red Section: Shows stocks that are Weak/Bearish.
Summary: It tells you exactly how many stocks are on each side and their total percentage impact.
It tracks the 10 most important stocks (like HDFC Bank, Reliance, and ICICI Bank) because these stocks carry the most "weight" and usually decide where the Nifty index goes.
2. The VWAP Test (The Filter)
For each stock, the code checks:
Is the current price Above its average price (VWAP)?
Or is it Below its average price?
Why? If a stock is above VWAP, it is considered Strong (buyers are in control). If it is below, it is Weak (sellers are in control).
3. Calculates "Power" (Weightage)
Instead of just counting stocks, it calculates their combined percentage in the Nifty.
Example: If only 3 stocks are "Above VWAP" but they are the biggest ones (like HDFC and Reliance), the "Total Weight" might still be very high (e.g., 30%), suggesting the market has underlying strength despite fewer stocks being green.
4. Visual Table
It puts all this info into a neat Table on the top-right of your chart.
Teal Section: Shows stocks that are Strong/Bullish.
Red Section: Shows stocks that are Weak/Bearish.
Summary: It tells you exactly how many stocks are on each side and their total percentage impact.
Скрипт с открытым кодом
В истинном духе TradingView, создатель этого скрипта сделал его открытым исходным кодом, чтобы трейдеры могли проверить и убедиться в его функциональности. Браво автору! Вы можете использовать его бесплатно, но помните, что перепубликация кода подчиняется нашим Правилам поведения.

Отказ от ответственности
Информация и публикации не предназначены для предоставления и не являются финансовыми, инвестиционными, торговыми или другими видами советов или рекомендаций, предоставленных или одобренных TradingView. Подробнее читайте в Условиях использования.
Скрипт с открытым кодом
В истинном духе TradingView, создатель этого скрипта сделал его открытым исходным кодом, чтобы трейдеры могли проверить и убедиться в его функциональности. Браво автору! Вы можете использовать его бесплатно, но помните, что перепубликация кода подчиняется нашим Правилам поведения.
Отказ от ответственности
Информация и публикации не предназначены для предоставления и не являются финансовыми, инвестиционными, торговыми или другими видами советов или рекомендаций, предоставленных или одобренных TradingView. Подробнее читайте в Условиях использования.