Обновлено
Order Flow AI [Pickmytrade]
Does strong estimated buying or selling move price, or meet limited response? Order Flow AI compares directional activity with candle movement, maps its price distribution, and learns what followed similar marked events.
――――――――――――――――――――
🔷 WHAT THE CHART SHOWS
🔸 Blue represents estimated buying, orange selling, and grey unresolved neutral volume. Lower-timeframe up/down candles classify volume as buying/selling. Dojis compare with the previous intrabar close, then inherit the last resolved direction; initially unresolved observations remain neutral.
🔸 Circles mark DRIVE: strong estimated pressure with aligned candle-body movement. Diamonds mark RESISTED: pressure with limited or opposing movement. Buying resisted can accompany falling price; selling resisted can accompany rising price. Neither confirms absorption or instructs an entry.
🔸 Default marks require ≥25% absolute estimated imbalance and ≥1.2× relative volume. DRIVE requires ≥0.35 prior ATR aligned response; RESISTED requires ≤0.10 ATR. Intermediate responses receive no mark. Shared spacing is three bars.
🔸 The response measures close minus open, normalized by the previous bar’s 14-period ATR. Opening gaps are excluded. Relative volume compares with the 30 immediately preceding chart bars, all requiring usable source data.
――――――――――――――――――――
🔷 PROFILE AND DISTRIBUTION RIBBON
🔸 The profile places selling left, buying right, and neutral volume in grey. A pale outline marks the highest-volume approximate bin. Peak-row depth faces are decorative, not confidence readings.
🔸 Contributions are allocated once to intrabar HLC3, or cached side-group weighted HLC3. This approximates volume at price. Both sides share a width scale; rounding and minimum one-bar widths enlarge tiny segments.
🔸 The ribbon shows a rolling volume-weighted HLC3 mean and three translucent layers extending to one weighted standard deviation. At least 80% of its window needs usable source data. Colour follows net classified volume, grey near balance. Its bounds are descriptive, not defended levels or projected targets; its mean is not session-anchored VWAP.
🔸 The default profile samples 48 chart bars ending at the rightmost visible closed candle. Panning rebuilds this sample and selects historical dashboard readings; it does not profile every visible candle.
――――――――――――――――――――
🔷 REAL OUTCOME LEARNING
🔸 AI here means an optional, distance-weighted k-nearest-neighbour ML classifier that learns from resolved DRIVE/RESISTED cases, collecting eligible examples during warm-up and abstention. No external classifier or pretrained AI model is imported. Its historical similarity vote is not a guarantee of future movement.
🔸 Seven features, normalized to 0–1: absolute imbalance, relative activity, aligned body response, pressure-side wick, aligned close location, signed distance from flow mean, and aligned rolling volume share. Buying/selling use comparable pressure-relative coordinates.
🔸 Features, origin close and prior ATR freeze at the confirmed event close. From the NEXT bar, ±0.75 frozen ATR barriers define continuation if the pressure-side barrier is first, opposition if the other is first. The twelfth later bar counts. Same-candle double touches, timeouts and invalid outcome prices are discarded.
🔸 Only already-resolved cases train the classifier. Exact K nearest cases use mean log(1 + absolute feature difference) across seven features. This Lorentzian-style similarity does not model spacetime or detect news.
🔸 Inverse-distance weights favour nearer cases. Effective neighbour weight count controls shrinkage toward base rate (continuations + 1) / (library size + 2). The library retains the latest 240 resolved cases.
🔸 Warm-up requires 40 resolved cases and both outcomes. All selected neighbours must pass the 0.16 mean log-distance ceiling; otherwise the engine reports LEARNING, NEED BOTH OUTCOMES or NO CLOSE ANALOGUE.
――――――――――――――――――――
🔷 READING THE ML VALUE
🔸 C means historical continuation vote in the original pressure direction; lower values favour opposition. Discarded cases do not vote: the reading is CONDITIONAL on a decisive outcome within the deadline, not a calibrated probability for every event or a trade win rate.
🔸 Vote and baseline freeze at the event close and are never backfilled. The dashboard identifies that event’s age and spells out its continuation vote. Between the two configured thresholds it says “no threshold met”. Optional diagnostics show library, base and decisive/discarded counts. C badges preserve pressure colour; circles/diamonds still describe observed response.
🔸 The chart guide explains all four markers. Blue circle: buying pressure moved price up. Orange circle: selling pressure moved price down. Blue diamond: buying met small or opposing response. Orange diamond: selling met small or opposing response. Colours describe estimated pressure, not automatic entry orders.
🔸 Short shaded rectangles highlight past resisted candles. Profile rectangles represent estimated volume at price. “SELL VOL” / “BUY VOL” identify the volume sides; neither the shelves nor profile bars are entry signals. The guide can be hidden independently of the dashboard.
🔸 Research diagnostics compare saved votes with later outcomes using Brier error and the frozen base. Overlapping cases are dependent. A fixed 30-day BTCUSDT/ETHUSDT 15m reconstruction did not outperform the baseline on either symbol; no trading edge is established.
――――――――――――――――――――
🔷 ALERTS AND AUTOMATION
🔸 Six informational conditions: Buying pressure drives price; Selling pressure drives price; Buying pressure resisted; Selling pressure resisted; ML continuation vote above threshold; ML opposition vote above threshold.
🔸 Create the required TradingView alert using Once Per Bar Close. Default ML thresholds are C ≥65% for continuation and C ≤35% for opposition. Messages identify the ticker and interval.
🔸 External automation requires compatible messages, execution rules and receiver testing. There are no orders, stops, targets or built-in execution payloads; no execution integration was tested. Outcome barriers are learning labels, not trade exits.
――――――――――――――――――――
🔷 SETTINGS AND PRACTICAL USE
🔸 Defaults: Automatic source on / Custom 1m; ribbon window 20; profile 48 bars / 24 rows; Inside chart placement / half-width 18 / offset 6.
🔸 Pressure defaults: imbalance 0.25; relative volume 1.2; drive response 0.35; resisted ceiling 0.10; spacing 3 bars.
🔸 ML defaults: learning on; K 9; library 240; warm-up 40; shrinkage 4; distance ceiling 0.16; barrier 0.75 prior ATR; deadline 12 bars; vote threshold 0.65; historical badges off.
🔸 Ribbon, profile, depth, shelves, dashboard and chart guide default on; diagnostics default off. Blue/orange colours are configurable. Shelves annotate eight recent resisted events, extending up to eight bars; they are not validated levels. The guide draws above candles; inside-chart profile shading is kept lighter to preserve candle visibility.
🔸 Publication cover mode defaults off. It replaces the large dashboard with a short viewport-anchored title and a compact colour/shape key, strengthens ribbon contrast and places the profile to the right of candles. Leave sufficient right margin. It does not alter pressure events, ML features, outcomes, training or alerts. Switch it off to restore the full chart guide.
🔸 Use standard candles and inspect diagnostics first. Inside chart keeps the profile visible; Right of candles needs right margin. Shelves/dashboard can be hidden.
🔸 Cover: BTCUSDT 15m / 1m source, profile 72 bars / 24 rows, width 22 / offset 3, cover title 64 pixels and enough right margin for the profile; shelves hidden. The heading and compact key are generated by Pine. These display settings illustrate the tool, not optimized trading parameters.
――――――――――――――――――――
🔷 REQUIREMENTS AND LIMITATIONS
🔸 Volume direction is inferred, not measured bid/ask, native footprint, resting liquidity or identified institutions. Some feeds supply tick volume.
🔸 Automatic selects 1m through 1h charts, 5m through 4h, 15m through 1D, 60m through 1W, and daily above 1W. The source must be strictly smaller than the chart timeframe; charts of 1m or faster require a supported finer custom source.
🔸 Missing/invalid source bars receive no fabricated volume. Bars above 3,000 intrabars are excluded. Profile caching uses at most 120 consecutive groups per chart bar, preserving side totals while reducing price detail. Index-based drawings are limited to roughly 4,900 bars back, within an explicitly reserved time buffer.
🔸 Marks/ML commit at confirmed closes; open candles retain the previous closed ribbon. Learning is chronological and viewport-independent. Intrabar history requests cap at 100,000, subject to account/feed availability; returned counts do not prove completeness. Reloads, more history, settings and feed corrections can alter reconstruction.
Built in Pine Script v6 under Mozilla Public License 2.0. This original implementation applies established price-based volume classification, weighted distributions and nearest-neighbour learning. It makes no claim of unique invention, guaranteed performance or Editor’s Choice selection.
――――――――――――――――――――
🔷 WHAT THE CHART SHOWS
🔸 Blue represents estimated buying, orange selling, and grey unresolved neutral volume. Lower-timeframe up/down candles classify volume as buying/selling. Dojis compare with the previous intrabar close, then inherit the last resolved direction; initially unresolved observations remain neutral.
🔸 Circles mark DRIVE: strong estimated pressure with aligned candle-body movement. Diamonds mark RESISTED: pressure with limited or opposing movement. Buying resisted can accompany falling price; selling resisted can accompany rising price. Neither confirms absorption or instructs an entry.
🔸 Default marks require ≥25% absolute estimated imbalance and ≥1.2× relative volume. DRIVE requires ≥0.35 prior ATR aligned response; RESISTED requires ≤0.10 ATR. Intermediate responses receive no mark. Shared spacing is three bars.
🔸 The response measures close minus open, normalized by the previous bar’s 14-period ATR. Opening gaps are excluded. Relative volume compares with the 30 immediately preceding chart bars, all requiring usable source data.
――――――――――――――――――――
🔷 PROFILE AND DISTRIBUTION RIBBON
🔸 The profile places selling left, buying right, and neutral volume in grey. A pale outline marks the highest-volume approximate bin. Peak-row depth faces are decorative, not confidence readings.
🔸 Contributions are allocated once to intrabar HLC3, or cached side-group weighted HLC3. This approximates volume at price. Both sides share a width scale; rounding and minimum one-bar widths enlarge tiny segments.
🔸 The ribbon shows a rolling volume-weighted HLC3 mean and three translucent layers extending to one weighted standard deviation. At least 80% of its window needs usable source data. Colour follows net classified volume, grey near balance. Its bounds are descriptive, not defended levels or projected targets; its mean is not session-anchored VWAP.
🔸 The default profile samples 48 chart bars ending at the rightmost visible closed candle. Panning rebuilds this sample and selects historical dashboard readings; it does not profile every visible candle.
――――――――――――――――――――
🔷 REAL OUTCOME LEARNING
🔸 AI here means an optional, distance-weighted k-nearest-neighbour ML classifier that learns from resolved DRIVE/RESISTED cases, collecting eligible examples during warm-up and abstention. No external classifier or pretrained AI model is imported. Its historical similarity vote is not a guarantee of future movement.
🔸 Seven features, normalized to 0–1: absolute imbalance, relative activity, aligned body response, pressure-side wick, aligned close location, signed distance from flow mean, and aligned rolling volume share. Buying/selling use comparable pressure-relative coordinates.
🔸 Features, origin close and prior ATR freeze at the confirmed event close. From the NEXT bar, ±0.75 frozen ATR barriers define continuation if the pressure-side barrier is first, opposition if the other is first. The twelfth later bar counts. Same-candle double touches, timeouts and invalid outcome prices are discarded.
🔸 Only already-resolved cases train the classifier. Exact K nearest cases use mean log(1 + absolute feature difference) across seven features. This Lorentzian-style similarity does not model spacetime or detect news.
🔸 Inverse-distance weights favour nearer cases. Effective neighbour weight count controls shrinkage toward base rate (continuations + 1) / (library size + 2). The library retains the latest 240 resolved cases.
🔸 Warm-up requires 40 resolved cases and both outcomes. All selected neighbours must pass the 0.16 mean log-distance ceiling; otherwise the engine reports LEARNING, NEED BOTH OUTCOMES or NO CLOSE ANALOGUE.
――――――――――――――――――――
🔷 READING THE ML VALUE
🔸 C means historical continuation vote in the original pressure direction; lower values favour opposition. Discarded cases do not vote: the reading is CONDITIONAL on a decisive outcome within the deadline, not a calibrated probability for every event or a trade win rate.
🔸 Vote and baseline freeze at the event close and are never backfilled. The dashboard identifies that event’s age and spells out its continuation vote. Between the two configured thresholds it says “no threshold met”. Optional diagnostics show library, base and decisive/discarded counts. C badges preserve pressure colour; circles/diamonds still describe observed response.
🔸 The chart guide explains all four markers. Blue circle: buying pressure moved price up. Orange circle: selling pressure moved price down. Blue diamond: buying met small or opposing response. Orange diamond: selling met small or opposing response. Colours describe estimated pressure, not automatic entry orders.
🔸 Short shaded rectangles highlight past resisted candles. Profile rectangles represent estimated volume at price. “SELL VOL” / “BUY VOL” identify the volume sides; neither the shelves nor profile bars are entry signals. The guide can be hidden independently of the dashboard.
🔸 Research diagnostics compare saved votes with later outcomes using Brier error and the frozen base. Overlapping cases are dependent. A fixed 30-day BTCUSDT/ETHUSDT 15m reconstruction did not outperform the baseline on either symbol; no trading edge is established.
――――――――――――――――――――
🔷 ALERTS AND AUTOMATION
🔸 Six informational conditions: Buying pressure drives price; Selling pressure drives price; Buying pressure resisted; Selling pressure resisted; ML continuation vote above threshold; ML opposition vote above threshold.
🔸 Create the required TradingView alert using Once Per Bar Close. Default ML thresholds are C ≥65% for continuation and C ≤35% for opposition. Messages identify the ticker and interval.
🔸 External automation requires compatible messages, execution rules and receiver testing. There are no orders, stops, targets or built-in execution payloads; no execution integration was tested. Outcome barriers are learning labels, not trade exits.
――――――――――――――――――――
🔷 SETTINGS AND PRACTICAL USE
🔸 Defaults: Automatic source on / Custom 1m; ribbon window 20; profile 48 bars / 24 rows; Inside chart placement / half-width 18 / offset 6.
🔸 Pressure defaults: imbalance 0.25; relative volume 1.2; drive response 0.35; resisted ceiling 0.10; spacing 3 bars.
🔸 ML defaults: learning on; K 9; library 240; warm-up 40; shrinkage 4; distance ceiling 0.16; barrier 0.75 prior ATR; deadline 12 bars; vote threshold 0.65; historical badges off.
🔸 Ribbon, profile, depth, shelves, dashboard and chart guide default on; diagnostics default off. Blue/orange colours are configurable. Shelves annotate eight recent resisted events, extending up to eight bars; they are not validated levels. The guide draws above candles; inside-chart profile shading is kept lighter to preserve candle visibility.
🔸 Publication cover mode defaults off. It replaces the large dashboard with a short viewport-anchored title and a compact colour/shape key, strengthens ribbon contrast and places the profile to the right of candles. Leave sufficient right margin. It does not alter pressure events, ML features, outcomes, training or alerts. Switch it off to restore the full chart guide.
🔸 Use standard candles and inspect diagnostics first. Inside chart keeps the profile visible; Right of candles needs right margin. Shelves/dashboard can be hidden.
🔸 Cover: BTCUSDT 15m / 1m source, profile 72 bars / 24 rows, width 22 / offset 3, cover title 64 pixels and enough right margin for the profile; shelves hidden. The heading and compact key are generated by Pine. These display settings illustrate the tool, not optimized trading parameters.
――――――――――――――――――――
🔷 REQUIREMENTS AND LIMITATIONS
🔸 Volume direction is inferred, not measured bid/ask, native footprint, resting liquidity or identified institutions. Some feeds supply tick volume.
🔸 Automatic selects 1m through 1h charts, 5m through 4h, 15m through 1D, 60m through 1W, and daily above 1W. The source must be strictly smaller than the chart timeframe; charts of 1m or faster require a supported finer custom source.
🔸 Missing/invalid source bars receive no fabricated volume. Bars above 3,000 intrabars are excluded. Profile caching uses at most 120 consecutive groups per chart bar, preserving side totals while reducing price detail. Index-based drawings are limited to roughly 4,900 bars back, within an explicitly reserved time buffer.
🔸 Marks/ML commit at confirmed closes; open candles retain the previous closed ribbon. Learning is chronological and viewport-independent. Intrabar history requests cap at 100,000, subject to account/feed availability; returned counts do not prove completeness. Reloads, more history, settings and feed corrections can alter reconstruction.
Built in Pine Script v6 under Mozilla Public License 2.0. This original implementation applies established price-based volume classification, weighted distributions and nearest-neighbour learning. It makes no claim of unique invention, guaranteed performance or Editor’s Choice selection.
Информация о релизе
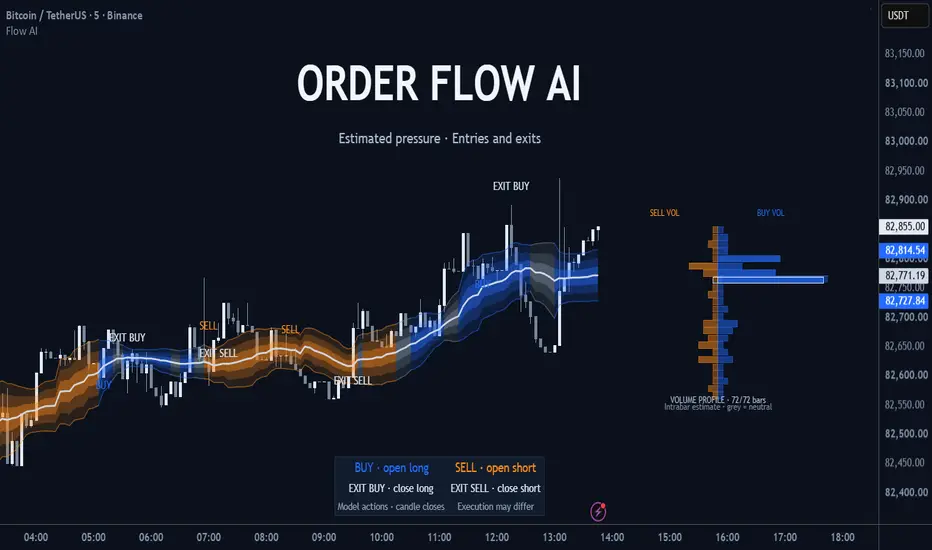
Version 2 — Explicit entries, explicit exitsV1 marked buying and selling pressure observations. Treating every observation as a new order could repeatedly replace the same direction and leave an exit waiting for opposite pressure. V2 separates the pressure analysis from a one-position hypothetical plan, with minimal BUY, SELL, EXIT BUY and EXIT SELL text.
🔷 WHAT CHANGED
🔸 BUY opens a long model plan; SELL opens a short model plan. Entry requires a confirmed DRIVE, stronger imbalance/activity, aligned rolling pressure, mean slope and price position, plus a limit on distance from the mean. A pressure observation alone is no longer a managed entry.
🔸 One plan at a time. Same-direction observations do not add size, replace the entry or reset risk. A qualified opposite event may close the plan, but cannot reverse it on that candle.
🔸 After an exit, a cooldown applies; a used side also needs fresh flat reset evidence before re-entry. Raw pressure circles and diamonds are hidden by default and remain available for analysis.
🔷 READING THE CHART
🔸 Blue BUY / orange SELL — entry intents for the named model direction. EXIT BUY closes the long plan; EXIT SELL closes the short plan. Text has no surrounding boxes. Exit reasons appear on hover and in the dashboard; an optional second line displays them beside the exit.
🔸 The white line and coloured ribbon describe a rolling, volume-weighted mean and distribution. The side profile shows estimated selling volume on the left and buying volume on the right, with neutral volume in grey. These are inferred from intrabar price/volume, not measured bid/ask aggressor flow or an order book.
🔸 Active entry, stop and target lines are reference levels. The dashboard reports the model state, last exit reason, pressure and historical ML read. The annotated snapshot explains these visual features.
Chart guide: mean/ribbon, estimated-volume profile, BUY/SELL entries and their separate exits. Annotations explain the features; they do not add trading conditions.
🔷 INDEPENDENT EXIT RULES
🔸 Entry intent is recorded at confirmed close; the hypothetical entry reference uses the next candle's open. Fixed stop/target references can end the plan independently of another entry signal.
🔸 Break-even and trailing references tighten protection. Newly tightened protection starts on the next candle; current-bar highs cannot retrospectively raise a stop against an earlier low. Qualified opposite pressure, adverse flow and a holding deadline provide additional exits.
🔸 Defaults: entry imbalance 35%, relative activity 1.5×; cooldown 8 bars; re-arm 3 quiet usable flat bars; initial risk 1.5 prior ATR; target 2R; break-even activation 0.75R; trail activation 1R with 0.75R distance; holding deadline 48 bars. R is frozen initial risk, rounded to ticks.
Historical model view: active entry/SL/TP references and the compact dashboard. The ML entry gate is OFF; the vote belongs to the labelled pressure case, not the open position. Profile is hidden in this image so risk references remain visible.
🔷 ML AND AUTOMATION
🔸 The distance-weighted nearest-neighbour classifier continues learning seven normalized features from resolved pressure events. Managed entries do not change that training population. The optional current-event ML entry gate defaults OFF because validation has not established a predictive advantage. Historical votes are not calibrated chances of profit.
🔸 Automation compatible through four separate candle-close alertconditions: BUY, SELL, EXIT BUY and EXIT SELL. Both EXIT conditions are close-only intents, never opposite entries. Recreate v1 alerts using the new conditions and Once Per Bar Close; existing alerts retain their saved script/settings.
🔸 Configure the receiver's documented entry/close messages and protective orders. Default messages are plain text. The script does not execute orders or observe actual fills/positions; execution integration has not been tested.
🔷 LIMITATIONS
🔸 All alerts arrive at candle close. An earlier stop/target touch is a model reference, not an executable alert fill; chart levels are not working protective orders. Use execution-side protection for intrabar risk.
🔸 All 29 synthetic lifecycle checks passed. In a fixed 30-day BTC/ETH cash-market sample, default BTC 5m entries fell from 743 raw DRIVE observations to 50 managed entries. Three of four managed samples remained negative after illustrative costs. This is not evidence of profitability or a futures execution test.
🔸 Loaded-history changes rebuild the plan and library. The model cannot synchronize manual trades, independent protective exits or receiver failures.

Automate TradingView alerts to brokers no coding needed. Trade futures, forex, or crypto, copy trades across unlimited accounts, & control risk with ease.
For Tradovate: bit.ly/4a1KBrY
For all other supported brokers: bit.ly/4qEbU2G
For Tradovate: bit.ly/4a1KBrY
For all other supported brokers: bit.ly/4qEbU2G
Отказ от ответственности
Информация и публикации не предназначены для предоставления и не являются финансовыми, инвестиционными, торговыми или другими видами советов или рекомендаций, предоставленных или одобренных TradingView. Подробнее читайте в Условиях использования.
Automate TradingView alerts to brokers no coding needed. Trade futures, forex, or crypto, copy trades across unlimited accounts, & control risk with ease.
For Tradovate: bit.ly/4a1KBrY
For all other supported brokers: bit.ly/4qEbU2G
For Tradovate: bit.ly/4a1KBrY
For all other supported brokers: bit.ly/4qEbU2G
Отказ от ответственности
Информация и публикации не предназначены для предоставления и не являются финансовыми, инвестиционными, торговыми или другими видами советов или рекомендаций, предоставленных или одобренных TradingView. Подробнее читайте в Условиях использования.