Taught to Trade - Sample Size Panel
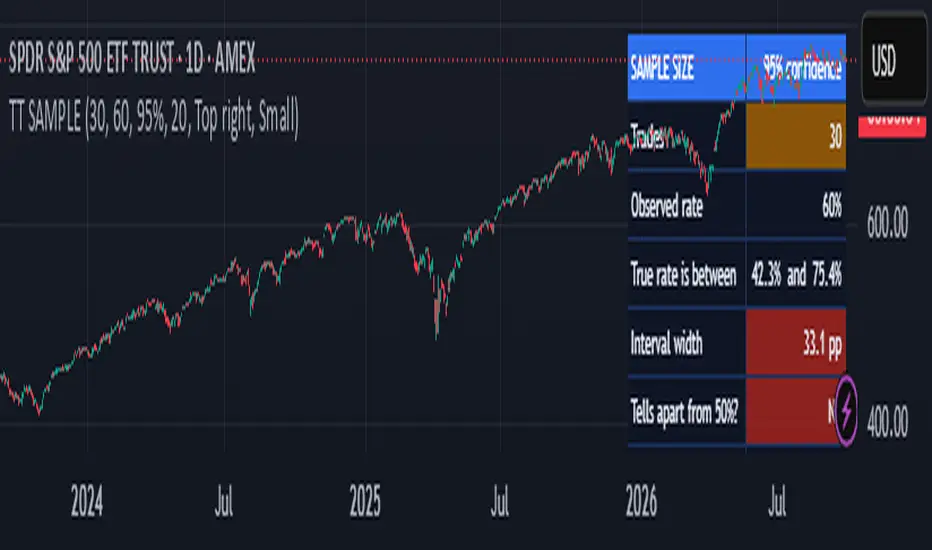
You have 30 trades and 60 percent of them worked. Is that a real edge, or a coin flip that had a good month?
This panel answers that with arithmetic, not opinion. Enter the number of trades you have and the rate you observed. It returns the range the true rate plausibly sits in, how wide that range is, whether it can be told apart from 50 percent at all, and how many trades it would take to narrow it.
The usual answer is: far more trades than you have. That is the point.
WHAT IT SHOWS
- True rate is between: the Wilson score interval around your observed rate, at 90, 95 or 99 percent confidence. Wilson is used instead of the textbook normal interval because it behaves sensibly at small samples and at rates near 0 or 100 percent.
- Interval width: the gap between the two ends, in percentage points. Green under 10, amber 10 to 20, red above 20.
- Tells apart from 50%?: Yes only when the whole interval sits above or below 50 percent.
- Trades for +/-10pp, +/-5pp, +/-2pp: roughly how many trades it takes for the interval to shrink to that half-width at your observed rate.
- This chart could give: how many non-overlapping trades this chart's history could have produced at your holding period. If it is fewer than the trades you need, no amount of backtesting on this chart can settle the question.
A WORKED EXAMPLE (the defaults)
30 trades at 60 percent, 95 percent confidence: the true rate is plausibly anywhere from about 42 to 75 percent. That range includes 50. Narrowing it to plus or minus 5 points takes about 369 trades.
HOW TO USE IT
Take the trade count and the rate from your own trade list or a strategy report, type them in, and read the table before you read anything else about the result. It draws nothing on the chart and has no alerts: it is a calculator, and there is no market state to alert on.
WHERE IT FAILS
- It assumes every trade is an independent draw with the same underlying rate. Real trades cluster: regimes change, and trades taken close together share the same conditions. Both make the true uncertainty wider than this panel shows.
- It is about a rate only. A 60 percent rate says nothing about the size of wins and losses, costs, or drawdown; a strategy can be right most of the time and still lose money.
- The trades-needed rows use the normal approximation, which is rough at very small samples and at rates near 0 or 100 percent.
- If you tried many parameter sets and kept the best one, the rate you enter is already inflated by selection. No interval corrects for that.
- "This chart could give" is a rough count: history length divided by holding period, ignoring gaps and the time between trades.
This is an educational tool. It does not generate signals, and nothing it shows is a recommendation to buy or sell anything. Past results, including your own, do not guarantee future ones.
This panel answers that with arithmetic, not opinion. Enter the number of trades you have and the rate you observed. It returns the range the true rate plausibly sits in, how wide that range is, whether it can be told apart from 50 percent at all, and how many trades it would take to narrow it.
The usual answer is: far more trades than you have. That is the point.
WHAT IT SHOWS
- True rate is between: the Wilson score interval around your observed rate, at 90, 95 or 99 percent confidence. Wilson is used instead of the textbook normal interval because it behaves sensibly at small samples and at rates near 0 or 100 percent.
- Interval width: the gap between the two ends, in percentage points. Green under 10, amber 10 to 20, red above 20.
- Tells apart from 50%?: Yes only when the whole interval sits above or below 50 percent.
- Trades for +/-10pp, +/-5pp, +/-2pp: roughly how many trades it takes for the interval to shrink to that half-width at your observed rate.
- This chart could give: how many non-overlapping trades this chart's history could have produced at your holding period. If it is fewer than the trades you need, no amount of backtesting on this chart can settle the question.
A WORKED EXAMPLE (the defaults)
30 trades at 60 percent, 95 percent confidence: the true rate is plausibly anywhere from about 42 to 75 percent. That range includes 50. Narrowing it to plus or minus 5 points takes about 369 trades.
HOW TO USE IT
Take the trade count and the rate from your own trade list or a strategy report, type them in, and read the table before you read anything else about the result. It draws nothing on the chart and has no alerts: it is a calculator, and there is no market state to alert on.
WHERE IT FAILS
- It assumes every trade is an independent draw with the same underlying rate. Real trades cluster: regimes change, and trades taken close together share the same conditions. Both make the true uncertainty wider than this panel shows.
- It is about a rate only. A 60 percent rate says nothing about the size of wins and losses, costs, or drawdown; a strategy can be right most of the time and still lose money.
- The trades-needed rows use the normal approximation, which is rough at very small samples and at rates near 0 or 100 percent.
- If you tried many parameter sets and kept the best one, the rate you enter is already inflated by selection. No interval corrects for that.
- "This chart could give" is a rough count: history length divided by holding period, ignoring gaps and the time between trades.
This is an educational tool. It does not generate signals, and nothing it shows is a recommendation to buy or sell anything. Past results, including your own, do not guarantee future ones.

Free Pine Script teardowns, a repaint checker and honest tools: taughttotrade.com (educational only, not financial advice)
Отказ от ответственности
Информация и публикации не предназначены для предоставления и не являются финансовыми, инвестиционными, торговыми или другими видами советов или рекомендаций, предоставленных или одобренных TradingView. Подробнее читайте в Условиях использования.
Free Pine Script teardowns, a repaint checker and honest tools: taughttotrade.com (educational only, not financial advice)
Отказ от ответственности
Информация и публикации не предназначены для предоставления и не являются финансовыми, инвестиционными, торговыми или другими видами советов или рекомендаций, предоставленных или одобренных TradingView. Подробнее читайте в Условиях использования.