ICT Fair Value Gap [vole]
OVERVIEW
ICT Fair Value Gap finds three-candle gaps, the stretch between the first candle's extreme and the third candle's opposite extreme that the middle candle left untraded. It draws each gap as a box, tracks how far price has filled it and marks the gaps that arrived together with a strong displacement candle as imbalances.
HOW IT WORKS
For every bar, the indicator compares the current candle with the candle two bars back. A bullish gap exists when the current low is above the high of that earlier candle. A bearish gap exists when the current high is below the low of that earlier candle. A gap smaller than a chosen share of the average true range can be ignored. A displacement is a candle whose body is at least a chosen multiple of the average true range. A gap that comes with a displacement on its middle or third candle is called an imbalance and is labelled IMB instead of FVG. Each gap is drawn as a box extended to the right, with a dotted line at its midpoint, the consequent encroachment. As later bars trade into the gap, the share of it that has been filled is tracked, either on the wick or on the close. When the fill reaches the chosen target the gap counts as filled and is faded or removed. Gaps are tracked for a chosen number of bars.

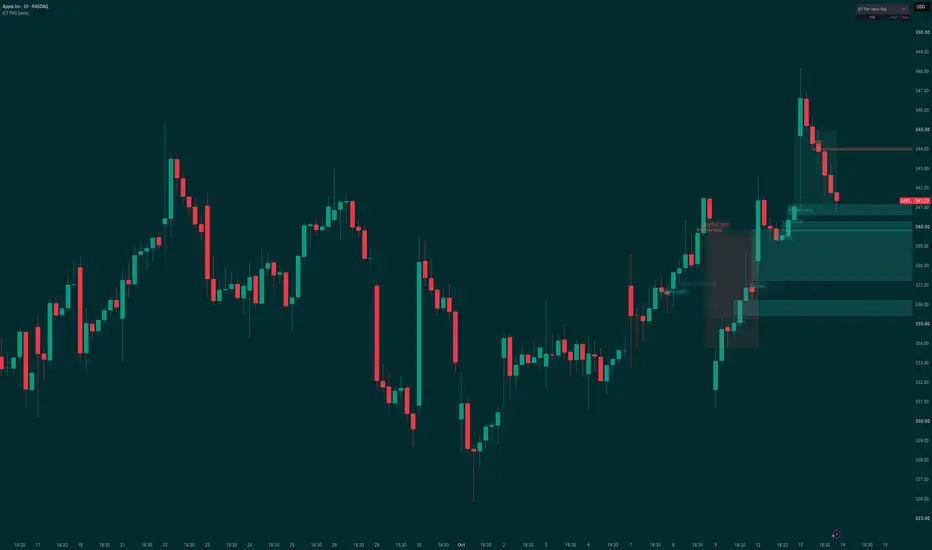
Gap boxes with their midpoint lines and the fill percentage on each label, on a falling chart that turns up.
WHAT YOU'LL SEE ON THE CHART

An hourly stock chart: gaps that price has already traded back into are faded, and open gaps stay extended to the right.
BEST FOR
This indicator draws and labels price structure rather than reporting a single event type, so no market or timeframe group is singled out. It was not measured, and it reads the candles of whatever chart it is placed on.
ALERTS
LIMITATIONS
The script reads the candles of the chart it is placed on, so results on non-standard chart types differ from results on regular candles. Swing points are known only after the chosen number of bars has passed, so swing-based items appear with that delay. It is a drawing and labelling tool, not a forecast. It is weaker in these situations:
OPEN SOURCE
The source code is open. This script is one module of the author's own larger ICT toolkit, published here on its own so it can be read, checked and reused under the Mozilla Public License 2.0.
ACCESS
Free, open-source script.
DISCLAIMER
This indicator is a technical analysis tool, not investment advice. The author is not a registered investment adviser, broker or dealer. Nothing here is a recommendation to buy, sell or hold any instrument. What you see on the chart is the output of a calculation you configured. Any decision you take from it is yours. Past behaviour of an indicator — including anything you observe in historical bars or in a backtest, which is a simulation — does not indicate future results. Trading carries a real risk of loss, including your entire capital. Charting uses TradingView® technology. TradingView is unaffiliated with the author. For educational purposes only. Not investment advice.
ICT Fair Value Gap finds three-candle gaps, the stretch between the first candle's extreme and the third candle's opposite extreme that the middle candle left untraded. It draws each gap as a box, tracks how far price has filled it and marks the gaps that arrived together with a strong displacement candle as imbalances.
HOW IT WORKS
For every bar, the indicator compares the current candle with the candle two bars back. A bullish gap exists when the current low is above the high of that earlier candle. A bearish gap exists when the current high is below the low of that earlier candle. A gap smaller than a chosen share of the average true range can be ignored. A displacement is a candle whose body is at least a chosen multiple of the average true range. A gap that comes with a displacement on its middle or third candle is called an imbalance and is labelled IMB instead of FVG. Each gap is drawn as a box extended to the right, with a dotted line at its midpoint, the consequent encroachment. As later bars trade into the gap, the share of it that has been filled is tracked, either on the wick or on the close. When the fill reaches the chosen target the gap counts as filled and is faded or removed. Gaps are tracked for a chosen number of bars.
Gap boxes with their midpoint lines and the fill percentage on each label, on a falling chart that turns up.
WHAT YOU'LL SEE ON THE CHART
- Gap boxes — a shaded box for each active gap, in the bullish or bearish colour, extended to the right.
- Gap labels — FVG, or IMB for a gap that arrived with a displacement candle, with the current fill percentage.
- CE line — a dotted line at the midpoint of each gap.
- Filled gaps — faded or removed once the fill target is reached.
- Dashboard — a small table summarising the active gaps.
An hourly stock chart: gaps that price has already traded back into are faded, and open gaps stay extended to the right.
BEST FOR
This indicator draws and labels price structure rather than reporting a single event type, so no market or timeframe group is singled out. It was not measured, and it reads the candles of whatever chart it is placed on.
ALERTS
- Bullish FVG Formed
- Bearish FVG Formed
- Bullish Imbalance
- Bearish Imbalance
- FVG Filled
- FVG CE Touched
LIMITATIONS
The script reads the candles of the chart it is placed on, so results on non-standard chart types differ from results on regular candles. Swing points are known only after the chosen number of bars has passed, so swing-based items appear with that delay. It is a drawing and labelling tool, not a forecast. It is weaker in these situations:
- Quiet, overlapping candles, where few gaps form
- Low size filters, which fill the chart with small gaps
- Illiquid instruments, where gaps are common but carry little meaning
- Intrabar use, since a gap can disappear before the bar closes
OPEN SOURCE
The source code is open. This script is one module of the author's own larger ICT toolkit, published here on its own so it can be read, checked and reused under the Mozilla Public License 2.0.
ACCESS
Free, open-source script.
DISCLAIMER
This indicator is a technical analysis tool, not investment advice. The author is not a registered investment adviser, broker or dealer. Nothing here is a recommendation to buy, sell or hold any instrument. What you see on the chart is the output of a calculation you configured. Any decision you take from it is yours. Past behaviour of an indicator — including anything you observe in historical bars or in a backtest, which is a simulation — does not indicate future results. Trading carries a real risk of loss, including your entire capital. Charting uses TradingView® technology. TradingView is unaffiliated with the author. For educational purposes only. Not investment advice.

volebot — technical-analysis indicators with plain-language docs. Access requests and contact: vole.bot
Отказ от ответственности
Информация и публикации не предназначены для предоставления и не являются финансовыми, инвестиционными, торговыми или другими видами советов или рекомендаций, предоставленных или одобренных TradingView. Подробнее читайте в Условиях использования.
Отказ от ответственности
Информация и публикации не предназначены для предоставления и не являются финансовыми, инвестиционными, торговыми или другими видами советов или рекомендаций, предоставленных или одобренных TradingView. Подробнее читайте в Условиях использования.