Adaptive Anchored VWAP - Event Anchors and Empirical Bands
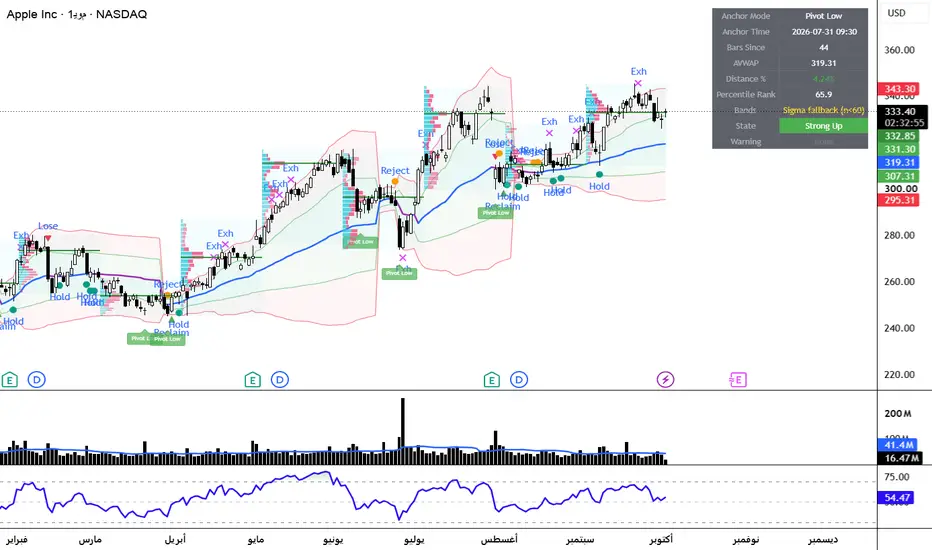
Adaptive Anchored VWAP - Event Anchors and Empirical Bands
OVERVIEW
Adaptive Anchored VWAP (AVWAP X) is an anchored volume-weighted average price that decides WHERE to anchor and HOW WIDE its bands should be from the data itself, instead of relying on fixed calendar periods and normal-distribution assumptions. It combines three components that work together toward one task: measuring how far price has travelled from the average price paid by participants since a meaningful market event, and classifying the current state of that relationship.
WHAT MAKES IT DIFFERENT
1. Structural and event-driven anchors. Besides the standard calendar anchors, the AVWAP can anchor automatically on confirmed swing pivots, on the highest-volume bar of the last N bars, on statistically unusual volume (z-score of log volume), or on price gaps.
2. Empirical percentile bands. Standard VWAP bands assume price deviations are normally distributed. In practice they often are not (fat tails, skew, low-liquidity jumps). This script records every percentage deviation of price from the AVWAP since the anchor, keeps them in a sorted array, and draws the bands at the actual percentiles of that distribution.
3. Regime engine. Price is classified into six states relative to the AVWAP and its bands, and six discrete events (Reclaim, Lose, Hold, Reject, Exhaustion Up/Down) are detected with optional volume confirmation and alerts.
HOW IT WORKS
Anchors
- Calendar: Session, Week, Month, Quarter, Year (reset on each new period).
- Corporate events: Earnings, Dividends, Splits (when data is available for the symbol).
- Custom Date: accumulation starts at the first bar on or after the chosen date/time.
- Pivot Low / Pivot High / Latest Pivot: uses ta.pivotlow / ta.pivothigh. A pivot is accepted only after "Pivot Right Bars" confirm it. At that moment the AVWAP sums are back-calculated from the pivot bar, so the value is mathematically anchored at the pivot.
- Volume High (N): anchors on a bar whose volume is the highest of the last N bars.
- Volume Spike (Z): anchors when the z-score of log(volume) versus the previous N bars exceeds the threshold. Log scale is used because raw volume is strongly right-skewed.
- Gap: anchors when the open gaps beyond the previous bar's range by at least the minimum percentage.
AVWAP engine
The AVWAP is computed with its own running sums of price*volume, volume and price^2*volume. This allows anchoring on a past bar (pivots), which the built-in ta.vwap() cannot do.
Bands
- Empirical Percentile (default): bands are placed at the chosen percentiles of past deviations since the anchor. The default 84.1 / 97.7 percentiles correspond to +/-1 and +/-2 standard deviations under a normal distribution, so you can compare both modes directly: when they differ a lot, the deviation distribution is not normal. The current bar is excluded from the percentile calculation. Until "Min Samples" deviations exist, standard deviation bands are used as a fallback and the dashboard shows this in yellow.
- Standard Deviation and Percentage modes are also available.
States: Extended Up (above outer band), Strong Up (above inner band), Above AVWAP, Below AVWAP, Strong Down, Extended Down.
Events
- Reclaim: close crosses above the AVWAP (optionally with volume above its average times a multiplier).
- Lose: close crosses below the AVWAP (same volume option).
- Hold: previous close above the AVWAP, current low touches it, close stays above.
- Reject: previous close below the AVWAP, current high touches it, close stays below.
- Exhaustion Up / Down: close returns inside the outer band after closing outside it.
Signals are suppressed on the anchor bar and for "Min Bars After Anchor".
Dashboard: anchor mode and time, bars since anchor, AVWAP value, distance %, the percentile rank of the current deviation within its own history, band mode in use, current state, and a data warning.
HOW TO USE
- Use Pivot Low in uptrends and Pivot High in downtrends to track the average cost of participants since the last structural turn.
- Use Volume Spike or Volume High to follow the average price since a probable large-participant event.
- The Percentile Rank tells you how unusual the current distance from the AVWAP is for this specific anchor (for example, 97 means the current deviation is larger than about 97% of deviations observed since the anchor).
- Treat Hold / Reject / Reclaim / Lose as context events, not standalone trade signals. They are most informative when aligned with the broader trend.
ALERTS
Six alertcondition() entries are available (one per event), plus one alert() call that sends a dynamic message with ticker, event, close, AVWAP and state. Use "Once per bar close".
LIMITATIONS
- Pivot modes: the new AVWAP line appears on the chart only from the confirmation bar onward (pivot bar + Pivot Right Bars). The values between the pivot and confirmation are included in the calculation but are not redrawn in the past. This is deliberate to avoid repainting.
- Custom Date: if the chosen date is earlier than the first loaded bar, accumulation starts at the first available bar. The dashboard shows a red warning in that case.
- Empirical bands need enough samples. With few samples, extreme percentiles are determined by very few observations; raise "Min Samples" on illiquid symbols.
- The script requires volume data. Intraday volume quality varies by exchange and data vendor.
- Earnings / Dividends / Splits anchors depend on the availability of that data for the symbol.
- Do not use this script on non-standard chart types (Heikin Ashi, Renko, etc.): the signals would be based on synthetic prices.
- No signal of this script predicts future prices. Past behavior does not guarantee future results.
CREDITS
The calendar, earnings, dividends and splits anchor logic is adapted from TradingView's built-in VWAP indicator. All other components (event anchors, back-filled pivot anchoring, sorted-array empirical percentile bands with percentile rank, regime engine and dashboard) are original to this script.
ملخص بالعربية
مؤشر VWAP مرتكز يحدد نقطة الارتكاز تلقائياً من البيانات: قمم وقيعان مؤكدة، أو أحداث فوليوم غير اعتيادية، أو فجوات سعرية، إلى جانب الارتكاز الزمني والتاريخ المخصص. النطاقات تُبنى من التوزيع الفعلي لانحرافات السعر عن الـ AVWAP منذ نقطة الارتكاز (Percentiles)، وليس من افتراض التوزيع الطبيعي. يصنّف المؤشر حالة السعر في ست حالات، ويرصد ست أحداث مع تنبيهات. الإشارات سياقية وليست توصيات تداول.
OVERVIEW
Adaptive Anchored VWAP (AVWAP X) is an anchored volume-weighted average price that decides WHERE to anchor and HOW WIDE its bands should be from the data itself, instead of relying on fixed calendar periods and normal-distribution assumptions. It combines three components that work together toward one task: measuring how far price has travelled from the average price paid by participants since a meaningful market event, and classifying the current state of that relationship.
WHAT MAKES IT DIFFERENT
1. Structural and event-driven anchors. Besides the standard calendar anchors, the AVWAP can anchor automatically on confirmed swing pivots, on the highest-volume bar of the last N bars, on statistically unusual volume (z-score of log volume), or on price gaps.
2. Empirical percentile bands. Standard VWAP bands assume price deviations are normally distributed. In practice they often are not (fat tails, skew, low-liquidity jumps). This script records every percentage deviation of price from the AVWAP since the anchor, keeps them in a sorted array, and draws the bands at the actual percentiles of that distribution.
3. Regime engine. Price is classified into six states relative to the AVWAP and its bands, and six discrete events (Reclaim, Lose, Hold, Reject, Exhaustion Up/Down) are detected with optional volume confirmation and alerts.
HOW IT WORKS
Anchors
- Calendar: Session, Week, Month, Quarter, Year (reset on each new period).
- Corporate events: Earnings, Dividends, Splits (when data is available for the symbol).
- Custom Date: accumulation starts at the first bar on or after the chosen date/time.
- Pivot Low / Pivot High / Latest Pivot: uses ta.pivotlow / ta.pivothigh. A pivot is accepted only after "Pivot Right Bars" confirm it. At that moment the AVWAP sums are back-calculated from the pivot bar, so the value is mathematically anchored at the pivot.
- Volume High (N): anchors on a bar whose volume is the highest of the last N bars.
- Volume Spike (Z): anchors when the z-score of log(volume) versus the previous N bars exceeds the threshold. Log scale is used because raw volume is strongly right-skewed.
- Gap: anchors when the open gaps beyond the previous bar's range by at least the minimum percentage.
AVWAP engine
The AVWAP is computed with its own running sums of price*volume, volume and price^2*volume. This allows anchoring on a past bar (pivots), which the built-in ta.vwap() cannot do.
Bands
- Empirical Percentile (default): bands are placed at the chosen percentiles of past deviations since the anchor. The default 84.1 / 97.7 percentiles correspond to +/-1 and +/-2 standard deviations under a normal distribution, so you can compare both modes directly: when they differ a lot, the deviation distribution is not normal. The current bar is excluded from the percentile calculation. Until "Min Samples" deviations exist, standard deviation bands are used as a fallback and the dashboard shows this in yellow.
- Standard Deviation and Percentage modes are also available.
States: Extended Up (above outer band), Strong Up (above inner band), Above AVWAP, Below AVWAP, Strong Down, Extended Down.
Events
- Reclaim: close crosses above the AVWAP (optionally with volume above its average times a multiplier).
- Lose: close crosses below the AVWAP (same volume option).
- Hold: previous close above the AVWAP, current low touches it, close stays above.
- Reject: previous close below the AVWAP, current high touches it, close stays below.
- Exhaustion Up / Down: close returns inside the outer band after closing outside it.
Signals are suppressed on the anchor bar and for "Min Bars After Anchor".
Dashboard: anchor mode and time, bars since anchor, AVWAP value, distance %, the percentile rank of the current deviation within its own history, band mode in use, current state, and a data warning.
HOW TO USE
- Use Pivot Low in uptrends and Pivot High in downtrends to track the average cost of participants since the last structural turn.
- Use Volume Spike or Volume High to follow the average price since a probable large-participant event.
- The Percentile Rank tells you how unusual the current distance from the AVWAP is for this specific anchor (for example, 97 means the current deviation is larger than about 97% of deviations observed since the anchor).
- Treat Hold / Reject / Reclaim / Lose as context events, not standalone trade signals. They are most informative when aligned with the broader trend.
ALERTS
Six alertcondition() entries are available (one per event), plus one alert() call that sends a dynamic message with ticker, event, close, AVWAP and state. Use "Once per bar close".
LIMITATIONS
- Pivot modes: the new AVWAP line appears on the chart only from the confirmation bar onward (pivot bar + Pivot Right Bars). The values between the pivot and confirmation are included in the calculation but are not redrawn in the past. This is deliberate to avoid repainting.
- Custom Date: if the chosen date is earlier than the first loaded bar, accumulation starts at the first available bar. The dashboard shows a red warning in that case.
- Empirical bands need enough samples. With few samples, extreme percentiles are determined by very few observations; raise "Min Samples" on illiquid symbols.
- The script requires volume data. Intraday volume quality varies by exchange and data vendor.
- Earnings / Dividends / Splits anchors depend on the availability of that data for the symbol.
- Do not use this script on non-standard chart types (Heikin Ashi, Renko, etc.): the signals would be based on synthetic prices.
- No signal of this script predicts future prices. Past behavior does not guarantee future results.
CREDITS
The calendar, earnings, dividends and splits anchor logic is adapted from TradingView's built-in VWAP indicator. All other components (event anchors, back-filled pivot anchoring, sorted-array empirical percentile bands with percentile rank, regime engine and dashboard) are original to this script.
ملخص بالعربية
مؤشر VWAP مرتكز يحدد نقطة الارتكاز تلقائياً من البيانات: قمم وقيعان مؤكدة، أو أحداث فوليوم غير اعتيادية، أو فجوات سعرية، إلى جانب الارتكاز الزمني والتاريخ المخصص. النطاقات تُبنى من التوزيع الفعلي لانحرافات السعر عن الـ AVWAP منذ نقطة الارتكاز (Percentiles)، وليس من افتراض التوزيع الطبيعي. يصنّف المؤشر حالة السعر في ست حالات، ويرصد ست أحداث مع تنبيهات. الإشارات سياقية وليست توصيات تداول.

Ahmed Amin
00201227212691
يمكنك متابعة الجلسة من فرص لحظية وتعليقات من خلال قناة التليجرام التالية
t.me/egxtiks
او قناة الواتس اب التالى
whatsapp.com/channel/0029Vb7y9PgD8SDyATRX4D2i
x.com/AhmedAminTC
00201227212691
يمكنك متابعة الجلسة من فرص لحظية وتعليقات من خلال قناة التليجرام التالية
t.me/egxtiks
او قناة الواتس اب التالى
whatsapp.com/channel/0029Vb7y9PgD8SDyATRX4D2i
x.com/AhmedAminTC
Отказ от ответственности
Информация и публикации не предназначены для предоставления и не являются финансовыми, инвестиционными, торговыми или другими видами советов или рекомендаций, предоставленных или одобренных TradingView. Подробнее читайте в Условиях использования.
Ahmed Amin
00201227212691
يمكنك متابعة الجلسة من فرص لحظية وتعليقات من خلال قناة التليجرام التالية
t.me/egxtiks
او قناة الواتس اب التالى
whatsapp.com/channel/0029Vb7y9PgD8SDyATRX4D2i
x.com/AhmedAminTC
00201227212691
يمكنك متابعة الجلسة من فرص لحظية وتعليقات من خلال قناة التليجرام التالية
t.me/egxtiks
او قناة الواتس اب التالى
whatsapp.com/channel/0029Vb7y9PgD8SDyATRX4D2i
x.com/AhmedAminTC
Отказ от ответственности
Информация и публикации не предназначены для предоставления и не являются финансовыми, инвестиционными, торговыми или другими видами советов или рекомендаций, предоставленных или одобренных TradingView. Подробнее читайте в Условиях использования.