Обновлено
[blackcat] L3 Market Pulse Insight
OVERVIEW
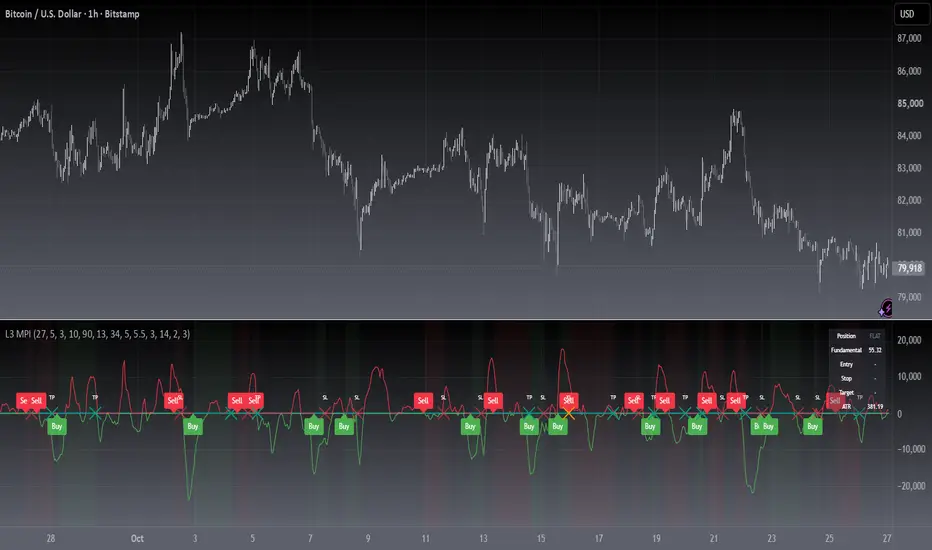
The [blackcat] L3 Market Pulse Insight provides comprehensive analytics by evaluating key price metrics to reveal critical market sentiment and potential trade opportunities 📊🔍. This advanced indicator leverages proprietary calculations involving Simple Moving Averages (SMAs), Exponential Moving Averages (EMAs), and custom thresholds to deliver detailed insights into current market dynamics 🚀✨.
By plotting various lines representing core fundamentals and directional cues, traders gain visibility into underlying trends and shifts within the market pulse. The visual aids simplify complex data interpretation, making it easier for users to make strategic decisions based on clear, actionable information ✅⛈️.
FEATURES
Advanced Calculation Techniques:
Employs sophisticated formulas integrating SMAs and EMAs for precise trend analysis.
Incorporates fundamental lines and confirmations based on recent price extremes.
Comprehensive Visualization:
Plots multiple informational lines: Fundamental Line, Thresholds, Institutional Directions, etc., each reflecting unique aspects of price behavior.
Uses distinct colors for easy differentiation between bearish and bullish indications.
Customizable Alerts:
Generates "Buy" and "Sell" labels at pivotal moments, highlighting entry/exit points visually.
Offers flexibility to modify alert styles and positions according to user preferences.
Dynamic Adaptability:
Continuously updates plots and alerts based on incoming real-time data for timely responses.
Provides dynamic support/resistance levels adapting to evolving market conditions.
HOW TO USE
Installing the Indicator:
To start using the [blackcat] L3 Market Pulse Insight, add it via the Pine Editor on TradingView:
Open the editor from the bottom panel.
Copy-paste the provided script code.
Click “Add to Chart” after pasting.
Understanding Key Lines:
Familiarize yourself with what each plotted line signifies:
Fundamental Line: Represents core price movements adjusted through SMA transformations.
Low Confirmation & Warnings: Provide early signals about potential reversals or continuation scenarios.
Threshold B: Acts as a significant barrier indicating overbought/sold conditions.
Institutional Directions: Offer insights into larger player activities and intentions.
Interpreting Signals:
Pay close attention to generated "Buy" and "Sell" labels appearing directly on your chart:
"Buy" Label: Indicates favorable momentum crossing from below the confirmation level upwards.
"Sell" Label: Suggests bearish transitions when moving beneath set thresholds.
Adjusting Parameters:
While this version primarily uses default settings derived from optimal testing ranges, feel free to experiment:
Modify lookback periods in SMA/EMA functions if different timeframes align better with your strategy.
Customize plot colors/styles for enhanced readability and personal taste.
Integrating with Other Tools:
Enhance the reliability of signals produced by combining them with complementary indicators like RSI, MACD, or volume profiles for thorough validation.
Continuous Monitoring:
Regularly review performance and refine strategies incorporating insights gathered from [blackcat] L3 Market Pulse Insight across varying markets and assets.
LIMITATIONS
Data Dependency: Performance heavily relies on accurate historical data without anomalies.
Market Conditions Variability: Effectiveness may vary during extreme volatility or thin liquidity environments.
Parameter Fine-Tuning: Optimal configuration might differ significantly across instruments; continuous adjustments are necessary.
No Guarantees: Like any tool, this doesn't ensure profits and should be part of a broader analytical framework.
NOTES
Ensure solid grounding in technical analysis principles before deploying solely upon these insights.
Utilize backtesting rigorously under diverse market cycles to assess robustness thoroughly.
Consider external factors such as economic reports, geopolitical events influencing asset prices beyond purely statistical models.
Maintain discipline adhering predefined risk management protocols regardless of signal strength displayed here.
THANKS
We appreciate every member's contributions who have engaged actively throughout our development journey, offering constructive feedback driving improvements continually 🙏. Together we strive toward creating ever-more robust tools empowering traders worldwide!
The [blackcat] L3 Market Pulse Insight provides comprehensive analytics by evaluating key price metrics to reveal critical market sentiment and potential trade opportunities 📊🔍. This advanced indicator leverages proprietary calculations involving Simple Moving Averages (SMAs), Exponential Moving Averages (EMAs), and custom thresholds to deliver detailed insights into current market dynamics 🚀✨.
By plotting various lines representing core fundamentals and directional cues, traders gain visibility into underlying trends and shifts within the market pulse. The visual aids simplify complex data interpretation, making it easier for users to make strategic decisions based on clear, actionable information ✅⛈️.
FEATURES
Advanced Calculation Techniques:
Employs sophisticated formulas integrating SMAs and EMAs for precise trend analysis.
Incorporates fundamental lines and confirmations based on recent price extremes.
Comprehensive Visualization:
Plots multiple informational lines: Fundamental Line, Thresholds, Institutional Directions, etc., each reflecting unique aspects of price behavior.
Uses distinct colors for easy differentiation between bearish and bullish indications.
Customizable Alerts:
Generates "Buy" and "Sell" labels at pivotal moments, highlighting entry/exit points visually.
Offers flexibility to modify alert styles and positions according to user preferences.
Dynamic Adaptability:
Continuously updates plots and alerts based on incoming real-time data for timely responses.
Provides dynamic support/resistance levels adapting to evolving market conditions.
HOW TO USE
Installing the Indicator:
To start using the [blackcat] L3 Market Pulse Insight, add it via the Pine Editor on TradingView:
Open the editor from the bottom panel.
Copy-paste the provided script code.
Click “Add to Chart” after pasting.
Understanding Key Lines:
Familiarize yourself with what each plotted line signifies:
Fundamental Line: Represents core price movements adjusted through SMA transformations.
Low Confirmation & Warnings: Provide early signals about potential reversals or continuation scenarios.
Threshold B: Acts as a significant barrier indicating overbought/sold conditions.
Institutional Directions: Offer insights into larger player activities and intentions.
Interpreting Signals:
Pay close attention to generated "Buy" and "Sell" labels appearing directly on your chart:
"Buy" Label: Indicates favorable momentum crossing from below the confirmation level upwards.
"Sell" Label: Suggests bearish transitions when moving beneath set thresholds.
Adjusting Parameters:
While this version primarily uses default settings derived from optimal testing ranges, feel free to experiment:
Modify lookback periods in SMA/EMA functions if different timeframes align better with your strategy.
Customize plot colors/styles for enhanced readability and personal taste.
Integrating with Other Tools:
Enhance the reliability of signals produced by combining them with complementary indicators like RSI, MACD, or volume profiles for thorough validation.
Continuous Monitoring:
Regularly review performance and refine strategies incorporating insights gathered from [blackcat] L3 Market Pulse Insight across varying markets and assets.
LIMITATIONS
Data Dependency: Performance heavily relies on accurate historical data without anomalies.
Market Conditions Variability: Effectiveness may vary during extreme volatility or thin liquidity environments.
Parameter Fine-Tuning: Optimal configuration might differ significantly across instruments; continuous adjustments are necessary.
No Guarantees: Like any tool, this doesn't ensure profits and should be part of a broader analytical framework.
NOTES
Ensure solid grounding in technical analysis principles before deploying solely upon these insights.
Utilize backtesting rigorously under diverse market cycles to assess robustness thoroughly.
Consider external factors such as economic reports, geopolitical events influencing asset prices beyond purely statistical models.
Maintain discipline adhering predefined risk management protocols regardless of signal strength displayed here.
THANKS
We appreciate every member's contributions who have engaged actively throughout our development journey, offering constructive feedback driving improvements continually 🙏. Together we strive toward creating ever-more robust tools empowering traders worldwide!
Информация о релизе
change overlay from true to falseИнформация о релизе
█ OVERVIEWA self-contained market pulse oscillator for the [blackcat] L3 system that turns price position inside a rolling range into a normalized 0-100 line, then adds a complete long/short signal loop with ATR-based stop and target reference levels. It shows where price sits inside its lookback range, when momentum flips, and when to close a position.
█ CONCEPTS
The indicator measures where the current price stands within the highest-lowest range of a lookback window and normalizes it to a 0-100 scale. Two smoothed averages of this position form the Fundamental Line: crossing above the Low Confirmation level marks potential long zones, and crossing below the upper Threshold B marks potential short zones.
Key principles:
• Range position first: the Fundamental Line tells you if price is stretched toward the high (100) or the low (0) of its range
• Edge-triggered signals: entries fire only on crosses, not on level holds, which reduces re-triggering
• State machine: long, flat, and short states with a cooldown filter avoid whipsaw re-entry in the same move
• Volatility-aware exits: stop and target levels are derived from ATR instead of fixed percentages
█ HOW TO USE
1 — Add the indicator to a chart (it plots in a separate pane)
2 — Keep the defaults first; tune Stochastic Lookback to your market rhythm, and adjust Threshold B / Low Confirmation for sensitivity
3 — Act on Buy / Sell labels, and watch the SL / TP (%) dashed lines once a position state is active
4 — Create alerts from the six built-in alert conditions if needed
Input Parameters
• Stochastic Lookback (27): range window for the pulse line
• Fast Smoothing (5) / Slow Smoothing (3): smoothing of the pulse line
• Low Confirmation Level (10): lower boundary — crossing up = long zone
• Threshold B (90): upper boundary — crossing down = short zone
• Momentum EMA Fast (13) / Slow (34): momentum spread speeds
• Momentum Signal Smoothing (5): smooths the momentum spread
• Momentum Amplifier (5.5): scales the institutional direction lines
• Enable Short Signals (on): turn short entries off for long-only use
• Same-bar Entry Exclusivity (on): never long and short on one bar
• Cooldown Bars (3): minimum bars between new entries (0 = off)
• Show TP/SL Reference Levels (on): enable ATR-based stop/target lines
• ATR Length (14): volatility basis for stop/target
• Stop Loss xATR (2.0) / Take Profit xATR (3.0): distance multipliers
• Show Position Background / Dashboard / Signal Labels (on): visuals
█ FEATURES
• Full loop: long and short entries, flip exits, plus protective stop-loss and take-profit exits
• ATR-based reference levels that adapt to volatility
• Whipsaw filtering: cooldown timer and same-bar exclusivity
• Six alert conditions (entry, exit, TP, SL) with close-confirmed alert() calls
• Dashboard table, position background and Buy/Sell/exit labels
• All thresholds and behaviors exposed as inputs
█ SIGNALS
Visual Elements
• Fundamental Line (white): normalized position inside the range
• Low Confirmation (red): lower boundary of the range
• Warning (yellow): pulses to 100 when the line crosses the low boundary
• Threshold B (aqua): upper boundary of the range
• Institutional Direction B (green) / A (red): momentum spread below and above zero
• Position State (data window): -1 short / 0 flat / +1 long
• SL / TP Distance (%): dashed lines showing stop and target distance from entry as a percentage
• Buy label (green up arrow): long entry
• Sell label (red down arrow): short entry
• Exit label (orange cross; teal = TP, red = SL): position close
█ IMPLEMENTATION NOTES
This open-source script uses standard Pine built-ins only — ta.highest, ta.lowest, ta.sma, ta.ema, ta.atr, ta.crossover and ta.crossunder. Signal state is managed with var variables and a cooldown bar counter; all ta.* calls run unconditionally on every bar, so there is no conditional-history side effect. TP/SL values are reference levels for the indicator pane and are not broker orders.
█ LIMITATIONS
• Works best on liquid, ranging-to-trending markets; chop can still generate labels after cooldown
• The Fundamental Line is derived from a single timeframe — no multi-timeframe confluence is built in
• TP/SL lines are references only; they do not place or cancel orders
• Early bars show no signals until the lookback window is filled
█ NOTES
• Part of the [blackcat] L3 series — rebuilds the classic pulse reading with a modern signal loop
• Signals are evaluated on bar close; alert() fires once per bar close
═════════════════════════════════════════════════════════════════════════
For questions or feedback, use comments section below.
Feel free to use and modify — attribution appreciated.

Don't miss out! The first and most important thing to do is to join my Discord chat now! Click here to start your adventure: discord.com/invite/ZTGpQJq My new github for more pine development soon: github.com/wxt-coder
Отказ от ответственности
Информация и публикации не предназначены для предоставления и не являются финансовыми, инвестиционными, торговыми или другими видами советов или рекомендаций, предоставленных или одобренных TradingView. Подробнее читайте в Условиях использования.
Don't miss out! The first and most important thing to do is to join my Discord chat now! Click here to start your adventure: discord.com/invite/ZTGpQJq My new github for more pine development soon: github.com/wxt-coder
Отказ от ответственности
Информация и публикации не предназначены для предоставления и не являются финансовыми, инвестиционными, торговыми или другими видами советов или рекомендаций, предоставленных или одобренных TradingView. Подробнее читайте в Условиях использования.