OPEN-SOURCE SCRIPT
Event Probability Engine [Quantum Algo]
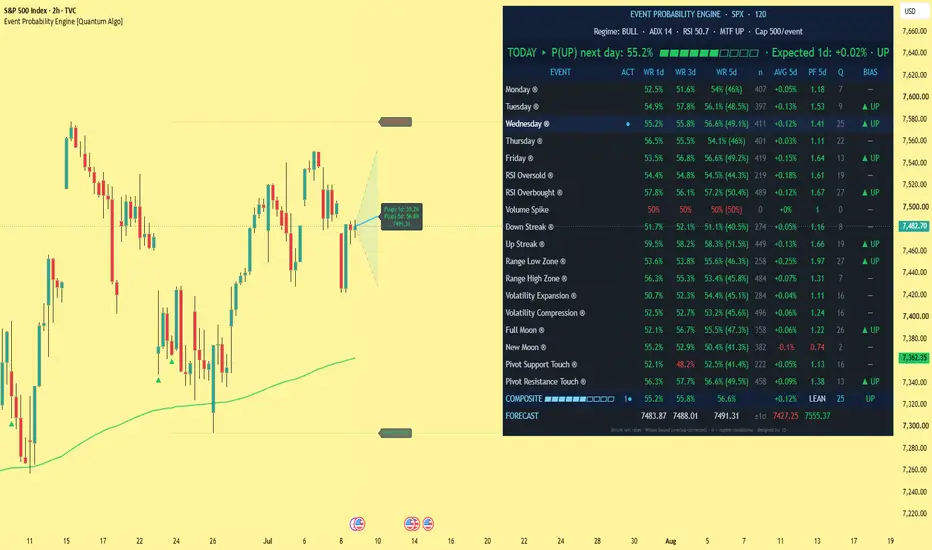
Event Probability Engine [Quantum Algo]
====================================================
🔶 OVERVIEW
Event Probability Engine is a statistical probability indicator that answers one question at the close of every bar: based on the measurable conditions active right now, what is the historical probability that price closes higher one, three, and five days from today? Instead of subjective pattern reading, the script builds and maintains a live rolling database of forward returns conditioned on eighteen observable market events — day-of-week seasonality, oversold and overbought readings, volume spikes, streaks, range position, volatility regime, pivot touches, and an optional lunar control — then pools the currently active events into a single composite probability, displayed as a TODAY headline, a full per-event statistics table, and a shaded forecast cone projected on the chart.
It is designed for the daily timeframe. On other timeframes, the one, three, and five day horizons become one, three, and five bars.
🔶 WHAT IS AN EVENT STUDY?
An event study measures what a market historically did after a defined, observable condition occurred — for example, what happened over the next five days every time the Relative Strength Index closed oversold, or every Monday, or every time volume spiked two standard deviations above normal. This indicator runs eighteen such studies continuously, in real time, on the chart's own data, and keeps every study honest with the statistical safeguards described below.
🔶 WHY THIS SCRIPT IS ORIGINAL
1. A live event database in Pine. Each of the eighteen events maintains its own rolling, capped sample of forward returns at three horizons, tagged with the market regime at the moment the event fired — a self-updating event-study framework, not a fixed backtest.
2. Shrinkage estimation. Every win rate is pulled toward fifty percent by a configurable number of pseudo-samples. An event with fifteen samples cannot display an extreme probability, because fifteen samples cannot justify one.
3. Overlap correction. State-based events (for example, an oversold reading persisting for a week) generate autocorrelated, overlapping samples that inflate apparent sample size. The effective sample size is deflated by the horizon length before any confidence calculation.
4. Wilson score bounds. Next to each five-day win rate, the table shows the Wilson confidence lower bound computed on the corrected sample size — the number an event must clear before its edge deserves trust, not its raw point estimate.
5. Regime conditioning with fallback. When enough samples exist in the current regime (bull or bear, defined by the two-hundred period exponential moving average), statistics are computed on regime-matched samples only, marked ® in the table. A bear-market Thursday is not assumed to behave like a bull-market Thursday.
6. Quality-weighted log-odds pooling. Active events are combined by weighted log-odds — a method related to Bayesian evidence combination — rather than naive win-rate averaging, so one strong, well-sampled edge is not diluted by three weak ones.
7. A built-in falsification control. Lunar phase events are included deliberately so the engine can audit a popular claim empirically: if full and new moons carry no edge, their quality scores sit near zero and they contribute nothing to the composite. A probability framework should be able to demonstrate which inputs fail, not only which appear to work.
🔶 HOW IT WORKS
Event detection: On every bar close the script evaluates all eighteen conditions — Monday through Friday, adaptive or fixed oversold and overbought thresholds, volume z-score spikes, up and down streaks, range-low and range-high position, volatility expansion and compression by percentile rank, confirmed pivot support and resistance touches within an Average True Range distance, and the optional lunar events.
Database recording: Whenever an event was active one, three, or five bars ago, the realized forward return is stored in that event's arrays, first-in-first-out at a configurable cap, together with the regime tag from the moment the event fired.
Per-event statistics: The table reports, for every event, the shrinkage-adjusted win rate at each horizon, the Wilson lower bound, sample count, average forward return, profit factor, a zero-to-one-hundred quality score blending edge magnitude, sample sufficiency, and recent consistency, and the resulting directional bias.
Composite probability: Active events passing the minimum-sample filter are pooled by quality-weighted log-odds into the TODAY headline (next-day probability of an up close with a visual meter), the one, three, and five day composite row with expected returns and a strength grade, and a projected forecast path with a shaded plus-and-minus one standard deviation cone drawn from the current close.
Chart layer: Optional regime background tint, the regime line, live pivot support and resistance rails with prices, and historical event markers on the candles so past occurrences of every event can be reviewed directly on the chart.
🔶 HOW TO USE IT
1. Apply it to a daily chart of any liquid symbol — cryptocurrency, stocks, indices, forex, gold, futures. Let it load its history; sample counts grow with available bars.
2. Read the TODAY headline first: the next-day probability, the meter, and the expected one-day return.
3. Scan the table for the highlighted rows — those events are active right now. Judge each by its Wilson lower bound and quality score, not the raw win rate.
4. Use the composite row and forecast cone as context: STRONG requires both a meaningful probability distance from fifty percent and high average quality.
5. Treat readings near fifty percent as exactly what they are: weak evidence. This engine is intentionally built to display small honest numbers rather than large misleading ones.
6. Combine with your own analysis — the engine measures conditional history; it does not know tomorrow's news.
🔶 SETTINGS
- Database: sample cap per event, minimum samples for composite inclusion, minimum regime-matched samples, shrinkage strength.
- Events: oscillator length and thresholds (fixed or adaptive percentile), volume z-score, streak length, range lookback, pivot lookback and touch distance, lunar events on or off.
- Statistics: Wilson z-score (default 1.645, a ninety percent one-sided bound).
- Display: dashboard position and five text sizes, forecast cone, regime tint, regime line, pivot rails, candle markers.
🔶 ALERTS
- Composite Bias Change — fires once per bar close whenever the five-day composite bias flips state, with the current one-day and five-day probabilities in the message.
🔶 FREQUENTLY ASKED QUESTIONS
Does the indicator repaint? Statistics are recorded and evaluated on closed bars, and pivot events use confirmed pivots with their standard confirmation lag. The dashboard and forecast update on the live bar by design, as a dashboard should.
Why do most probabilities sit near fifty percent? Because genuine conditional edges in daily data are small, and the shrinkage and overlap corrections are built to say so. Extreme displayed probabilities on thin samples are the signature of a dishonest tool.
What does the ® mark mean? That event currently has enough regime-matched samples, so its statistics are computed only from the current bull or bear regime rather than the full history.
Why are moon phases in a statistics tool? As a falsification control. The engine should be able to show which inputs carry no edge — and the user can watch it do exactly that.
Can I use it intraday? Yes, but the horizons become bars instead of days, and day-of-week events lose their meaning. The design intent is the daily timeframe.
🔶 CREDITS
This script stands on standard, publicly documented statistical methods, gratefully credited: the Wilson score interval by Edwin B. Wilson (1927), Laplace-style shrinkage estimation, and the event-study methodology long established in quantitative finance. Their combination into a live, regime-conditional, overlap-corrected event database with quality-weighted log-odds composite pooling, implemented entirely in Pine Script with capped arrays and user-defined types, is original work — no third-party or open-source script code was reused.
🔶 LIMITATIONS
Probabilities derived from historical conditioning are estimates, not guarantees, and conditional edges in daily data are typically small. Sample databases need history to mature; young charts produce thin, heavily shrunk statistics by design. Day-of-week events assume a five-day session calendar. Regime conditioning depends on the two-hundred period regime definition. This is a research and confluence tool, not a standalone trading system.
🔶 DISCLAIMER
This script is provided strictly for educational and informational purposes. It is not financial advice, an investment recommendation, or a solicitation to buy or sell any financial instrument. Past statistical behavior does not assure future results. Trading involves substantial risk. Always do your own research and manage risk independently.
====================================================
🔶 OVERVIEW
Event Probability Engine is a statistical probability indicator that answers one question at the close of every bar: based on the measurable conditions active right now, what is the historical probability that price closes higher one, three, and five days from today? Instead of subjective pattern reading, the script builds and maintains a live rolling database of forward returns conditioned on eighteen observable market events — day-of-week seasonality, oversold and overbought readings, volume spikes, streaks, range position, volatility regime, pivot touches, and an optional lunar control — then pools the currently active events into a single composite probability, displayed as a TODAY headline, a full per-event statistics table, and a shaded forecast cone projected on the chart.
It is designed for the daily timeframe. On other timeframes, the one, three, and five day horizons become one, three, and five bars.
🔶 WHAT IS AN EVENT STUDY?
An event study measures what a market historically did after a defined, observable condition occurred — for example, what happened over the next five days every time the Relative Strength Index closed oversold, or every Monday, or every time volume spiked two standard deviations above normal. This indicator runs eighteen such studies continuously, in real time, on the chart's own data, and keeps every study honest with the statistical safeguards described below.
🔶 WHY THIS SCRIPT IS ORIGINAL
1. A live event database in Pine. Each of the eighteen events maintains its own rolling, capped sample of forward returns at three horizons, tagged with the market regime at the moment the event fired — a self-updating event-study framework, not a fixed backtest.
2. Shrinkage estimation. Every win rate is pulled toward fifty percent by a configurable number of pseudo-samples. An event with fifteen samples cannot display an extreme probability, because fifteen samples cannot justify one.
3. Overlap correction. State-based events (for example, an oversold reading persisting for a week) generate autocorrelated, overlapping samples that inflate apparent sample size. The effective sample size is deflated by the horizon length before any confidence calculation.
4. Wilson score bounds. Next to each five-day win rate, the table shows the Wilson confidence lower bound computed on the corrected sample size — the number an event must clear before its edge deserves trust, not its raw point estimate.
5. Regime conditioning with fallback. When enough samples exist in the current regime (bull or bear, defined by the two-hundred period exponential moving average), statistics are computed on regime-matched samples only, marked ® in the table. A bear-market Thursday is not assumed to behave like a bull-market Thursday.
6. Quality-weighted log-odds pooling. Active events are combined by weighted log-odds — a method related to Bayesian evidence combination — rather than naive win-rate averaging, so one strong, well-sampled edge is not diluted by three weak ones.
7. A built-in falsification control. Lunar phase events are included deliberately so the engine can audit a popular claim empirically: if full and new moons carry no edge, their quality scores sit near zero and they contribute nothing to the composite. A probability framework should be able to demonstrate which inputs fail, not only which appear to work.
🔶 HOW IT WORKS
Event detection: On every bar close the script evaluates all eighteen conditions — Monday through Friday, adaptive or fixed oversold and overbought thresholds, volume z-score spikes, up and down streaks, range-low and range-high position, volatility expansion and compression by percentile rank, confirmed pivot support and resistance touches within an Average True Range distance, and the optional lunar events.
Database recording: Whenever an event was active one, three, or five bars ago, the realized forward return is stored in that event's arrays, first-in-first-out at a configurable cap, together with the regime tag from the moment the event fired.
Per-event statistics: The table reports, for every event, the shrinkage-adjusted win rate at each horizon, the Wilson lower bound, sample count, average forward return, profit factor, a zero-to-one-hundred quality score blending edge magnitude, sample sufficiency, and recent consistency, and the resulting directional bias.
Composite probability: Active events passing the minimum-sample filter are pooled by quality-weighted log-odds into the TODAY headline (next-day probability of an up close with a visual meter), the one, three, and five day composite row with expected returns and a strength grade, and a projected forecast path with a shaded plus-and-minus one standard deviation cone drawn from the current close.
Chart layer: Optional regime background tint, the regime line, live pivot support and resistance rails with prices, and historical event markers on the candles so past occurrences of every event can be reviewed directly on the chart.
🔶 HOW TO USE IT
1. Apply it to a daily chart of any liquid symbol — cryptocurrency, stocks, indices, forex, gold, futures. Let it load its history; sample counts grow with available bars.
2. Read the TODAY headline first: the next-day probability, the meter, and the expected one-day return.
3. Scan the table for the highlighted rows — those events are active right now. Judge each by its Wilson lower bound and quality score, not the raw win rate.
4. Use the composite row and forecast cone as context: STRONG requires both a meaningful probability distance from fifty percent and high average quality.
5. Treat readings near fifty percent as exactly what they are: weak evidence. This engine is intentionally built to display small honest numbers rather than large misleading ones.
6. Combine with your own analysis — the engine measures conditional history; it does not know tomorrow's news.
🔶 SETTINGS
- Database: sample cap per event, minimum samples for composite inclusion, minimum regime-matched samples, shrinkage strength.
- Events: oscillator length and thresholds (fixed or adaptive percentile), volume z-score, streak length, range lookback, pivot lookback and touch distance, lunar events on or off.
- Statistics: Wilson z-score (default 1.645, a ninety percent one-sided bound).
- Display: dashboard position and five text sizes, forecast cone, regime tint, regime line, pivot rails, candle markers.
🔶 ALERTS
- Composite Bias Change — fires once per bar close whenever the five-day composite bias flips state, with the current one-day and five-day probabilities in the message.
🔶 FREQUENTLY ASKED QUESTIONS
Does the indicator repaint? Statistics are recorded and evaluated on closed bars, and pivot events use confirmed pivots with their standard confirmation lag. The dashboard and forecast update on the live bar by design, as a dashboard should.
Why do most probabilities sit near fifty percent? Because genuine conditional edges in daily data are small, and the shrinkage and overlap corrections are built to say so. Extreme displayed probabilities on thin samples are the signature of a dishonest tool.
What does the ® mark mean? That event currently has enough regime-matched samples, so its statistics are computed only from the current bull or bear regime rather than the full history.
Why are moon phases in a statistics tool? As a falsification control. The engine should be able to show which inputs carry no edge — and the user can watch it do exactly that.
Can I use it intraday? Yes, but the horizons become bars instead of days, and day-of-week events lose their meaning. The design intent is the daily timeframe.
🔶 CREDITS
This script stands on standard, publicly documented statistical methods, gratefully credited: the Wilson score interval by Edwin B. Wilson (1927), Laplace-style shrinkage estimation, and the event-study methodology long established in quantitative finance. Their combination into a live, regime-conditional, overlap-corrected event database with quality-weighted log-odds composite pooling, implemented entirely in Pine Script with capped arrays and user-defined types, is original work — no third-party or open-source script code was reused.
🔶 LIMITATIONS
Probabilities derived from historical conditioning are estimates, not guarantees, and conditional edges in daily data are typically small. Sample databases need history to mature; young charts produce thin, heavily shrunk statistics by design. Day-of-week events assume a five-day session calendar. Regime conditioning depends on the two-hundred period regime definition. This is a research and confluence tool, not a standalone trading system.
🔶 DISCLAIMER
This script is provided strictly for educational and informational purposes. It is not financial advice, an investment recommendation, or a solicitation to buy or sell any financial instrument. Past statistical behavior does not assure future results. Trading involves substantial risk. Always do your own research and manage risk independently.
Скрипт с открытым кодом
В истинном духе TradingView, создатель этого скрипта сделал его открытым исходным кодом, чтобы трейдеры могли проверить и убедиться в его функциональности. Браво автору! Вы можете использовать его бесплатно, но помните, что перепубликация кода подчиняется нашим Правилам поведения.

The institutional Edge: Indicators, Strategies & a Free Academy. quantum-algo.com
Отказ от ответственности
Информация и публикации не предназначены для предоставления и не являются финансовыми, инвестиционными, торговыми или другими видами советов или рекомендаций, предоставленных или одобренных TradingView. Подробнее читайте в Условиях использования.
Скрипт с открытым кодом
В истинном духе TradingView, создатель этого скрипта сделал его открытым исходным кодом, чтобы трейдеры могли проверить и убедиться в его функциональности. Браво автору! Вы можете использовать его бесплатно, но помните, что перепубликация кода подчиняется нашим Правилам поведения.
The institutional Edge: Indicators, Strategies & a Free Academy. quantum-algo.com
Отказ от ответственности
Информация и публикации не предназначены для предоставления и не являются финансовыми, инвестиционными, торговыми или другими видами советов или рекомендаций, предоставленных или одобренных TradingView. Подробнее читайте в Условиях использования.