Copper vs Cu/Au Decomposition
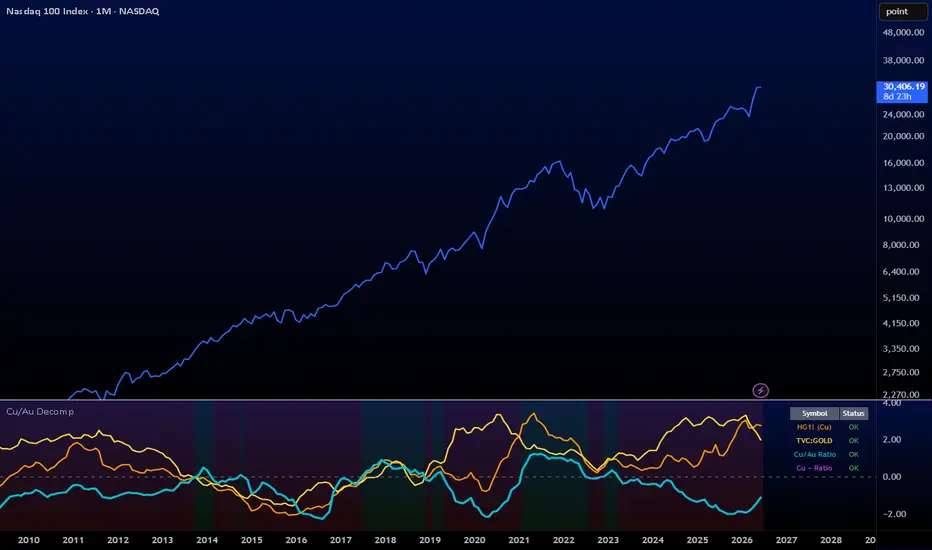
Copper vs Cu/Au Decomposition
The copper-to-gold ratio is one of the most widely watched macro signals in markets, used as a proxy for global growth, risk appetite, and the direction of long-end yields. The framework is intuitive. Copper demand rises with industrial activity. Gold demand rises with monetary and geopolitical stress. The ratio encodes the balance between growth-on and defense-on regimes.
It has a structural blind spot. Because Cu/Au is a quotient of two independently moving series, the ratio alone cannot tell you which leg is doing the work. A rising Cu/Au might mean copper is rallying on real industrial demand. It might also mean gold is selling off on a hawkish surprise while copper does nothing. A falling Cu/Au might mean genuine growth weakness, or it might mean copper is strong but gold is even stronger and is masking the signal. Same number, very different stories, very different trades.
This indicator decomposes the ratio into its components so you can see which side is actually driving it. It plots copper, gold, and the ratio as z-score normalized series on a shared monthly timeframe, then adds a derived line that quantifies the gap between copper's absolute strength and what the ratio is reporting. That derived line is the diagnostic.
WHAT IT PLOTS
- Four lines, all sampled on the monthly timeframe regardless of the chart timeframe.
Copper z-score (orange)
- HG1! monthly close, normalized over a rolling 60-month lookback, lightly EMA-smoothed.
Gold z-score (yellow)
- TVC:GOLD monthly close, same treatment.
Cu/Au ratio z-score (aqua)
- The headline series with heavier linewidth.
The ratio is built by sampling both legs on the same monthly bar via nested request security before forming the quotient. This matters. If you compute the ratio at chart level using forward-filled monthly values, a 60-bar rolling window on a daily chart averages roughly three months of stepped data rather than 60 actual monthly observations. The nested approach preserves true monthly resolution in the rolling window.
Copper minus Ratio spread (magenta)
- The diagnostic line. Optional, off by default to keep the panel clean on first load.
Supporting elements include a dashed zero line, light green and red background tints keyed to the ratio's sign, and a status table top-right confirming each symbol loaded. All four lines have independent toggles.
HOW TO READ IT
- The three primary lines tell you what each leg is doing. The magenta spread tells you whether the ratio is being honest about copper.
Spread near zero
The ratio is faithfully reporting copper. Read Cu/Au at face value.
Spread positive and rising
Copper is stronger than the ratio shows. Gold strength is masking it. Lean long copper but do not trust ratio-based signals to size the trade.
Spread negative and falling
The ratio is overstating copper. The move is really a short-gold story misrepresented as a copper bid. Fade ratio-based copper longs in this regime.
THE FOUR CHARACTERISTIC SCENARIOS
Clean cyclical turn - Copper rises, gold flat, ratio rises, spread near zero. All signals agree. The ratio is honest. High-confidence growth-on tape.
Masked copper strength - Copper rises, gold rises harder, ratio flat or falling, spread sharply positive. The ratio is hiding real copper strength behind a stronger gold leg. This is the regime the indicator exists to flag.
Fake copper signal from gold weakness - Copper flat, gold collapses, ratio rises, spread sharply negative. The ratio looks bullish on copper but it is really a short-gold story. Fade.
Confirmed risk-off - Copper falls, gold rises, ratio falls hard, spread roughly flat. Both legs agree on defense. The ratio is honest.
WHAT THE SPREAD REVEALS
The Cu/Au ratio loses information whenever gold moves independently of copper. The spread quantifies that lost information as a single readable number. When it sits near zero, no information is being lost. Copper and the ratio are saying the same thing. When it deviates, the ratio is failing as a copper proxy and you need to step around it to the underlying components.
The decomposition can be done mentally by watching the three primary lines, but doing it in real time while reading a chart is error-prone. The spread does that subtraction explicitly and renders the answer as a single line whose distance from zero is the magnitude of the distortion. Z-scoring the ratio as its own series, rather than computing the spread as copper z minus gold z arithmetically, is the design choice that makes the spread responsive to what the ratio is actually doing as a series, not just what its components are doing in isolation.
INPUTS AND DEFAULTS
Z-Score Lookback (default 60)
- The rolling window for mean and standard deviation, in monthly bars. Five years captures roughly one full commodity and business cycle, long enough to represent a regime-neutral baseline but short enough to update when the macro environment shifts.
EMA Smoothing Length (default 3)
- Light smoothing on each z-score after normalization. Three monthly bars dampens single-month noise without introducing meaningful lag.
Source Timeframe (default M)
- The timeframe at which all symbols are sampled. See Suggested settings below for pairings with different lookbacks.
Display toggles
- Independent show/hide for each line, the background tint, and the status table.
Suggested settings
The two calibration inputs, lookback and source timeframe, are not really independent. They multiply to give you one number, the regime window the z-score measures against. Lookback × bar length = regime window. The default monthly × 60 produces a 5-year window because that's the natural horizon for Cu/Au as a multi-year cycle signal. Other source timeframes can preserve the same horizon at finer visual resolution.
Macro regime (~5 years)
- The indicator's original design horizon. Best for reading Cu/Au as a structural cycle tool. Monthly × 60, weekly × 260, daily × 1260, or 3D × 420.
Cycle phase (~2 years)
- Intermediate, captures one full phase of a business or commodity cycle. Useful when the broader regime is well established and the question is where within it you currently sit. Monthly × 24, weekly × 104, daily × 504, or 3D × 168.
Tactical (~6 months)
- Short horizon, asks where copper sits relative to recent trading. The masking dynamic operates more weakly at this scale, so the spread's diagnostic power is reduced. Weekly × 26, daily × 126, or 3D × 42.
A few practical notes on choosing among these
The higher the source timeframe, the more it filters intra-period noise before the z-score is calculated. Monthly source gives the cleanest macro read but updates only when a new month closes, producing a stepped visual on lower chart timeframes. Setting source equal to your chart timeframe gives a smoother line but mixes regime drift with intra-period noise.
A useful middle ground on multi-day charts is setting source one or two steps above your chart timeframe. On a 3D chart, weekly source smooths daily volatility without going all the way to monthly's stepped behavior.
Z-score magnitudes do not transfer perfectly across sources. Higher-frequency series carry more variance, which inflates the rolling standard deviation and compresses z-scores. The same 5-year window will print spikier readings on monthly than on daily because monthly closes filter noise before the calculation begins. The shape of moves matches across sources, but the amplitudes do not.
The most informative use is running multiple instances of the indicator simultaneously at different horizons. The slow spread tells you whether the macro Cu/Au framework is currently honest. The fast spread tells you about near-term distortions worth trading around.
Notes
Data is fetched with gaps=barmerge.gaps_off and ignore_invalid_symbol=true, so missing bars are forward-filled and the indicator does not break if a symbol fails to load. Calculations are non-repainting.
Best used on weekly or daily charts at the default settings. The monthly resampling gives meaningful resolution there. Below daily, monthly values will appear as long flat segments, in which case the suggested settings above for tactical or cycle-phase calibrations are worth considering.
Originality
The underlying mechanics, z-score normalization, forward-filling, and ratio construction, are standard. The original contributions are three: the integrated four-line decomposition; the construction of the ratio from same-bar monthly samples via nested request security to preserve true monthly window resolution; and the Copper-minus-Ratio spread as an explicit measure of when the Cu/Au ratio is being distorted by gold-side moves. No published TradingView indicator I am aware of combines these elements as a single diagnostic for Cu/Au signal quality.
The copper-to-gold ratio is one of the most widely watched macro signals in markets, used as a proxy for global growth, risk appetite, and the direction of long-end yields. The framework is intuitive. Copper demand rises with industrial activity. Gold demand rises with monetary and geopolitical stress. The ratio encodes the balance between growth-on and defense-on regimes.
It has a structural blind spot. Because Cu/Au is a quotient of two independently moving series, the ratio alone cannot tell you which leg is doing the work. A rising Cu/Au might mean copper is rallying on real industrial demand. It might also mean gold is selling off on a hawkish surprise while copper does nothing. A falling Cu/Au might mean genuine growth weakness, or it might mean copper is strong but gold is even stronger and is masking the signal. Same number, very different stories, very different trades.
This indicator decomposes the ratio into its components so you can see which side is actually driving it. It plots copper, gold, and the ratio as z-score normalized series on a shared monthly timeframe, then adds a derived line that quantifies the gap between copper's absolute strength and what the ratio is reporting. That derived line is the diagnostic.
WHAT IT PLOTS
- Four lines, all sampled on the monthly timeframe regardless of the chart timeframe.
Copper z-score (orange)
- HG1! monthly close, normalized over a rolling 60-month lookback, lightly EMA-smoothed.
Gold z-score (yellow)
- TVC:GOLD monthly close, same treatment.
Cu/Au ratio z-score (aqua)
- The headline series with heavier linewidth.
The ratio is built by sampling both legs on the same monthly bar via nested request security before forming the quotient. This matters. If you compute the ratio at chart level using forward-filled monthly values, a 60-bar rolling window on a daily chart averages roughly three months of stepped data rather than 60 actual monthly observations. The nested approach preserves true monthly resolution in the rolling window.
Copper minus Ratio spread (magenta)
- The diagnostic line. Optional, off by default to keep the panel clean on first load.
Supporting elements include a dashed zero line, light green and red background tints keyed to the ratio's sign, and a status table top-right confirming each symbol loaded. All four lines have independent toggles.
HOW TO READ IT
- The three primary lines tell you what each leg is doing. The magenta spread tells you whether the ratio is being honest about copper.
Spread near zero
The ratio is faithfully reporting copper. Read Cu/Au at face value.
Spread positive and rising
Copper is stronger than the ratio shows. Gold strength is masking it. Lean long copper but do not trust ratio-based signals to size the trade.
Spread negative and falling
The ratio is overstating copper. The move is really a short-gold story misrepresented as a copper bid. Fade ratio-based copper longs in this regime.
THE FOUR CHARACTERISTIC SCENARIOS
Clean cyclical turn - Copper rises, gold flat, ratio rises, spread near zero. All signals agree. The ratio is honest. High-confidence growth-on tape.
Masked copper strength - Copper rises, gold rises harder, ratio flat or falling, spread sharply positive. The ratio is hiding real copper strength behind a stronger gold leg. This is the regime the indicator exists to flag.
Fake copper signal from gold weakness - Copper flat, gold collapses, ratio rises, spread sharply negative. The ratio looks bullish on copper but it is really a short-gold story. Fade.
Confirmed risk-off - Copper falls, gold rises, ratio falls hard, spread roughly flat. Both legs agree on defense. The ratio is honest.
WHAT THE SPREAD REVEALS
The Cu/Au ratio loses information whenever gold moves independently of copper. The spread quantifies that lost information as a single readable number. When it sits near zero, no information is being lost. Copper and the ratio are saying the same thing. When it deviates, the ratio is failing as a copper proxy and you need to step around it to the underlying components.
The decomposition can be done mentally by watching the three primary lines, but doing it in real time while reading a chart is error-prone. The spread does that subtraction explicitly and renders the answer as a single line whose distance from zero is the magnitude of the distortion. Z-scoring the ratio as its own series, rather than computing the spread as copper z minus gold z arithmetically, is the design choice that makes the spread responsive to what the ratio is actually doing as a series, not just what its components are doing in isolation.
INPUTS AND DEFAULTS
Z-Score Lookback (default 60)
- The rolling window for mean and standard deviation, in monthly bars. Five years captures roughly one full commodity and business cycle, long enough to represent a regime-neutral baseline but short enough to update when the macro environment shifts.
EMA Smoothing Length (default 3)
- Light smoothing on each z-score after normalization. Three monthly bars dampens single-month noise without introducing meaningful lag.
Source Timeframe (default M)
- The timeframe at which all symbols are sampled. See Suggested settings below for pairings with different lookbacks.
Display toggles
- Independent show/hide for each line, the background tint, and the status table.
Suggested settings
The two calibration inputs, lookback and source timeframe, are not really independent. They multiply to give you one number, the regime window the z-score measures against. Lookback × bar length = regime window. The default monthly × 60 produces a 5-year window because that's the natural horizon for Cu/Au as a multi-year cycle signal. Other source timeframes can preserve the same horizon at finer visual resolution.
Macro regime (~5 years)
- The indicator's original design horizon. Best for reading Cu/Au as a structural cycle tool. Monthly × 60, weekly × 260, daily × 1260, or 3D × 420.
Cycle phase (~2 years)
- Intermediate, captures one full phase of a business or commodity cycle. Useful when the broader regime is well established and the question is where within it you currently sit. Monthly × 24, weekly × 104, daily × 504, or 3D × 168.
Tactical (~6 months)
- Short horizon, asks where copper sits relative to recent trading. The masking dynamic operates more weakly at this scale, so the spread's diagnostic power is reduced. Weekly × 26, daily × 126, or 3D × 42.
A few practical notes on choosing among these
The higher the source timeframe, the more it filters intra-period noise before the z-score is calculated. Monthly source gives the cleanest macro read but updates only when a new month closes, producing a stepped visual on lower chart timeframes. Setting source equal to your chart timeframe gives a smoother line but mixes regime drift with intra-period noise.
A useful middle ground on multi-day charts is setting source one or two steps above your chart timeframe. On a 3D chart, weekly source smooths daily volatility without going all the way to monthly's stepped behavior.
Z-score magnitudes do not transfer perfectly across sources. Higher-frequency series carry more variance, which inflates the rolling standard deviation and compresses z-scores. The same 5-year window will print spikier readings on monthly than on daily because monthly closes filter noise before the calculation begins. The shape of moves matches across sources, but the amplitudes do not.
The most informative use is running multiple instances of the indicator simultaneously at different horizons. The slow spread tells you whether the macro Cu/Au framework is currently honest. The fast spread tells you about near-term distortions worth trading around.
Notes
Data is fetched with gaps=barmerge.gaps_off and ignore_invalid_symbol=true, so missing bars are forward-filled and the indicator does not break if a symbol fails to load. Calculations are non-repainting.
Best used on weekly or daily charts at the default settings. The monthly resampling gives meaningful resolution there. Below daily, monthly values will appear as long flat segments, in which case the suggested settings above for tactical or cycle-phase calibrations are worth considering.
Originality
The underlying mechanics, z-score normalization, forward-filling, and ratio construction, are standard. The original contributions are three: the integrated four-line decomposition; the construction of the ratio from same-bar monthly samples via nested request security to preserve true monthly window resolution; and the Copper-minus-Ratio spread as an explicit measure of when the Cu/Au ratio is being distorted by gold-side moves. No published TradingView indicator I am aware of combines these elements as a single diagnostic for Cu/Au signal quality.

Отказ от ответственности
Информация и публикации не предназначены для предоставления и не являются финансовыми, инвестиционными, торговыми или другими видами советов или рекомендаций, предоставленных или одобренных TradingView. Подробнее читайте в Условиях использования.
Отказ от ответственности
Информация и публикации не предназначены для предоставления и не являются финансовыми, инвестиционными, торговыми или другими видами советов или рекомендаций, предоставленных или одобренных TradingView. Подробнее читайте в Условиях использования.