OPEN-SOURCE SCRIPT
Market Regime Classifier [EXCAVO]
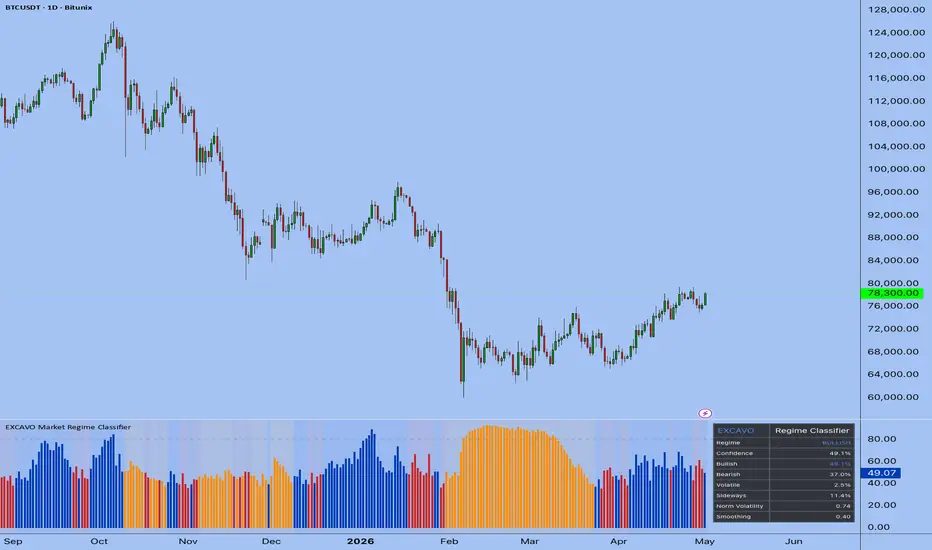
Four-State Probabilistic Regime Detection Using a Hidden Markov Model
The Market Regime Classifier applies a four-state Hidden Markov Model (HMM)
to classify the current market environment as Bullish, Bearish, Volatile, or Sideways.
Rather than using fixed thresholds on ADX or moving average slopes, the model maintains
and continuously updates a probability distribution across all four states on every bar,
producing smooth, low-noise regime identification.
This is not a threshold-based classifier. State probabilities update through Bayesian
forward inference, so regime transitions emerge from the data rather than arbitrary
cutoff values.
━━━━━━━━━━━━━━━━━━━━━━━━━━━━━━━━━━━━━━━
▸ HOW TO USE
Step 1 → Add the indicator to a new pane. The confidence histogram
appears immediately, colored by the current regime.
Step 2 → Read the regime from the histogram color and the dashboard
panel. Blue = Bullish, Red = Bearish, Orange = Volatile,
Gray = Sideways.
Step 3 → Monitor the confidence level. Above 80%, the model has high
conviction. Below 60%, the market is transitioning and both
adjacent states have similar probabilities.
Step 4 → Set up alerts for regime transitions. Each state change fires
on a closed bar only, eliminating repainting.
Step 5 → Check the dashboard for individual state probabilities. When
two states have close values, the market is ambiguous - this is
visible in the dashboard before a formal regime change occurs.
━━━━━━━━━━━━━━━━━━━━━━━━━━━━━━━━━━━━━━━
▸ HOW IT CALCULATES
◆ Data Conditioning
Each bar computes the log return: ln(close / close[1]). The mean and standard
deviation of log returns are calculated over the lookback period. Both are then
normalized: norm_ret = (log_ret - mean) / stdev, and norm_vol = stdev /
sma(stdev, lookback). This standardization makes the model asset-agnostic,
producing consistent behavior across equities, crypto, and forex without
requiring parameter adjustments per instrument.
◆ Gaussian Emission Likelihoods
Each of the four states has a Gaussian emission function that evaluates how
well the current normalized volatility and return match that state's expected
profile. The emission formula is exp(-(x - center)^2 / width), where x is the
normalized observation, center is the expected value for that state, and width
controls the response range:
A state's emission is high when the current bar's profile closely matches its center
and decreases exponentially as the observation diverges.
◆ Bayesian Forward Update
The model maintains four state probabilities (p_bull, p_bear, p_side, p_vola)
initialized at 0.25 each. On every bar, unnormalized posteriors are computed:
un_state = emission(state) x (p_state x 0.9 + sum_others x 0.033). The 0.9
self-transition coefficient gives the model inertia - it stays in the current
state unless emissions consistently support a different one. The 0.033
cross-transition coefficient (approximately (1 - 0.9) / 3) keeps all states
reachable. Posteriors are then normalized to sum to 1.0. The smoothing factor
controls how aggressively each bar's emission result shifts the running
probability, acting as an exponential moving average over the posterior series.
◆ State Classification and Confidence
The active regime is the state with the highest posterior probability (argmax).
Confidence equals this maximum probability expressed as a percentage. A regime
change is detected when the dominant state changes on a confirmed (closed) bar,
which fires all alerts. The dashboard shows all four probabilities simultaneously,
making it possible to observe when the market is approaching a state boundary
before the formal regime label changes.
━━━━━━━━━━━━━━━━━━━━━━━━━━━━━━━━━━━━━━━
▸ WHAT MAKES IT DIFFERENT
◆ Probabilistic State Engine
Most regime classifiers use fixed thresholds: if ADX > 25 then trending, otherwise
ranging. This produces abrupt, oscillating switches at the boundary and gives no
information about conviction. The HMM produces a smooth probability distribution
across all four states simultaneously, with conviction visible at every bar as
an explicit confidence percentage.
◆ Four-State Classification
Two-state models (trending vs. ranging) conflate Volatile markets with trending ones
and miss the distinction between low-activity consolidation and trend exhaustion.
Four states allow separate identification of sustained directional moves
(Bullish/Bearish), low-activity accumulation ranges (Sideways), and high-volatility
uncertainty (Volatile) - conditions that require different position sizing and
strategy selection.
◆ Adaptive Volatility Threshold
The Volatile state's emission center scales with the Volatility Sensitivity input.
This makes the model configurable across asset classes: crypto spends more time at
elevated volatility levels and may benefit from a higher sensitivity value than
equities or forex.
◆ Transition Memory (Inertia)
The self-transition coefficient (0.9) gives the model inertia - a single anomalous
bar cannot flip the regime. The classifier requires consistent evidence across
multiple bars to overcome the self-transition bias. This reduces false transitions
during brief volatility spikes or one-bar outliers.
━━━━━━━━━━━━━━━━━━━━━━━━━━━━━━━━━━━━━━━
▸ DASHBOARD
Real-time panel showing the current model state:
Legend table (bottom left) explains histogram colors. Both panels toggle in Dashboard settings.
━━━━━━━━━━━━━━━━━━━━━━━━━━━━━━━━━━━━━━━
▸ SETTINGS
HMM Engine
Visualization
Alerts
Dashboard
━━━━━━━━━━━━━━━━━━━━━━━━━━━━━━━━━━━━━━━
▸ ALERTS
━━━━━━━━━━━━━━━━━━━━━━━━━━━━━━━━━━━━━━━
Best regards,
EXCAVO
The Market Regime Classifier applies a four-state Hidden Markov Model (HMM)
to classify the current market environment as Bullish, Bearish, Volatile, or Sideways.
Rather than using fixed thresholds on ADX or moving average slopes, the model maintains
and continuously updates a probability distribution across all four states on every bar,
producing smooth, low-noise regime identification.
This is not a threshold-based classifier. State probabilities update through Bayesian
forward inference, so regime transitions emerge from the data rather than arbitrary
cutoff values.
━━━━━━━━━━━━━━━━━━━━━━━━━━━━━━━━━━━━━━━
▸ HOW TO USE
Step 1 → Add the indicator to a new pane. The confidence histogram
appears immediately, colored by the current regime.
Step 2 → Read the regime from the histogram color and the dashboard
panel. Blue = Bullish, Red = Bearish, Orange = Volatile,
Gray = Sideways.
Step 3 → Monitor the confidence level. Above 80%, the model has high
conviction. Below 60%, the market is transitioning and both
adjacent states have similar probabilities.
Step 4 → Set up alerts for regime transitions. Each state change fires
on a closed bar only, eliminating repainting.
Step 5 → Check the dashboard for individual state probabilities. When
two states have close values, the market is ambiguous - this is
visible in the dashboard before a formal regime change occurs.
━━━━━━━━━━━━━━━━━━━━━━━━━━━━━━━━━━━━━━━
▸ HOW IT CALCULATES
◆ Data Conditioning
Each bar computes the log return: ln(close / close[1]). The mean and standard
deviation of log returns are calculated over the lookback period. Both are then
normalized: norm_ret = (log_ret - mean) / stdev, and norm_vol = stdev /
sma(stdev, lookback). This standardization makes the model asset-agnostic,
producing consistent behavior across equities, crypto, and forex without
requiring parameter adjustments per instrument.
◆ Gaussian Emission Likelihoods
Each of the four states has a Gaussian emission function that evaluates how
well the current normalized volatility and return match that state's expected
profile. The emission formula is exp(-(x - center)^2 / width), where x is the
normalized observation, center is the expected value for that state, and width
controls the response range:
- Bullish: norm_vol = 1.1, norm_ret = +0.8 (moderate volatility, positive drift)
- Bearish: norm_vol = 1.1, norm_ret = -0.8 (moderate volatility, negative drift)
- Sideways: norm_vol = 0.7, norm_ret = 0.0 (low volatility, no directional bias)
- Volatile: norm_vol = 1.6 x sensitivity (elevated volatility, direction-agnostic)
A state's emission is high when the current bar's profile closely matches its center
and decreases exponentially as the observation diverges.
◆ Bayesian Forward Update
The model maintains four state probabilities (p_bull, p_bear, p_side, p_vola)
initialized at 0.25 each. On every bar, unnormalized posteriors are computed:
un_state = emission(state) x (p_state x 0.9 + sum_others x 0.033). The 0.9
self-transition coefficient gives the model inertia - it stays in the current
state unless emissions consistently support a different one. The 0.033
cross-transition coefficient (approximately (1 - 0.9) / 3) keeps all states
reachable. Posteriors are then normalized to sum to 1.0. The smoothing factor
controls how aggressively each bar's emission result shifts the running
probability, acting as an exponential moving average over the posterior series.
◆ State Classification and Confidence
The active regime is the state with the highest posterior probability (argmax).
Confidence equals this maximum probability expressed as a percentage. A regime
change is detected when the dominant state changes on a confirmed (closed) bar,
which fires all alerts. The dashboard shows all four probabilities simultaneously,
making it possible to observe when the market is approaching a state boundary
before the formal regime label changes.
━━━━━━━━━━━━━━━━━━━━━━━━━━━━━━━━━━━━━━━
▸ WHAT MAKES IT DIFFERENT
◆ Probabilistic State Engine
Most regime classifiers use fixed thresholds: if ADX > 25 then trending, otherwise
ranging. This produces abrupt, oscillating switches at the boundary and gives no
information about conviction. The HMM produces a smooth probability distribution
across all four states simultaneously, with conviction visible at every bar as
an explicit confidence percentage.
◆ Four-State Classification
Two-state models (trending vs. ranging) conflate Volatile markets with trending ones
and miss the distinction between low-activity consolidation and trend exhaustion.
Four states allow separate identification of sustained directional moves
(Bullish/Bearish), low-activity accumulation ranges (Sideways), and high-volatility
uncertainty (Volatile) - conditions that require different position sizing and
strategy selection.
◆ Adaptive Volatility Threshold
The Volatile state's emission center scales with the Volatility Sensitivity input.
This makes the model configurable across asset classes: crypto spends more time at
elevated volatility levels and may benefit from a higher sensitivity value than
equities or forex.
◆ Transition Memory (Inertia)
The self-transition coefficient (0.9) gives the model inertia - a single anomalous
bar cannot flip the regime. The classifier requires consistent evidence across
multiple bars to overcome the self-transition bias. This reduces false transitions
during brief volatility spikes or one-bar outliers.
━━━━━━━━━━━━━━━━━━━━━━━━━━━━━━━━━━━━━━━
▸ DASHBOARD
Real-time panel showing the current model state:
- Regime - active state (BULLISH / BEARISH / VOLATILE / SIDEWAYS), colored by type
- Confidence - highest state probability as a percentage; highlighted orange above 80%
- Bullish - current Bullish state probability
- Bearish - current Bearish state probability
- Volatile - current Volatile state probability
- Sideways - current Sideways state probability
- Norm Volatility - normalized volatility ratio; highlighted orange above 1.5 x sensitivity
- Smoothing - active smoothing factor (informational)
Legend table (bottom left) explains histogram colors. Both panels toggle in Dashboard settings.
━━━━━━━━━━━━━━━━━━━━━━━━━━━━━━━━━━━━━━━
▸ SETTINGS
HMM Engine
- Statistical Lookback - 50 bars (period for log-return mean and stdev; higher = more stable but slower to adapt)
- Decision Smoothing - 0.40 (exponential smoothing factor; lower = more stable, higher = more reactive)
- Volatility Sensitivity - 1.2 (scales the Volatile state emission center; increase for crypto, decrease for equities)
Visualization
- Bullish Color - default blue (histogram and ribbon color during Bullish regime)
- Bearish Color - default red (histogram and ribbon color during Bearish regime)
- Volatile Color - default orange (histogram and ribbon color during Volatile regime)
- Show Regime Ribbon - OFF (colored markers at pane bottom showing regime history)
- Background Highlight - ON (subtle tint matching the active regime)
Alerts
- JSON Alerts - OFF (enable for bot integration via 3Commas, Wunderbit, etc.)
Dashboard
- Dashboard Position - Top Right
- Show Dashboard - ON
- Show Legend - ON
━━━━━━━━━━━━━━━━━━━━━━━━━━━━━━━━━━━━━━━
▸ ALERTS
- Bullish Regime - dominant state changed to Bullish on bar close
- Bearish Regime - dominant state changed to Bearish on bar close
- Volatile Regime - dominant state changed to Volatile on bar close
- Sideways Regime - dominant state changed to Sideways on bar close
- Regime Change - any state transition detected on bar close
━━━━━━━━━━━━━━━━━━━━━━━━━━━━━━━━━━━━━━━
Best regards,
EXCAVO
Disclaimer
Trading involves significant risk. This indicator is a technical analysis tool
and does not constitute financial advice, investment recommendations, or a
guarantee of future results. Past indicator behavior does not guarantee future
performance. Always use proper risk management and your own judgment.
Скрипт с открытым кодом
В истинном духе TradingView, создатель этого скрипта сделал его открытым исходным кодом, чтобы трейдеры могли проверить и убедиться в его функциональности. Браво автору! Вы можете использовать его бесплатно, но помните, что перепубликация кода подчиняется нашим Правилам поведения.

Show your skill pnl.world/auth?ref=90144806
Crypto ex bitunix.com/register?vipCode=Ri1J7239
Portfolio excavo.com/stocks
Tg t.me/excavo
t.me/EXCAVOREFF_bot
trading-tournaments.com/
Crypto ex bitunix.com/register?vipCode=Ri1J7239
Portfolio excavo.com/stocks
Tg t.me/excavo
t.me/EXCAVOREFF_bot
trading-tournaments.com/
Отказ от ответственности
Информация и публикации не предназначены для предоставления и не являются финансовыми, инвестиционными, торговыми или другими видами советов или рекомендаций, предоставленных или одобренных TradingView. Подробнее читайте в Условиях использования.
Скрипт с открытым кодом
В истинном духе TradingView, создатель этого скрипта сделал его открытым исходным кодом, чтобы трейдеры могли проверить и убедиться в его функциональности. Браво автору! Вы можете использовать его бесплатно, но помните, что перепубликация кода подчиняется нашим Правилам поведения.
Show your skill pnl.world/auth?ref=90144806
Crypto ex bitunix.com/register?vipCode=Ri1J7239
Portfolio excavo.com/stocks
Tg t.me/excavo
t.me/EXCAVOREFF_bot
trading-tournaments.com/
Crypto ex bitunix.com/register?vipCode=Ri1J7239
Portfolio excavo.com/stocks
Tg t.me/excavo
t.me/EXCAVOREFF_bot
trading-tournaments.com/
Отказ от ответственности
Информация и публикации не предназначены для предоставления и не являются финансовыми, инвестиционными, торговыми или другими видами советов или рекомендаций, предоставленных или одобренных TradingView. Подробнее читайте в Условиях использования.