OPEN-SOURCE SCRIPT
Hourly Candle Open Tracker (R2F)
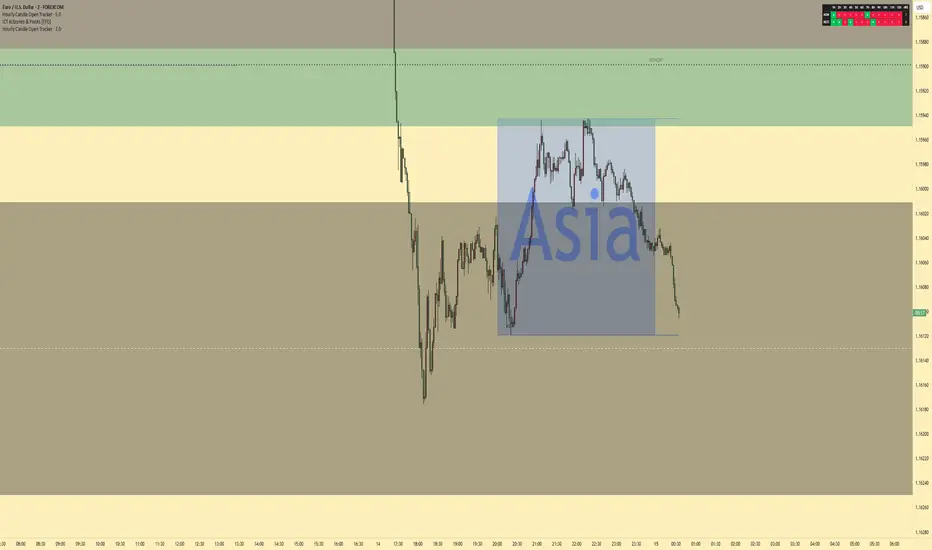
Hourly Candle Start & Formation Tracker
This indicator is designed to help traders clearly identify which hourly candle has started during the current hour, as well as which hourly candle is forming for the next hour.
The tool tracks hourly candle cycles from Hour 1 through Hour 12, making it easier to follow time-based market structure, session rhythm, and candle sequencing directly on your chart.
It provides a simple visual reference for traders who use hourly candle timing as part of their strategy, whether for entries, exits, confirmations, or observing how price behaves as each hourly candle opens and develops.
Key Features
Identifies the current hourly candle that has started
Shows which hourly candle is forming next
Covers hourly cycles from 1 to 12
Helps improve awareness of candle timing and session flow
Useful for intraday traders, scalpers, and time-based strategies
Clean and easy-to-read display directly on the chart
How It Can Be Used
This indicator can help traders stay aligned with hourly candle changes and prepare for the next candle formation before it begins. It may be useful for traders who watch specific hourly candles for volatility, reversals, continuation moves, liquidity grabs, or session-based setups.
Disclaimer
This indicator is intended for informational and educational purposes only. It does not provide buy or sell signals and should not be used as financial advice. Always combine it with your own analysis, risk management, and trading plan.
This indicator is designed to help traders clearly identify which hourly candle has started during the current hour, as well as which hourly candle is forming for the next hour.
The tool tracks hourly candle cycles from Hour 1 through Hour 12, making it easier to follow time-based market structure, session rhythm, and candle sequencing directly on your chart.
It provides a simple visual reference for traders who use hourly candle timing as part of their strategy, whether for entries, exits, confirmations, or observing how price behaves as each hourly candle opens and develops.
Key Features
Identifies the current hourly candle that has started
Shows which hourly candle is forming next
Covers hourly cycles from 1 to 12
Helps improve awareness of candle timing and session flow
Useful for intraday traders, scalpers, and time-based strategies
Clean and easy-to-read display directly on the chart
How It Can Be Used
This indicator can help traders stay aligned with hourly candle changes and prepare for the next candle formation before it begins. It may be useful for traders who watch specific hourly candles for volatility, reversals, continuation moves, liquidity grabs, or session-based setups.
Disclaimer
This indicator is intended for informational and educational purposes only. It does not provide buy or sell signals and should not be used as financial advice. Always combine it with your own analysis, risk management, and trading plan.
Скрипт с открытым кодом
В истинном духе TradingView, создатель этого скрипта сделал его открытым исходным кодом, чтобы трейдеры могли проверить и убедиться в его функциональности. Браво автору! Вы можете использовать его бесплатно, но помните, что перепубликация кода подчиняется нашим Правилам поведения.

Отказ от ответственности
Информация и публикации не предназначены для предоставления и не являются финансовыми, инвестиционными, торговыми или другими видами советов или рекомендаций, предоставленных или одобренных TradingView. Подробнее читайте в Условиях использования.
Скрипт с открытым кодом
В истинном духе TradingView, создатель этого скрипта сделал его открытым исходным кодом, чтобы трейдеры могли проверить и убедиться в его функциональности. Браво автору! Вы можете использовать его бесплатно, но помните, что перепубликация кода подчиняется нашим Правилам поведения.
Отказ от ответственности
Информация и публикации не предназначены для предоставления и не являются финансовыми, инвестиционными, торговыми или другими видами советов или рекомендаций, предоставленных или одобренных TradingView. Подробнее читайте в Условиях использования.