OPEN-SOURCE SCRIPT
Quarterly Earnings
Here's a ready-to-paste TradingView publication description:
---
**Quarterly Earnings Dashboard**
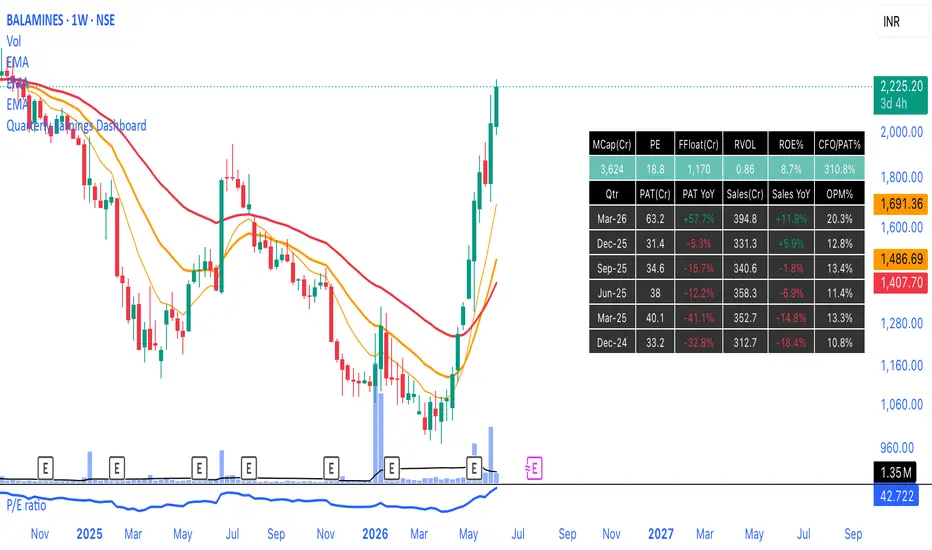
A clean on-chart table that puts a stock's key fundamentals next to its price action — built for fundamentals-aware swing/position traders who want valuation, quality, and earnings trend in one glance without leaving the chart.
**Current snapshot (top row)**
- **MCap (Cr)** — market capitalisation
- **PE** — price-to-earnings
- **FFloat (Cr)** — free-float market cap (MCap × float shares ÷ total shares)
- **RVOL** — relative volume vs the N-bar average (configurable), to spot unusual activity
- **ROE%** — return on equity
- **CFO/PAT%** — cash conversion: operating cash flow ÷ profit after tax. ~100%+ signals profits backed by real cash; persistently low is a quality red flag.
**Quarterly earnings table**
For the last N reported quarters: **PAT (Cr)**, **PAT YoY%**, **Sales (Cr)**, **Sales YoY%**, and **OPM%**. YoY columns are colour-coded green/red so accelerating or decelerating earnings jump out.
**Inputs**
- Quarters to show (1–16)
- Reporting period (FQ / FY / TTM)
- RVOL length
- Table position and colours
**Notes**
- All data is pulled from TradingView's built-in fundamentals via `request.financial()`. Best used on a single stock's weekly or daily chart.
- Some IDs (free float, cash flow) aren't published on the quarterly feed for every market, so the snapshot falls back FQ → FY → TTM. If a cell still reads "n/a", TradingView simply doesn't carry that data for the symbol.
- RVOL is relative to the chart timeframe — on a weekly chart it's volume vs the 20-week average.
Not financial advice; for research and educational use.
---
---
**Quarterly Earnings Dashboard**
A clean on-chart table that puts a stock's key fundamentals next to its price action — built for fundamentals-aware swing/position traders who want valuation, quality, and earnings trend in one glance without leaving the chart.
**Current snapshot (top row)**
- **MCap (Cr)** — market capitalisation
- **PE** — price-to-earnings
- **FFloat (Cr)** — free-float market cap (MCap × float shares ÷ total shares)
- **RVOL** — relative volume vs the N-bar average (configurable), to spot unusual activity
- **ROE%** — return on equity
- **CFO/PAT%** — cash conversion: operating cash flow ÷ profit after tax. ~100%+ signals profits backed by real cash; persistently low is a quality red flag.
**Quarterly earnings table**
For the last N reported quarters: **PAT (Cr)**, **PAT YoY%**, **Sales (Cr)**, **Sales YoY%**, and **OPM%**. YoY columns are colour-coded green/red so accelerating or decelerating earnings jump out.
**Inputs**
- Quarters to show (1–16)
- Reporting period (FQ / FY / TTM)
- RVOL length
- Table position and colours
**Notes**
- All data is pulled from TradingView's built-in fundamentals via `request.financial()`. Best used on a single stock's weekly or daily chart.
- Some IDs (free float, cash flow) aren't published on the quarterly feed for every market, so the snapshot falls back FQ → FY → TTM. If a cell still reads "n/a", TradingView simply doesn't carry that data for the symbol.
- RVOL is relative to the chart timeframe — on a weekly chart it's volume vs the 20-week average.
Not financial advice; for research and educational use.
---
Скрипт с открытым кодом
В истинном духе TradingView, создатель этого скрипта сделал его открытым исходным кодом, чтобы трейдеры могли проверить и убедиться в его функциональности. Браво автору! Вы можете использовать его бесплатно, но помните, что перепубликация кода подчиняется нашим Правилам поведения.

Отказ от ответственности
Информация и публикации не предназначены для предоставления и не являются финансовыми, инвестиционными, торговыми или другими видами советов или рекомендаций, предоставленных или одобренных TradingView. Подробнее читайте в Условиях использования.
Скрипт с открытым кодом
В истинном духе TradingView, создатель этого скрипта сделал его открытым исходным кодом, чтобы трейдеры могли проверить и убедиться в его функциональности. Браво автору! Вы можете использовать его бесплатно, но помните, что перепубликация кода подчиняется нашим Правилам поведения.
Отказ от ответственности
Информация и публикации не предназначены для предоставления и не являются финансовыми, инвестиционными, торговыми или другими видами советов или рекомендаций, предоставленных или одобренных TradingView. Подробнее читайте в Условиях использования.