Median Deviation Anchor | TR
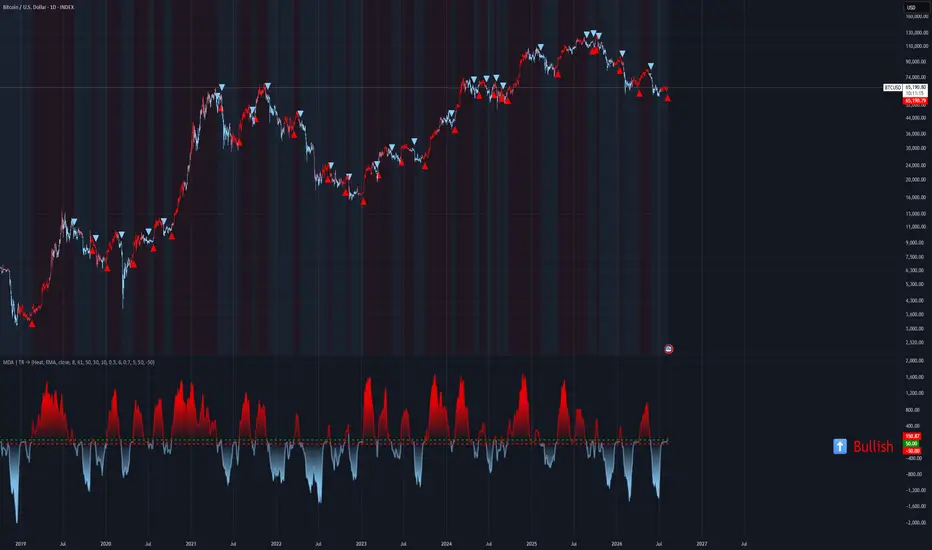
🎯 Overview
Median Deviation Anchor | TR is a trend‑detection oscillator that uses a percentile‑based median of a chosen moving average as its central anchor. It measures price deviation relative to this median, scaled by ATR bands and standard deviation zones, to generate bullish/bearish signals. The oscillator is smoothed, normalized, and presented with rich visual feedback including gradient candles, dynamic fills, reversal markers, and a persistent trend table. It’s designed to capture trend strength and reversals with a robust statistical foundation.
⚙️ Core Calculations
1. Moving Average Baseline
The indicator first computes a moving average of the Source (default close) using one of 13 moving average types (EMA, SMA, RMA, WMA, VWMA, HMA, DEMA, TEMA, TRIMA, FRAMA, SWMA, ALMA, T3).
User‑adjustable: Length (default 8), Factor/Sigma for ALMA/T3.
2. Median Anchor
Median_Val = ta.percentile_nearest_rank(MA, Median_Length, Median_per)
– This returns the value at the given percentile (default 50ᵗʰ percentile, i.e., the median) of the MA over Median_Length (default 61) bars.
→ This median acts as the dynamic “center” of the trend.
3. Deviation Bands (Upper/Lower Anchors)
ATR Band (based on ta.atr(ATR_Length)):
Upper_ATR = Median_Val + ATR_Mult * ATR
Lower_ATR = Median_Val - ATR_Mult * ATR
Standard Deviation Band (based on ta.stdev(Median_Val, Length_SD)):
SD_L = Median_Val + ST_Dev (upper +1σ)
SD_S = Median_Val - ST_Dev (lower -1σ)
4. Raw Oscillator (rawOsc)
Two conditions decide the raw value:
Bullish condition (L_Bull_MDA): (Source > Lower_ATR) and (Source >= SD_L)
Then bullForce = (Source - Median_Val) / (Median_Val - Lower_ATR) * 100
→ positive values (0 to +∞)
Bearish condition (S_Bear_MDA): (Source < Upper_ATR) and (Source <= SD_S)
Then bearForce = (Source - Median_Val) / (Upper_ATR - Median_Val) * 100
→ negative values (0 to –∞)
Otherwise rawOsc = 0.
5. Smoothing & Clamping
oscValue = ta.ema(rawOsc, smoothOsc) (user‑defined smoothOsc length, default 5).
osc = math.min(math.max(oscValue, -2000), 2000) – clamps extreme values.
📊 Normalisation & Dynamic Styling
Momentum for Fill Transparency:
absOsc = math.abs(osc) → maxAbsOsc = ta.highest(absOsc, 50) → normalised normAbsOsc → Fill_Transp_OSC = int(math.max(0, math.min(100, 35 - (normAbsOsc * 25))))
→ higher oscillator magnitude ⇒ less transparency (more vivid fills).
Gradient Coloring for Candles:
oscNorm is re‑scaled over the last 50 bars to [0,1] → candle color interpolates between DnC (bearish) and UpC (bullish) using color.from_gradient.
Color Themes: 9 predefined schemes (Classic, Modern, Heat, Robust, Accented, Monochrome, Moderate, Aqua, Cosmic) with custom bullish/bearish colours.
📈 Signal System
1. Trend Determination (Trend_MDA)
Bullish when osc > Upper_Band (user‑defined Long Threshold, default 50). Sets Trend_MDA = 1.
Bearish when osc < Lower_Band (user‑defined Short Threshold, default -50). Sets Trend_MDA = -1.
Otherwise holds previous value.
2. Reversal Signals (plot as triangles)
Bullish Reversal (reversalBull): Trend_MDA == 1 and Trend_MDA[1] == -1 → green triangle below bar.
Bearish Reversal (reversalBear): Trend_MDA == -1 and Trend_MDA[1] == 1 → red triangle above bar.
3. Alerts (4 conditions)
Bullish MDA – triggered when isBull_MDA (osc > Upper_Band)
Bearish MDA – triggered when isBear_MDA (osc < Lower_Band)
Bullish Cross – ta.crossover(osc, 0)
Bearish Cross – ta.crossunder(osc, 0)
🎨 Visual Features
Trend Table Displays “⬆️ Bullish” or “⬇️ Bearish” (or “➖ Neutral”)
📖 Interpretation Guide
Positive values (osc > 0) indicate price is above the median anchor (bullish bias).
Negative values (osc < 0) indicate price below the median (bearish bias).
Crossing ±50 (default thresholds) signals a confirmed trend change (bullish >50, bearish < -50).
Crossing zero may be used as an early warning of trend shift (alerts available).
Reversal triangles appear when the oscillator crosses a threshold in the opposite direction after being in the other regime – these are potential entry/exit signals.
The dynamic fill transparency highlights momentum: intense colour = strong price deviation.
🚨 Alert Summary
Four alert conditions are ready for automation:
Bullish MDA – enters long zone (osc > Upper_Band)
Bearish MDA – enters short zone (osc < Lower_Band)
Bullish Cross – oscillator crosses above zero
Bearish Cross – oscillator crosses below zero
All alerts can be enabled via the TradingView alerts panel.
Median Deviation Anchor | TR is a trend‑detection oscillator that uses a percentile‑based median of a chosen moving average as its central anchor. It measures price deviation relative to this median, scaled by ATR bands and standard deviation zones, to generate bullish/bearish signals. The oscillator is smoothed, normalized, and presented with rich visual feedback including gradient candles, dynamic fills, reversal markers, and a persistent trend table. It’s designed to capture trend strength and reversals with a robust statistical foundation.
⚙️ Core Calculations
1. Moving Average Baseline
The indicator first computes a moving average of the Source (default close) using one of 13 moving average types (EMA, SMA, RMA, WMA, VWMA, HMA, DEMA, TEMA, TRIMA, FRAMA, SWMA, ALMA, T3).
User‑adjustable: Length (default 8), Factor/Sigma for ALMA/T3.
2. Median Anchor
Median_Val = ta.percentile_nearest_rank(MA, Median_Length, Median_per)
– This returns the value at the given percentile (default 50ᵗʰ percentile, i.e., the median) of the MA over Median_Length (default 61) bars.
→ This median acts as the dynamic “center” of the trend.
3. Deviation Bands (Upper/Lower Anchors)
ATR Band (based on ta.atr(ATR_Length)):
Upper_ATR = Median_Val + ATR_Mult * ATR
Lower_ATR = Median_Val - ATR_Mult * ATR
Standard Deviation Band (based on ta.stdev(Median_Val, Length_SD)):
SD_L = Median_Val + ST_Dev (upper +1σ)
SD_S = Median_Val - ST_Dev (lower -1σ)
4. Raw Oscillator (rawOsc)
Two conditions decide the raw value:
Bullish condition (L_Bull_MDA): (Source > Lower_ATR) and (Source >= SD_L)
Then bullForce = (Source - Median_Val) / (Median_Val - Lower_ATR) * 100
→ positive values (0 to +∞)
Bearish condition (S_Bear_MDA): (Source < Upper_ATR) and (Source <= SD_S)
Then bearForce = (Source - Median_Val) / (Upper_ATR - Median_Val) * 100
→ negative values (0 to –∞)
Otherwise rawOsc = 0.
5. Smoothing & Clamping
oscValue = ta.ema(rawOsc, smoothOsc) (user‑defined smoothOsc length, default 5).
osc = math.min(math.max(oscValue, -2000), 2000) – clamps extreme values.
📊 Normalisation & Dynamic Styling
Momentum for Fill Transparency:
absOsc = math.abs(osc) → maxAbsOsc = ta.highest(absOsc, 50) → normalised normAbsOsc → Fill_Transp_OSC = int(math.max(0, math.min(100, 35 - (normAbsOsc * 25))))
→ higher oscillator magnitude ⇒ less transparency (more vivid fills).
Gradient Coloring for Candles:
oscNorm is re‑scaled over the last 50 bars to [0,1] → candle color interpolates between DnC (bearish) and UpC (bullish) using color.from_gradient.
Color Themes: 9 predefined schemes (Classic, Modern, Heat, Robust, Accented, Monochrome, Moderate, Aqua, Cosmic) with custom bullish/bearish colours.
📈 Signal System
1. Trend Determination (Trend_MDA)
Bullish when osc > Upper_Band (user‑defined Long Threshold, default 50). Sets Trend_MDA = 1.
Bearish when osc < Lower_Band (user‑defined Short Threshold, default -50). Sets Trend_MDA = -1.
Otherwise holds previous value.
2. Reversal Signals (plot as triangles)
Bullish Reversal (reversalBull): Trend_MDA == 1 and Trend_MDA[1] == -1 → green triangle below bar.
Bearish Reversal (reversalBear): Trend_MDA == -1 and Trend_MDA[1] == 1 → red triangle above bar.
3. Alerts (4 conditions)
Bullish MDA – triggered when isBull_MDA (osc > Upper_Band)
Bearish MDA – triggered when isBear_MDA (osc < Lower_Band)
Bullish Cross – ta.crossover(osc, 0)
Bearish Cross – ta.crossunder(osc, 0)
🎨 Visual Features
Trend Table Displays “⬆️ Bullish” or “⬇️ Bearish” (or “➖ Neutral”)
📖 Interpretation Guide
Positive values (osc > 0) indicate price is above the median anchor (bullish bias).
Negative values (osc < 0) indicate price below the median (bearish bias).
Crossing ±50 (default thresholds) signals a confirmed trend change (bullish >50, bearish < -50).
Crossing zero may be used as an early warning of trend shift (alerts available).
Reversal triangles appear when the oscillator crosses a threshold in the opposite direction after being in the other regime – these are potential entry/exit signals.
The dynamic fill transparency highlights momentum: intense colour = strong price deviation.
🚨 Alert Summary
Four alert conditions are ready for automation:
Bullish MDA – enters long zone (osc > Upper_Band)
Bearish MDA – enters short zone (osc < Lower_Band)
Bullish Cross – oscillator crosses above zero
Bearish Cross – oscillator crosses below zero
All alerts can be enabled via the TradingView alerts panel.

Отказ от ответственности
Информация и публикации не предназначены для предоставления и не являются финансовыми, инвестиционными, торговыми или другими видами советов или рекомендаций, предоставленных или одобренных TradingView. Подробнее читайте в Условиях использования.
Отказ от ответственности
Информация и публикации не предназначены для предоставления и не являются финансовыми, инвестиционными, торговыми или другими видами советов или рекомендаций, предоставленных или одобренных TradingView. Подробнее читайте в Условиях использования.