AL Brooks Open Bars Theory ( 12 Bars 5MIN ) NY Session Breakout
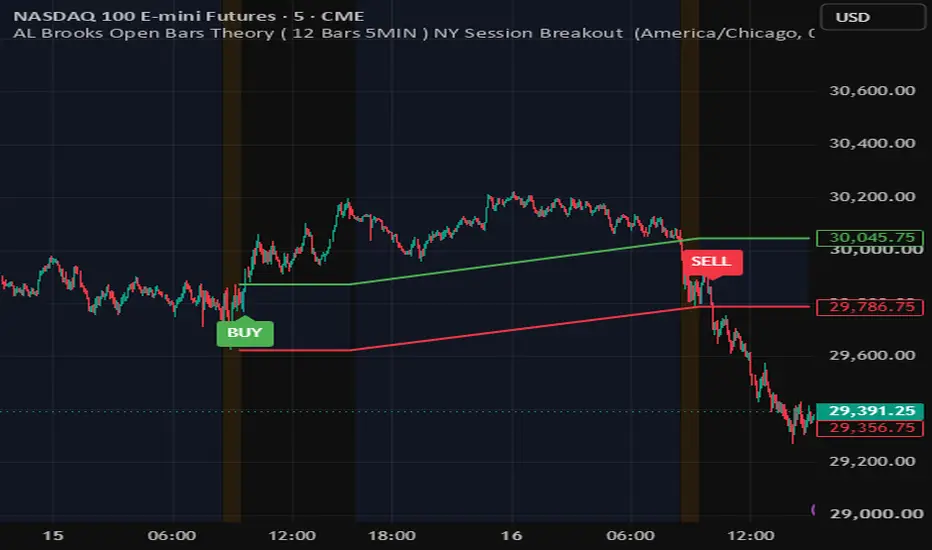
AL BROOKS OPENING BARS THEORY: NY SESSION BREAKOUT
WHERE THIS COMES FROM
Al Brooks, the price action author and educator, teaches that the first bars of the day on a 5-minute chart set the high or low of the day with surprising reliability. Early in the session the market is still choosing its range, so each completed bar makes it more likely that one extreme of the day is already in. He presented this in his “Trading the Open” webinar for futures.io on October 17, 2017, and in his Trading the Open video series.
BROOKS’ PUBLISHED NUMBERS (5-MINUTE BARS)
Each number is the chance that the day’s high or low has already formed by that bar.
Bar 1: about 20 to 25 percent.
Bar 7: about 50 percent.
Bar 12, the end of the first hour: about 70 percent.
Bar 18: about 90 percent.
Bar 80, the last bar of his session: 99.9 percent.
His related findings on the open:
After a breakout of the 18-bar range, especially one of more than 2 ticks, there is a 70 to 80 percent chance the market will not reach the opposite extreme.
When the 18-bar range is very small, a failed breakout followed by an opposite breakout becomes more likely.
About 50 percent of strong moves on the open fail and reverse.
WHAT THIS INDICATOR DOES
It measures the opening range exactly as Brooks frames it, on 5-minute bars, from the 8:30 AM Central open.
Counts the first 12 five-minute bars from the open (adjustable, 18 for the classic Brooks range).
Locks the high and low of that range when the final bar completes.
Draws the high in green, the low in red, with a shaded zone between them.
Fires a BUY label on the first break above the high and a SELL label on the first break below the low.
Tints the chart orange while the range is still forming.
Built-in 5-minute engine: the bar counting, range, lock, and first breakout always run on 5-minute data, whatever chart timeframe is open. Switch to a 1-minute chart and the range stays identical. On charts below 5 minutes the signal prints on the exact chart bar that breaks the range.
HOW TO USE IT
Use it as a map of where the day’s range is most likely already set. The levels go live when the range locks. A break above or below marks the first expansion out of the opening range. Combine it with your own read of context, such as trend, gaps, and the size of the range relative to recent days, since Brooks notes that very small ranges behave differently.
SETTINGS
Session Time Zone: default America/Chicago.
RTH Session Window: default 0830-1500, Monday to Friday.
Opening Range Bar Count: default 12 (70 percent mark). Set to 18 for the 90 percent mark.
High color, low color, and range fill color.
ALERTS
Two alert conditions are included, one for the high breakout (BUY) and one for the low breakout (SELL), for webhooks or notifications. If you change the settings or the script, delete and recreate your alerts so they use the current version.
NOTES
Built for NQ and futures sessions, and works on any symbol that trades the set session window.
Not affiliated with or endorsed by Al Brooks. Credit for the opening-bars concept belongs to him.
This is an analytical tool, not financial advice. Past behavior of opening ranges does not guarantee future results. Test on your own instrument and timeframe before trading real capital.
WHERE THIS COMES FROM
Al Brooks, the price action author and educator, teaches that the first bars of the day on a 5-minute chart set the high or low of the day with surprising reliability. Early in the session the market is still choosing its range, so each completed bar makes it more likely that one extreme of the day is already in. He presented this in his “Trading the Open” webinar for futures.io on October 17, 2017, and in his Trading the Open video series.
BROOKS’ PUBLISHED NUMBERS (5-MINUTE BARS)
Each number is the chance that the day’s high or low has already formed by that bar.
Bar 1: about 20 to 25 percent.
Bar 7: about 50 percent.
Bar 12, the end of the first hour: about 70 percent.
Bar 18: about 90 percent.
Bar 80, the last bar of his session: 99.9 percent.
His related findings on the open:
After a breakout of the 18-bar range, especially one of more than 2 ticks, there is a 70 to 80 percent chance the market will not reach the opposite extreme.
When the 18-bar range is very small, a failed breakout followed by an opposite breakout becomes more likely.
About 50 percent of strong moves on the open fail and reverse.
WHAT THIS INDICATOR DOES
It measures the opening range exactly as Brooks frames it, on 5-minute bars, from the 8:30 AM Central open.
Counts the first 12 five-minute bars from the open (adjustable, 18 for the classic Brooks range).
Locks the high and low of that range when the final bar completes.
Draws the high in green, the low in red, with a shaded zone between them.
Fires a BUY label on the first break above the high and a SELL label on the first break below the low.
Tints the chart orange while the range is still forming.
Built-in 5-minute engine: the bar counting, range, lock, and first breakout always run on 5-minute data, whatever chart timeframe is open. Switch to a 1-minute chart and the range stays identical. On charts below 5 minutes the signal prints on the exact chart bar that breaks the range.
HOW TO USE IT
Use it as a map of where the day’s range is most likely already set. The levels go live when the range locks. A break above or below marks the first expansion out of the opening range. Combine it with your own read of context, such as trend, gaps, and the size of the range relative to recent days, since Brooks notes that very small ranges behave differently.
SETTINGS
Session Time Zone: default America/Chicago.
RTH Session Window: default 0830-1500, Monday to Friday.
Opening Range Bar Count: default 12 (70 percent mark). Set to 18 for the 90 percent mark.
High color, low color, and range fill color.
ALERTS
Two alert conditions are included, one for the high breakout (BUY) and one for the low breakout (SELL), for webhooks or notifications. If you change the settings or the script, delete and recreate your alerts so they use the current version.
NOTES
Built for NQ and futures sessions, and works on any symbol that trades the set session window.
Not affiliated with or endorsed by Al Brooks. Credit for the opening-bars concept belongs to him.
This is an analytical tool, not financial advice. Past behavior of opening ranges does not guarantee future results. Test on your own instrument and timeframe before trading real capital.

Отказ от ответственности
Информация и публикации не предназначены для предоставления и не являются финансовыми, инвестиционными, торговыми или другими видами советов или рекомендаций, предоставленных или одобренных TradingView. Подробнее читайте в Условиях использования.
Отказ от ответственности
Информация и публикации не предназначены для предоставления и не являются финансовыми, инвестиционными, торговыми или другими видами советов или рекомендаций, предоставленных или одобренных TradingView. Подробнее читайте в Условиях использования.