Adaptive Moving Average ATR Bands [NJ]
✧ OVERVIEW ✧
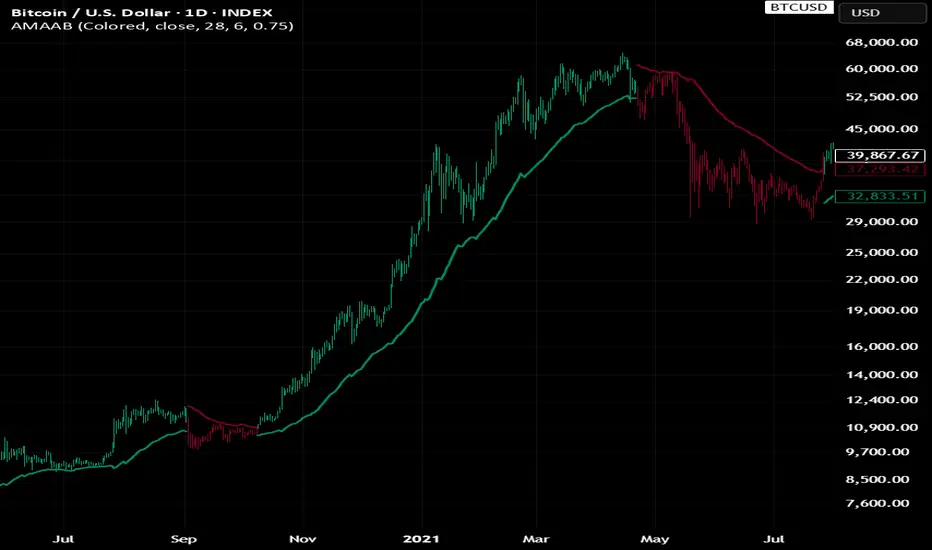
Adaptive Moving Average ATR Bands is a volatility-based, trend-following indicator that builds ATR bands around three different moving averages and combines them into a single outer envelope.
SMA, RMA and LSMA are calculated from the same source and length. Each moving average receives its own ATR bands, and the highest upper band and lowest lower band are used as the final bands.
Since the three moving averages react to price at different speeds, the envelope adapts its width to the distance between them, requiring a stronger move before the active condition changes.

✧ SETTINGS ✧
Color Mode
Switches between colored and neutral visualization.
Color Candles
Shows or hides candle coloring based on the current signal.
MA Source
Selects the price source used for the moving average calculations.
MA Length
Controls how many bars are used to calculate all three moving averages.
ATR Length
Controls how many bars are used to calculate the ATR.
ATR Multiplier
Controls how far the ATR bands are placed from each moving average.
✧ HOW IT WORKS ✧
Moving Averages
Indicator calculates three moving averages from selected source over the same MA Length.
Simple Moving Average (SMA) gives equal weight to all values in the lookback period.
Wilder's Moving Average (RMA) applies exponential smoothing and reacts more slowly to new prices.
Least Squares Moving Average (LSMA) uses the endpoint of a linear regression line and closely follows recent price direction.
ATR Bands
ATR measures recent market volatility. Each moving average receives its own pair of bands.
Upper Band = Moving Average + ATR × ATR Multiplier
Lower Band = Moving Average − ATR × ATR Multiplier
Outer Envelope
Highest of the three upper bands is used as final upper band. Lowest of the three lower bands is used as final lower band.
When the moving averages spread apart, the envelope widens. When they converge, the envelope narrows toward a single ATR band.
Signal Logic
A bullish condition is activated when price closes above the final upper band.
A bearish condition is activated when price closes below the final lower band.
Active condition remains unchanged until the opposite condition occurs.
✧ VISUALIZATION ✧
Green represents a bullish condition.
Red represents a bearish condition.
Neutral mode displays the same conditions using light and dark shades.
During a bullish condition, lower band is displayed in green.
During a bearish condition, upper band is displayed in red.
Same signal colors can optionally be applied directly to the chart candles.
✧ USAGE ✧
Adaptive Moving Average ATR Bands can be used to identify:
Bullish and bearish trend conditions
Volatility-adjusted price breakouts
Dynamic trend support and resistance
Directional market bias
Trend confirmation
Additional confirmation for other technical analysis
Combining three moving averages with different responsiveness is designed to filter minor price moves that would cross bands built around a single moving average.
As with any technical indicator, it is best used alongside other forms of analysis rather than as a standalone entry or exit signal.
Adaptive Moving Average ATR Bands is a volatility-based, trend-following indicator that builds ATR bands around three different moving averages and combines them into a single outer envelope.
SMA, RMA and LSMA are calculated from the same source and length. Each moving average receives its own ATR bands, and the highest upper band and lowest lower band are used as the final bands.
Since the three moving averages react to price at different speeds, the envelope adapts its width to the distance between them, requiring a stronger move before the active condition changes.
✧ SETTINGS ✧
Color Mode
Switches between colored and neutral visualization.
Color Candles
Shows or hides candle coloring based on the current signal.
MA Source
Selects the price source used for the moving average calculations.
MA Length
Controls how many bars are used to calculate all three moving averages.
ATR Length
Controls how many bars are used to calculate the ATR.
ATR Multiplier
Controls how far the ATR bands are placed from each moving average.
✧ HOW IT WORKS ✧
Moving Averages
Indicator calculates three moving averages from selected source over the same MA Length.
Simple Moving Average (SMA) gives equal weight to all values in the lookback period.
Wilder's Moving Average (RMA) applies exponential smoothing and reacts more slowly to new prices.
Least Squares Moving Average (LSMA) uses the endpoint of a linear regression line and closely follows recent price direction.
ATR Bands
ATR measures recent market volatility. Each moving average receives its own pair of bands.
Upper Band = Moving Average + ATR × ATR Multiplier
Lower Band = Moving Average − ATR × ATR Multiplier
Outer Envelope
Highest of the three upper bands is used as final upper band. Lowest of the three lower bands is used as final lower band.
When the moving averages spread apart, the envelope widens. When they converge, the envelope narrows toward a single ATR band.
Signal Logic
A bullish condition is activated when price closes above the final upper band.
A bearish condition is activated when price closes below the final lower band.
Active condition remains unchanged until the opposite condition occurs.
✧ VISUALIZATION ✧
Green represents a bullish condition.
Red represents a bearish condition.
Neutral mode displays the same conditions using light and dark shades.
During a bullish condition, lower band is displayed in green.
During a bearish condition, upper band is displayed in red.
Same signal colors can optionally be applied directly to the chart candles.
✧ USAGE ✧
Adaptive Moving Average ATR Bands can be used to identify:
Bullish and bearish trend conditions
Volatility-adjusted price breakouts
Dynamic trend support and resistance
Directional market bias
Trend confirmation
Additional confirmation for other technical analysis
Combining three moving averages with different responsiveness is designed to filter minor price moves that would cross bands built around a single moving average.
As with any technical indicator, it is best used alongside other forms of analysis rather than as a standalone entry or exit signal.

Отказ от ответственности
Информация и публикации не предназначены для предоставления и не являются финансовыми, инвестиционными, торговыми или другими видами советов или рекомендаций, предоставленных или одобренных TradingView. Подробнее читайте в Условиях использования.
Отказ от ответственности
Информация и публикации не предназначены для предоставления и не являются финансовыми, инвестиционными, торговыми или другими видами советов или рекомендаций, предоставленных или одобренных TradingView. Подробнее читайте в Условиях использования.