OPEN-SOURCE SCRIPT
Обновлено 4-Yr Cycle Monthly Returns [R2D2]
Overview
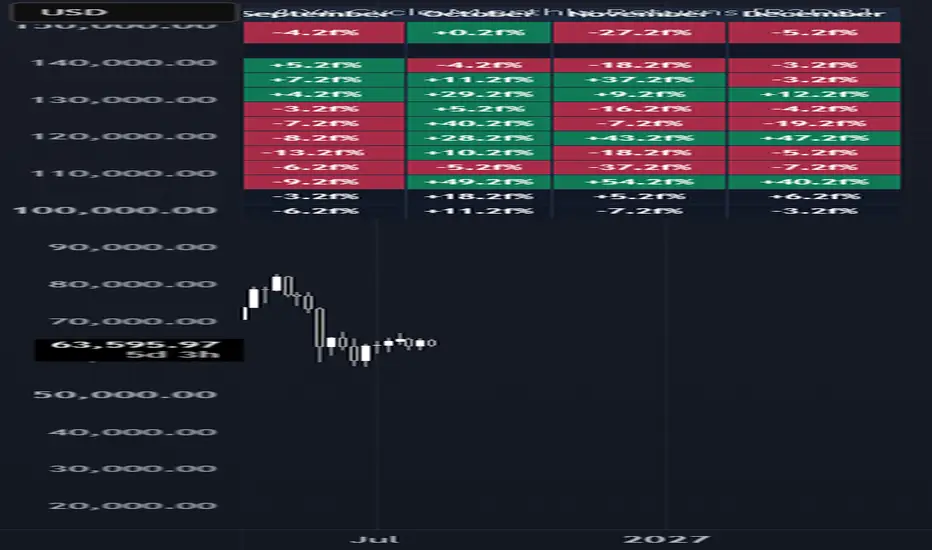
Crypto markets—most notably Bitcoin—have historically operated on a 4-year halving cycle. This indicator provides a comprehensive monthly returns heatmap combined with an automated 4-Year Cycle Forecast engine designed to help traders spot recurring cyclical opportunities.
Instead of looking at monthly seasonality in isolation, this tool maps current price action against past years that occupied the exact same stage of the 4-year cycle (e.g., comparing 2026 directly to 2022 and 2018).
Key Features & How to Spot Windows of Opportunity
High-probability trading windows generally emerge from two main factors:
4-Year Cycle Alignment: Identifying whether the current phase of the 4-year halving cycle has historically leaned heavily bullish or bearish.
Monthly Seasonality: Spotting months that consistently show positive or negative returns regardless of the macro trend (e.g., historical strength in October/November vs. weakness in September).
The Sweet Spot: When a historically strong month (e.g., October) aligns with a bullish phase of the 4-year cycle, the probability of a favorable window of opportunity increases significantly.
Table Breakdown
4-Year Forecast (Top Row): Calculates the projected monthly return by averaging only the past years that share the exact same 4-year cycle phase.
Historical Heatmap (Middle Rows): Displays monthly return percentages color-coded by performance (Green for positive, Red for negative). Years sharing the current cycle phase are visually highlighted in blue.
Average Row: Shows the mean return for each month across all available historical years.
Median Row: Shows the median return for each month, filtering out extreme outliers for a clearer picture of typical performance.
How to Use
Apply to Any Crypto Asset: While designed around the Bitcoin 4-year cycle, this script can be applied to BTCUSD, ETHUSD, or any altcoin to examine how it behaves during different phases of the Bitcoin cycle.
Identify Confluence: Look for months where both the 4-Year Forecast and the Average/Median rows point in the same direction.
Manage Risk: Use historical downside months to prepare for potential pullbacks or risk-off periods.
Customizable Inputs
Table Position: Move the table to any corner of your chart (Top Right, Top Left, Bottom Right, Bottom Left).
Text Size: Adjust text sizing to fit comfortably on small screens or large desktop layouts.
Start Year: Select the starting year for historical data collection (default set to 2017).
Show Statistics: Toggle the Average and Median rows on or off.
Disclaimer: Past performance is not indicative of future results. Historical monthly returns and cyclical forecasts are intended for educational purposes only and should not be used as financial advice or sole trading signals.
Crypto markets—most notably Bitcoin—have historically operated on a 4-year halving cycle. This indicator provides a comprehensive monthly returns heatmap combined with an automated 4-Year Cycle Forecast engine designed to help traders spot recurring cyclical opportunities.
Instead of looking at monthly seasonality in isolation, this tool maps current price action against past years that occupied the exact same stage of the 4-year cycle (e.g., comparing 2026 directly to 2022 and 2018).
Key Features & How to Spot Windows of Opportunity
High-probability trading windows generally emerge from two main factors:
4-Year Cycle Alignment: Identifying whether the current phase of the 4-year halving cycle has historically leaned heavily bullish or bearish.
Monthly Seasonality: Spotting months that consistently show positive or negative returns regardless of the macro trend (e.g., historical strength in October/November vs. weakness in September).
The Sweet Spot: When a historically strong month (e.g., October) aligns with a bullish phase of the 4-year cycle, the probability of a favorable window of opportunity increases significantly.
Table Breakdown
4-Year Forecast (Top Row): Calculates the projected monthly return by averaging only the past years that share the exact same 4-year cycle phase.
Historical Heatmap (Middle Rows): Displays monthly return percentages color-coded by performance (Green for positive, Red for negative). Years sharing the current cycle phase are visually highlighted in blue.
Average Row: Shows the mean return for each month across all available historical years.
Median Row: Shows the median return for each month, filtering out extreme outliers for a clearer picture of typical performance.
How to Use
Apply to Any Crypto Asset: While designed around the Bitcoin 4-year cycle, this script can be applied to BTCUSD, ETHUSD, or any altcoin to examine how it behaves during different phases of the Bitcoin cycle.
Identify Confluence: Look for months where both the 4-Year Forecast and the Average/Median rows point in the same direction.
Manage Risk: Use historical downside months to prepare for potential pullbacks or risk-off periods.
Customizable Inputs
Table Position: Move the table to any corner of your chart (Top Right, Top Left, Bottom Right, Bottom Left).
Text Size: Adjust text sizing to fit comfortably on small screens or large desktop layouts.
Start Year: Select the starting year for historical data collection (default set to 2017).
Show Statistics: Toggle the Average and Median rows on or off.
Disclaimer: Past performance is not indicative of future results. Historical monthly returns and cyclical forecasts are intended for educational purposes only and should not be used as financial advice or sole trading signals.
Информация о релизе
Fixed graph.Информация о релизе
<Graph isn't showing BTC weekly.>Скрипт с открытым кодом
В истинном духе TradingView, создатель этого скрипта сделал его открытым исходным кодом, чтобы трейдеры могли проверить и убедиться в его функциональности. Браво автору! Вы можете использовать его бесплатно, но помните, что перепубликация кода подчиняется нашим Правилам поведения.

Отказ от ответственности
Информация и публикации не предназначены для предоставления и не являются финансовыми, инвестиционными, торговыми или другими видами советов или рекомендаций, предоставленных или одобренных TradingView. Подробнее читайте в Условиях использования.
Скрипт с открытым кодом
В истинном духе TradingView, создатель этого скрипта сделал его открытым исходным кодом, чтобы трейдеры могли проверить и убедиться в его функциональности. Браво автору! Вы можете использовать его бесплатно, но помните, что перепубликация кода подчиняется нашим Правилам поведения.
Отказ от ответственности
Информация и публикации не предназначены для предоставления и не являются финансовыми, инвестиционными, торговыми или другими видами советов или рекомендаций, предоставленных или одобренных TradingView. Подробнее читайте в Условиях использования.