OPEN-SOURCE SCRIPT
RSI + SMA Crossover Gradient MTF Table
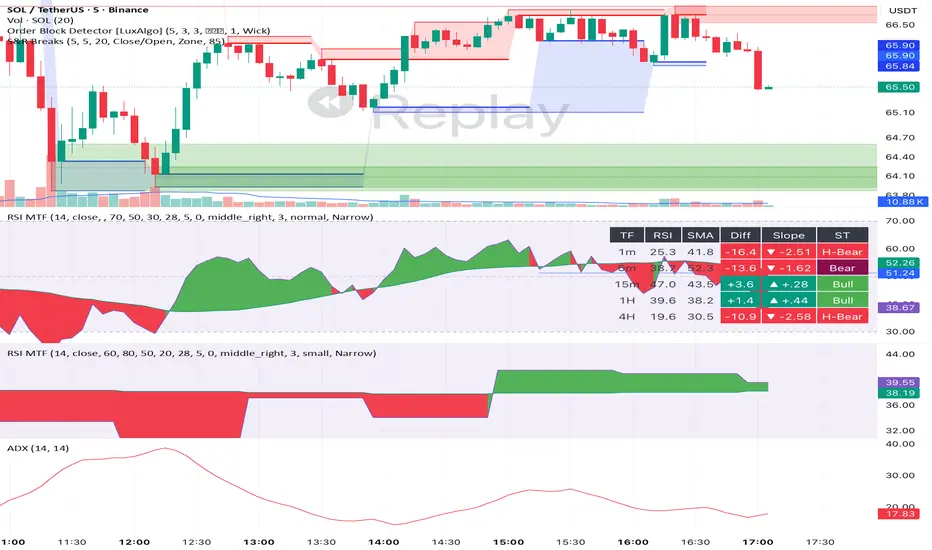
A multi-timeframe RSI indicator with SMA smoothing, crossover gradient fill, and a live MTF table.
FEATURES:
- RSI with custom SMA smoothing line
- Crossover Gradient Fill — color darkens as RSI moves away from cross point (bullish/bearish)
- MTF Table showing 1m, 5m, 15m, 1H, 4H timeframes simultaneously
- Each row shows: RSI value, SMA value, Diff (RSI−SMA), Slope direction, and Market State
- Market States: H-Bull, Bull, Bear, H-Bear based on RSI/SMA position relative to 50
- Table size adjustable (tiny to huge) — mobile friendly
- Table position fully customizable
HOW TO USE:
- RSI above SMA = Bullish momentum (green gradient)
- RSI below SMA = Bearish momentum (red gradient)
- H-Bull = Strong bull (both RSI & SMA above 50)
- H-Bear = Strong bear (both RSI & SMA below 50)
- Use MTF table to confirm trend across timeframes before entering a trade
FEATURES:
- RSI with custom SMA smoothing line
- Crossover Gradient Fill — color darkens as RSI moves away from cross point (bullish/bearish)
- MTF Table showing 1m, 5m, 15m, 1H, 4H timeframes simultaneously
- Each row shows: RSI value, SMA value, Diff (RSI−SMA), Slope direction, and Market State
- Market States: H-Bull, Bull, Bear, H-Bear based on RSI/SMA position relative to 50
- Table size adjustable (tiny to huge) — mobile friendly
- Table position fully customizable
HOW TO USE:
- RSI above SMA = Bullish momentum (green gradient)
- RSI below SMA = Bearish momentum (red gradient)
- H-Bull = Strong bull (both RSI & SMA above 50)
- H-Bear = Strong bear (both RSI & SMA below 50)
- Use MTF table to confirm trend across timeframes before entering a trade
Скрипт с открытым кодом
В истинном духе TradingView, создатель этого скрипта сделал его открытым исходным кодом, чтобы трейдеры могли проверить и убедиться в его функциональности. Браво автору! Вы можете использовать его бесплатно, но помните, что перепубликация кода подчиняется нашим Правилам поведения.

Отказ от ответственности
Информация и публикации не предназначены для предоставления и не являются финансовыми, инвестиционными, торговыми или другими видами советов или рекомендаций, предоставленных или одобренных TradingView. Подробнее читайте в Условиях использования.
Скрипт с открытым кодом
В истинном духе TradingView, создатель этого скрипта сделал его открытым исходным кодом, чтобы трейдеры могли проверить и убедиться в его функциональности. Браво автору! Вы можете использовать его бесплатно, но помните, что перепубликация кода подчиняется нашим Правилам поведения.
Отказ от ответственности
Информация и публикации не предназначены для предоставления и не являются финансовыми, инвестиционными, торговыми или другими видами советов или рекомендаций, предоставленных или одобренных TradingView. Подробнее читайте в Условиях использования.