OPEN-SOURCE SCRIPT
Обновлено RSI Extreme Divergence
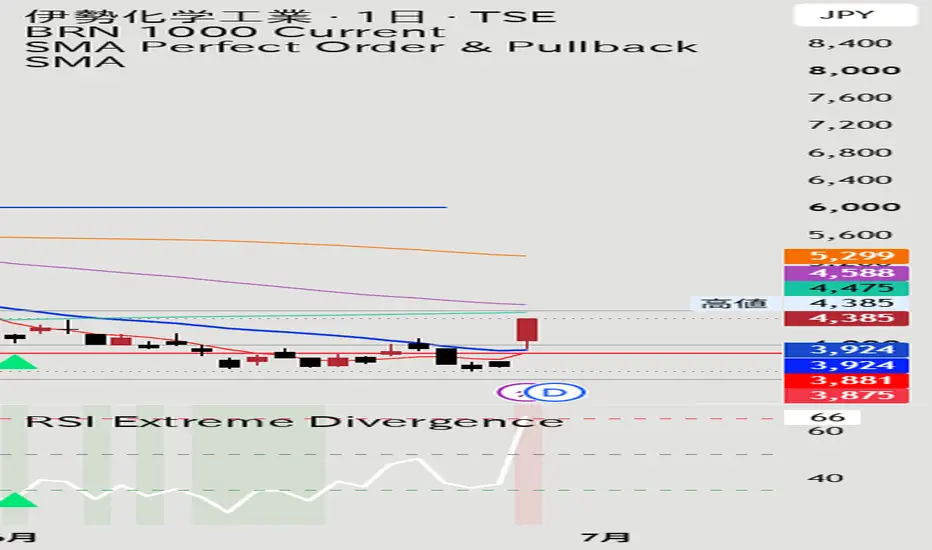
# RSI Extreme Divergence
An RSI divergence indicator designed to highlight only high-probability reversal signals.
Unlike standard divergence indicators, this script only detects divergences when the RSI reaches extreme conditions, helping filter out weaker signals during normal market fluctuations.
## Features
* Displays **RSI** with customizable length.
* Highlights **Overbought** and **Oversold** zones.
* Detects **Bullish Divergence** only when RSI is below the Oversold level.
* Detects **Bearish Divergence** only when RSI is above the Overbought level.
* Draws divergence lines directly on the RSI.
* Displays buy and sell arrows on both the RSI panel and the price chart.
* Includes alert support for bullish and bearish divergence signals.
## Why use this indicator?
Many divergence indicators generate too many signals during ranging markets.
This indicator focuses only on divergences that occur in extreme RSI conditions (default: above 70 or below 30), helping traders concentrate on higher-quality reversal opportunities.
## Default Settings
* RSI Length: **9**
* Pivot Length: **5**
* Overbought: **70**
* Oversold: **30**
These settings are optimized for swing trading but can be adjusted to suit different markets and trading styles.
An RSI divergence indicator designed to highlight only high-probability reversal signals.
Unlike standard divergence indicators, this script only detects divergences when the RSI reaches extreme conditions, helping filter out weaker signals during normal market fluctuations.
## Features
* Displays **RSI** with customizable length.
* Highlights **Overbought** and **Oversold** zones.
* Detects **Bullish Divergence** only when RSI is below the Oversold level.
* Detects **Bearish Divergence** only when RSI is above the Overbought level.
* Draws divergence lines directly on the RSI.
* Displays buy and sell arrows on both the RSI panel and the price chart.
* Includes alert support for bullish and bearish divergence signals.
## Why use this indicator?
Many divergence indicators generate too many signals during ranging markets.
This indicator focuses only on divergences that occur in extreme RSI conditions (default: above 70 or below 30), helping traders concentrate on higher-quality reversal opportunities.
## Default Settings
* RSI Length: **9**
* Pivot Length: **5**
* Overbought: **70**
* Oversold: **30**
These settings are optimized for swing trading but can be adjusted to suit different markets and trading styles.
Информация о релизе
Default settings (65/35) are optimized for Japanese stocks and swing trading. Users can freely adjust these levels to match their trading style and market conditions.Скрипт с открытым кодом
В истинном духе TradingView, создатель этого скрипта сделал его открытым исходным кодом, чтобы трейдеры могли проверить и убедиться в его функциональности. Браво автору! Вы можете использовать его бесплатно, но помните, что перепубликация кода подчиняется нашим Правилам поведения.

Отказ от ответственности
Информация и публикации не предназначены для предоставления и не являются финансовыми, инвестиционными, торговыми или другими видами советов или рекомендаций, предоставленных или одобренных TradingView. Подробнее читайте в Условиях использования.
Скрипт с открытым кодом
В истинном духе TradingView, создатель этого скрипта сделал его открытым исходным кодом, чтобы трейдеры могли проверить и убедиться в его функциональности. Браво автору! Вы можете использовать его бесплатно, но помните, что перепубликация кода подчиняется нашим Правилам поведения.
Отказ от ответственности
Информация и публикации не предназначены для предоставления и не являются финансовыми, инвестиционными, торговыми или другими видами советов или рекомендаций, предоставленных или одобренных TradingView. Подробнее читайте в Условиях использования.