Candle Body Pressure [Leonichev]
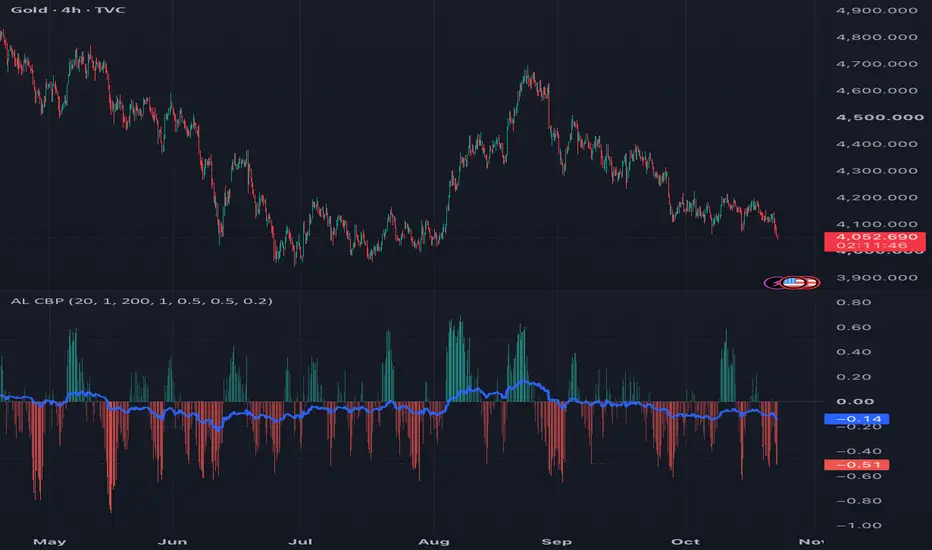
Candle Body Pressure shows who has been in control of recent candles, buyers or sellers, on a fixed scale from -1 to +1. It looks only at candle shape (bodies and wicks), so it works on any market, including those without reliable volume data.
How it works
1. Candle force. Each candle's force is its signed body (close minus open) plus its wick balance (lower wick minus upper wick) multiplied by a wick weight. A long lower wick counts as buying, a long upper wick as selling. Wicks can be switched off.
2. Fading memory. The last N candles are combined with a weight that fades from 1 on the current candle to 0 on the oldest. The decay power shapes this fade: 1 is linear, higher values keep older candles relevant for longer, lower values forget them faster.
3. Pressure ratio. Pressure = (bullish force − bearish force) / (bullish force + bearish force). At +1 every candle in memory pushed up; at −1 every candle pushed down; near 0 the two sides are balanced. Because it is a ratio, the value does not depend on price level or volatility and can be compared across instruments and timeframes.
Two readings are plotted: fast pressure (20 bars by default) as columns whose color strengthens toward the extremes, and slow pressure (200 bars) as a line for the background bias.
How to use it
- Fast pressure above zero means buyers dominated the recent candles; below zero, sellers.
- Readings beyond the extreme levels (±0.5 by default) mark one-sided moves. A fade from an extreme back toward zero shows the push is losing strength.
- Compare fast and slow pressure: fast pressure moving against the slow line often marks a pullback inside the larger move.
- Optional markers highlight sharp one-bar changes in fast pressure.
- Alerts: zero crosses, entry into the extreme zones, and sharp changes.
Repainting
The indicator uses only the current and past candles. As with any oscillator, the value of the current bar updates until that bar closes; values of closed bars never change.
This is an analysis tool, not a trading system.
How it works
1. Candle force. Each candle's force is its signed body (close minus open) plus its wick balance (lower wick minus upper wick) multiplied by a wick weight. A long lower wick counts as buying, a long upper wick as selling. Wicks can be switched off.
2. Fading memory. The last N candles are combined with a weight that fades from 1 on the current candle to 0 on the oldest. The decay power shapes this fade: 1 is linear, higher values keep older candles relevant for longer, lower values forget them faster.
3. Pressure ratio. Pressure = (bullish force − bearish force) / (bullish force + bearish force). At +1 every candle in memory pushed up; at −1 every candle pushed down; near 0 the two sides are balanced. Because it is a ratio, the value does not depend on price level or volatility and can be compared across instruments and timeframes.
Two readings are plotted: fast pressure (20 bars by default) as columns whose color strengthens toward the extremes, and slow pressure (200 bars) as a line for the background bias.
How to use it
- Fast pressure above zero means buyers dominated the recent candles; below zero, sellers.
- Readings beyond the extreme levels (±0.5 by default) mark one-sided moves. A fade from an extreme back toward zero shows the push is losing strength.
- Compare fast and slow pressure: fast pressure moving against the slow line often marks a pullback inside the larger move.
- Optional markers highlight sharp one-bar changes in fast pressure.
- Alerts: zero crosses, entry into the extreme zones, and sharp changes.
Repainting
The indicator uses only the current and past candles. As with any oscillator, the value of the current bar updates until that bar closes; values of closed bars never change.
This is an analysis tool, not a trading system.

Отказ от ответственности
Информация и публикации не предназначены для предоставления и не являются финансовыми, инвестиционными, торговыми или другими видами советов или рекомендаций, предоставленных или одобренных TradingView. Подробнее читайте в Условиях использования.
Отказ от ответственности
Информация и публикации не предназначены для предоставления и не являются финансовыми, инвестиционными, торговыми или другими видами советов или рекомендаций, предоставленных или одобренных TradingView. Подробнее читайте в Условиях использования.