Options Buyer (BUY Only)
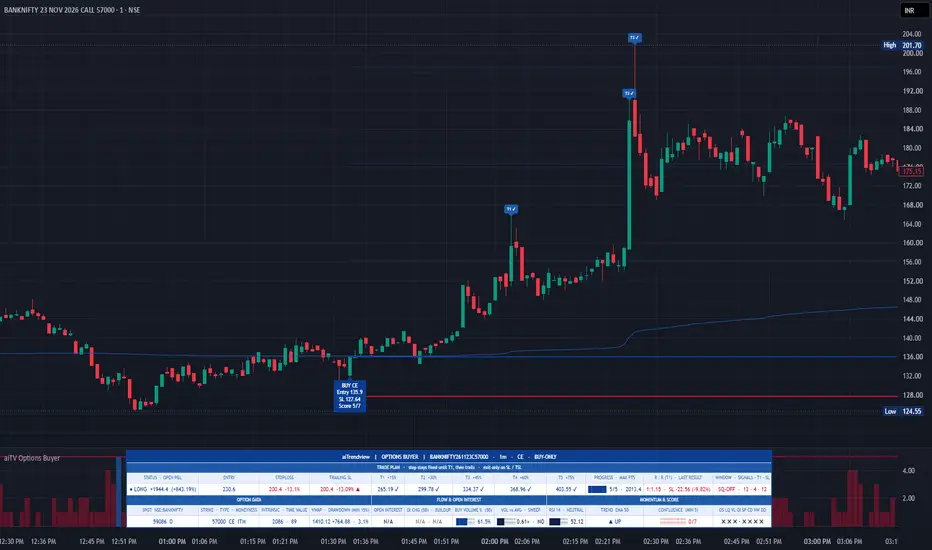
Options Buyer (BUY Only)
Advanced Multi-Factor Options Premium Analysis & Risk Management System | Pine Script v6
INTRODUCTION
aiTrendview Options Buyer is an advanced technical analysis indicator developed using Pine Script v6, primarily designed for analysing NIFTY, BANKNIFTY, FINNIFTY, MIDCPNIFTY and SENSEX Call (CE) and Put (PE) option contracts. The indicator combines eight analytical conditions, including RSI momentum, liquidity sweep detection, estimated buying-volume participation, Open Interest analysis, underlying index confirmation, bullish candlestick patterns, VWAP positioning and premium drawdown analysis. Instead of relying on a single technical indicator, the system evaluates multiple market conditions through a configurable confluence scoring mechanism before generating a BUY signal. Its primary objective is to identify potential option premium recovery opportunities following a significant price correction. This is a BUY-only analytical indicator. It does not generate SELL or option-writing signals.
HOW THE INDICATOR WORKS
The indicator operates directly on the selected option premium chart. When applied to a CE chart, it searches for conditions supporting a potential upward recovery in the Call premium. When applied to a PE chart, it searches for conditions supporting a potential upward recovery in the Put premium. The underlying index is monitored separately to evaluate whether its direction is favourable to the selected option type. The system evaluates eight analytical conditions before generating a BUY signal.
1. RSI OVERSOLD RECOVERY
The indicator uses the Relative Strength Index (RSI) to identify potential exhaustion in selling pressure. Default settings: RSI Length: 14; Oversold Level: 30; Oversold Memory: 8 bars. The system checks whether RSI has entered the oversold zone within the selected lookback period and is now turning upward. Code logic: `bool osOK = ta.lowest(rsi, osLookback) < osLevel and rsi > rsi[1]`. This condition attempts to identify a potential recovery in momentum following an extended decline in the option premium. An oversold reading alone does not generate a BUY signal.
2. LIQUIDITY SWEEP AND PRICE REJECTION
The system identifies situations where the option premium trades below the lowest low of the previous selected candles and subsequently closes above that previous low. Default liquidity sweep lookback: 15 bars. Code logic: `float priorLow = ta.lowest(low, sweepLen)[1]` and `bool sweep = low < priorLow and close > priorLow`. The indicator also evaluates candles with substantial lower wicks, which may indicate rejection of lower prices. Code logic: `bool liqOK = sweepRecent or (wickRatio >= 0.5 and close > open)`. This condition identifies potential liquidity sweeps and price rejection patterns. It does not confirm actual institutional buying or identify specific market participants.
3. BUYING VOLUME DOMINANCE
The indicator estimates buying and selling volume using the closing position of each candle within its high-low range. Code logic: `float buyVol = barRange > 0 ? volume * (close - low) / barRange : volume * 0.5` and `float sellVol = volume - buyVol`. The estimated buying-volume percentage is calculated over a configurable number of candles. Default settings: Flow Window: 5 bars; Minimum Buying Volume: 55%; Volume Average Length: 20 bars; Volume Spike Multiplier: 1.2. The system looks for relatively strong candle closes and sufficient trading activity. Important: This is an estimated volume distribution based on candle structure. It is not actual exchange-reported buyer-initiated and seller-initiated volume or order-book delta.
4. OPEN INTEREST ANALYSIS
The indicator attempts to retrieve Open Interest data using TradingView's corresponding Open Interest ticker. Code logic: `float oi = request.security(syminfo.tickerid + "_OI", timeframe.period, close, ignore_invalid_symbol=true)`. The system compares option premium movement with changes in Open Interest to classify four market conditions: Premium rising and OI rising indicates Long Buildup; Premium rising and OI falling indicates Short Covering; Premium falling and OI rising indicates Short Buildup; Premium falling and OI falling indicates Long Unwinding. Long Buildup and Short Covering are treated as favourable OI conditions for option premium recovery analysis. The indicator also looks for a transition from Short Buildup to a bullish OI condition. Open Interest availability depends on the TradingView symbol and data feed. If OI is unavailable, the system operates with seven available confluence factors instead of eight.
5. UNDERLYING INDEX CONFIRMATION
The indicator automatically identifies the underlying index based on supported option ticker prefixes. Manual underlying selection is also available. Supported automatic mappings include BANKNIFTY, NIFTY, FINNIFTY, MIDCPNIFTY and SENSEX. The underlying index price is retrieved using `request.security()`. Code logic: `float spot = request.security(underSym, timeframe.period, close, ignore_invalid_symbol=true)`. The directional confirmation depends on the selected option type. For CE options, the underlying index should be moving upward. For PE options, the underlying index should be moving downward. This provides additional directional context to the option premium analysis. If the underlying data cannot be retrieved, the corresponding directional filter is treated as satisfied. Users should verify the underlying symbol mapping before relying on the dashboard.
6. BULLISH CANDLE CONFIRMATION
The indicator checks for bullish price action before accepting a BUY signal. It identifies two types of confirmation: a bullish candle closing above the previous candle's high, or a bullish engulfing candle formation. Code logic: `bool engulf = close > open and close[1] < open[1] and open <= close[1] and close > open[1]` and `bool candleOK = close > open and (close > high[1] or engulf)`. This condition helps filter situations where momentum indicators show recovery but the price has not yet demonstrated sufficient bullish confirmation. Users can enable or disable this requirement through the indicator settings.
7. VWAP POSITIONING AND RECOVERY
The indicator calculates Volume Weighted Average Price (VWAP) using the option premium chart. Code logic: `float vwap = ta.vwap(hlc3)`. The system considers this condition satisfied when the premium is below VWAP or crosses above VWAP. Code logic: `bool vwapOK = close < vwap or ta.crossover(close, vwap)`. This helps evaluate whether the premium is trading below its volume-weighted average or beginning to recover above it. VWAP is evaluated alongside the other conditions and is not independently considered a BUY signal.
8. PREMIUM DRAWDOWN ANALYSIS
The indicator calculates the percentage decline in the option premium from its highest price during a configurable lookback period. Default settings: Drawdown Lookback: 30 bars; Minimum Premium Drawdown: 15%. Code logic: `float hh = ta.highest(high, ddLen)` and `float dd = hh > 0 ? (hh - close) / hh * 100 : 0`. The condition is confirmed through `bool ddOK = dd >= ddMin`. The purpose is to identify potential recovery opportunities after a meaningful premium correction instead of chasing an already extended upward movement. A discounted premium does not necessarily mean that an option is undervalued or will recover.
CONFLUENCE SCORING ENGINE
All eight conditions are combined into a single scoring mechanism. Each satisfied condition contributes one point. The maximum score is 8 when OI data is available and 7 when OI data is unavailable. The scoring calculation is: `int score = (osOK ? 1 : 0) + (liqOK ? 1 : 0) + (volOK ? 1 : 0) + (oiOK ? 1 : 0) + (spotOK ? 1 : 0) + (candleOK ? 1 : 0) + (vwapOK ? 1 : 0) + (ddOK ? 1 : 0)`. The default minimum confluence score is 6. When OI data is unavailable, the required score is automatically reduced by one point. Suggested score interpretation: 0–2 indicates limited technical confirmation; 3–4 indicates developing market conditions; 5 indicates moderate technical alignment; 6 represents the default BUY threshold; 7 indicates stronger technical alignment; and 8 indicates that all eight analytical conditions are satisfied. These scores represent the number of programmed conditions satisfied. They do not represent a statistically calculated probability or guaranteed success rate.
BUY SIGNAL GENERATION
A BUY signal is generated only when the required confluence score is achieved and the additional signal restrictions are satisfied. The system checks the minimum confluence score, optional bullish candle confirmation, trading session availability, optional EMA trend filter, positive chart volume, cooldown between signals, absence of an existing indicator trade and confirmed candle closure. The final signal logic uses `bool buySignal = rawBuy and not inTrade and (bar_index - lastSigBar) > cooldown and barstate.isconfirmed`. The use of `barstate.isconfirmed` ensures that the BUY signal is generated on a confirmed chart candle rather than intentionally generating signals on unfinished candles.
AUTOMATIC CE AND PE IDENTIFICATION
The indicator supports automatic identification of option type and strike from compatible TradingView option ticker formats. For example, C52000 identifies a Call option with strike 52000, while P52000 identifies a Put option with strike 52000. Users can alternatively select the option type and strike manually. The system also calculates additional option contract information. Intrinsic Value for CE is calculated as `max(Spot Price - Strike Price, 0)`. Intrinsic Value for PE is calculated as `max(Strike Price - Spot Price, 0)`. Estimated Time Value is calculated as Option Premium minus Intrinsic Value. Moneyness is classified as ITM when intrinsic value is positive, ATM when the underlying spot price is within 0.2% of the strike, and OTM when the option has no intrinsic value and is outside the defined ATM range. These calculations provide additional context for evaluating the selected option contract.
INTEGRATED RISK MANAGEMENT SYSTEM
Once a BUY signal is confirmed, the indicator automatically calculates the entry reference, initial Stoploss, five profit targets and trailing Stoploss.
ENTRY PRICE: The closing price of the confirmed BUY signal candle is used as the indicator's entry reference.
INITIAL STOPLOSS: The Stoploss is calculated using the lowest low of a configurable lookback period, adjusted by an ATR buffer. Code logic: `float rawSL = structLow - atr * slAtrBuf` and `float capSL = close * (1 - slMaxPct / 100)`. The final Stoploss is calculated using `slPx = math.max(math.max(rawSL, capSL), syminfo.mintick)`. Default settings: Structural SL Lookback: 10 bars; ATR Length: 14; ATR Buffer: 0.5; Maximum SL Distance: 20%. The maximum SL percentage acts as a cap on the calculated Stoploss distance.
FIVE AUTOMATIC PROFIT TARGETS: The indicator calculates five configurable targets based on the entry premium. Default configuration: Target 1: +10%; Target 2: +20%; Target 3: +30%; Target 4: +40%; Target 5: +50%. Calculation: `t1 = entryPx * (1 + t1Pct / 100)`, `t2 = entryPx * (1 + t2Pct / 100)`, `t3 = entryPx * (1 + t3Pct / 100)`, `t4 = entryPx * (1 + t4Pct / 100)`, and `t5 = entryPx * (1 + t5Pct / 100)`. All five targets can be modified through the indicator settings.
DYNAMIC TRAILING STOPLOSS: The trailing Stoploss is activated after Target 1 has been touched. Before Target 1, the initial Stoploss remains fixed. After Target 1, the trailing Stoploss progressively moves upward as additional targets are reached. The system combines target-based stop progression with an ATR-based trailing calculation. Code logic: `tslPx := math.max(tslPx, math.max(stepLvl, high - atr * trailAtr))`. The trailing Stoploss never moves downward during an active indicator trade. This mechanism is intended to help manage favourable premium movements while maintaining a progressively higher protective reference. The displayed Stoploss and trailing levels are analytical price references, not guaranteed execution prices.
INTEGRATED TRADING DASHBOARD
The indicator includes a 12-column analytical dashboard designed to provide a consolidated view of the option contract, trade plan, market conditions and signal strength. The dashboard contains three main sections.
TRADE PLAN: Displays current trade status, open P&L, entry price, initial Stoploss, trailing Stoploss, Targets 1–5, target progress, maximum favourable points, risk-to-reward ratio, last recorded indicator trade result, trading session status, total BUY signals, T1 hits and initial Stoploss exits.
OPTION DATA: Displays underlying spot price, spot price movement, option strike, CE or PE identification, ITM/ATM/OTM classification, intrinsic value, estimated time value, VWAP and premium drawdown percentage.
OPEN INTEREST AND FLOW ANALYSIS: Displays current Open Interest where available, OI change, Long Buildup, Short Covering, Short Buildup, Long Unwinding, estimated buying-volume percentage, volume relative to average and liquidity sweep status.
MOMENTUM AND CONFLUENCE: Displays RSI value, RSI market condition, EMA trend classification, current confluence score, minimum required score and individual pass/fail status of all eight analytical conditions. The dashboard is designed to help users understand why the indicator is generating or withholding a BUY signal.
VWAP AND EMA CHART INTEGRATION
Users can optionally display VWAP and the trend EMA directly on the main price chart. The default EMA length is 50. The optional EMA filter blocks BUY signals when the option premium is below a falling EMA. The EMA filter is disabled by default and can be enabled through the indicator settings.
TRADING SESSION AND COOLDOWN
The default signal window is 09:18 to 15:00 Indian Standard Time. The indicator uses the Asia/Kolkata timezone. Default cooldown is 10 bars. The cooldown mechanism prevents repeated BUY signals within a short period. The optional square-off function allows users to close the indicator's internal trade state at a configurable time, with the default square-off time set to 15:20 IST. The square-off exit is disabled by default.
TRADINGVIEW ALERTS
The indicator supports alerts for BUY signals, Target 1 reached, Target 2 reached, Target 3 reached, Target 4 reached, Target 5 reached, initial Stoploss exit, trailing Stoploss exit and square-off exit when enabled. Users can configure alerts through TradingView's alert interface. Alerts are notifications only. The indicator does not automatically place orders or execute transactions through a broker.
RECOMMENDED USAGE
For the intended analytical setup, open TradingView, select a supported NIFTY or BANKNIFTY CE or PE option contract, open the 1-minute chart and apply aiTrendview Options Buyer (BUY Only). Verify the option strike and CE/PE identification, verify the underlying index symbol, check Open Interest data availability, review the confluence score and individual conditions, review the Entry, Stoploss and five target levels, and configure TradingView alerts if required. Although designed primarily for 1-minute option charts, the script does not technically restrict other timeframes. Using different timeframes changes the calculations and lookback periods.
TECHNICAL LIMITATIONS
This is an indicator, not a TradingView Strategy Tester strategy. The internal trade tracking, P&L calculations and counters are not independently verified brokerage performance or backtest results. Buying and selling volume are estimated from candle structure and do not represent actual exchange-level order-flow data. Open Interest availability depends on the supported TradingView data feed. Option premiums are affected by underlying price movements, implied volatility, time decay, liquidity and bid-ask spreads. This indicator does not calculate implied volatility or option Greeks. The underlying directional filter is treated as satisfied when spot data is unavailable. Users must verify their underlying symbol mapping. The indicator uses chart OHLC values to evaluate targets and Stoploss levels. It cannot determine the exact sequence of intrabar price movements or guarantee execution at displayed levels. The internal performance counters are analytical statistics, not verified trading performance. They do not account for brokerage, slippage, taxes or actual execution costs.
ABOUT AITRENDVIEW
aiTrendview is a software development and analytical technology company specialising in financial charting systems, technical analysis tools, market-data visualisation and customised analytical software. Our objective is to develop technology-driven analytical platforms that help users organise, interpret and monitor complex market information through structured dashboards and configurable analytical systems. aiTrendview develops software tools for TradingView and other analytical environments. Our products are designed to provide technical analysis capabilities and information visualisation.
STRICT DISCLAIMER – IMPORTANT RISK DISCLOSURE
aiTrendview Options Buyer (BUY Only) is an analytical software product developed and distributed by aiTrendview for educational, informational, technical-analysis and market-research purposes only. This indicator does not constitute financial advice, investment advice, trading advice, portfolio management, investment recommendations or a solicitation to buy or sell any financial instrument. All BUY signals, entry levels, Stoploss levels, trailing Stoploss levels, profit targets, confluence scores and dashboard readings are algorithmically generated analytical outputs based on predefined mathematical conditions. aiTrendview does not guarantee the accuracy of signals, achievement of profit targets, effectiveness of Stoploss calculations, future market direction, trading profitability or continuity of software availability.
Options trading involves substantial financial risk. Option premiums may decline rapidly and may lose their entire value. Changes in implied volatility, time decay, market liquidity, sudden price movements, spreads and execution conditions can result in substantial losses. A displayed Stoploss does not guarantee protection against losses or execution at the displayed price.
Users are solely responsible for their trading decisions, independent research, risk assessment, position sizing, capital allocation, order placement and execution. This software does not automatically execute trades, manage brokerage accounts or guarantee order execution. TradingView alerts are notifications only.
The indicator depends on TradingView's platform, available market data, supported symbols and Pine Script functionality. Missing data, data inaccuracies, connectivity interruptions, symbol incompatibility and platform outages may affect its operation.
To the maximum extent permitted by applicable law, aiTrendview, its developers, directors, representatives, affiliates and distributors shall not be responsible for trading losses, financial damages, loss of capital, loss of profits, missed opportunities, execution failures or damages arising from the use or inability to use this software. Nothing in this disclaimer excludes or limits liability that cannot legally be excluded under applicable law.
This software is an analytical technology product and does not represent regulatory approval, endorsement or authorisation by SEBI, any stock exchange, broker or financial regulator. Users are responsible for ensuring that their activities comply with the applicable laws and regulations of their jurisdiction.
By installing, accessing or using this indicator, users acknowledge that they understand its functionality, limitations and associated financial risks.
FINAL NOTICE
aiTrendview provides analytical software, not guaranteed trading outcomes. USE AT YOUR OWN RISK. TRADE RESPONSIBLY. NEVER RISK MONEY YOU CANNOT AFFORD TO LOSE.
Advanced Multi-Factor Options Premium Analysis & Risk Management System | Pine Script v6
INTRODUCTION
aiTrendview Options Buyer is an advanced technical analysis indicator developed using Pine Script v6, primarily designed for analysing NIFTY, BANKNIFTY, FINNIFTY, MIDCPNIFTY and SENSEX Call (CE) and Put (PE) option contracts. The indicator combines eight analytical conditions, including RSI momentum, liquidity sweep detection, estimated buying-volume participation, Open Interest analysis, underlying index confirmation, bullish candlestick patterns, VWAP positioning and premium drawdown analysis. Instead of relying on a single technical indicator, the system evaluates multiple market conditions through a configurable confluence scoring mechanism before generating a BUY signal. Its primary objective is to identify potential option premium recovery opportunities following a significant price correction. This is a BUY-only analytical indicator. It does not generate SELL or option-writing signals.
HOW THE INDICATOR WORKS
The indicator operates directly on the selected option premium chart. When applied to a CE chart, it searches for conditions supporting a potential upward recovery in the Call premium. When applied to a PE chart, it searches for conditions supporting a potential upward recovery in the Put premium. The underlying index is monitored separately to evaluate whether its direction is favourable to the selected option type. The system evaluates eight analytical conditions before generating a BUY signal.
1. RSI OVERSOLD RECOVERY
The indicator uses the Relative Strength Index (RSI) to identify potential exhaustion in selling pressure. Default settings: RSI Length: 14; Oversold Level: 30; Oversold Memory: 8 bars. The system checks whether RSI has entered the oversold zone within the selected lookback period and is now turning upward. Code logic: `bool osOK = ta.lowest(rsi, osLookback) < osLevel and rsi > rsi[1]`. This condition attempts to identify a potential recovery in momentum following an extended decline in the option premium. An oversold reading alone does not generate a BUY signal.
2. LIQUIDITY SWEEP AND PRICE REJECTION
The system identifies situations where the option premium trades below the lowest low of the previous selected candles and subsequently closes above that previous low. Default liquidity sweep lookback: 15 bars. Code logic: `float priorLow = ta.lowest(low, sweepLen)[1]` and `bool sweep = low < priorLow and close > priorLow`. The indicator also evaluates candles with substantial lower wicks, which may indicate rejection of lower prices. Code logic: `bool liqOK = sweepRecent or (wickRatio >= 0.5 and close > open)`. This condition identifies potential liquidity sweeps and price rejection patterns. It does not confirm actual institutional buying or identify specific market participants.
3. BUYING VOLUME DOMINANCE
The indicator estimates buying and selling volume using the closing position of each candle within its high-low range. Code logic: `float buyVol = barRange > 0 ? volume * (close - low) / barRange : volume * 0.5` and `float sellVol = volume - buyVol`. The estimated buying-volume percentage is calculated over a configurable number of candles. Default settings: Flow Window: 5 bars; Minimum Buying Volume: 55%; Volume Average Length: 20 bars; Volume Spike Multiplier: 1.2. The system looks for relatively strong candle closes and sufficient trading activity. Important: This is an estimated volume distribution based on candle structure. It is not actual exchange-reported buyer-initiated and seller-initiated volume or order-book delta.
4. OPEN INTEREST ANALYSIS
The indicator attempts to retrieve Open Interest data using TradingView's corresponding Open Interest ticker. Code logic: `float oi = request.security(syminfo.tickerid + "_OI", timeframe.period, close, ignore_invalid_symbol=true)`. The system compares option premium movement with changes in Open Interest to classify four market conditions: Premium rising and OI rising indicates Long Buildup; Premium rising and OI falling indicates Short Covering; Premium falling and OI rising indicates Short Buildup; Premium falling and OI falling indicates Long Unwinding. Long Buildup and Short Covering are treated as favourable OI conditions for option premium recovery analysis. The indicator also looks for a transition from Short Buildup to a bullish OI condition. Open Interest availability depends on the TradingView symbol and data feed. If OI is unavailable, the system operates with seven available confluence factors instead of eight.
5. UNDERLYING INDEX CONFIRMATION
The indicator automatically identifies the underlying index based on supported option ticker prefixes. Manual underlying selection is also available. Supported automatic mappings include BANKNIFTY, NIFTY, FINNIFTY, MIDCPNIFTY and SENSEX. The underlying index price is retrieved using `request.security()`. Code logic: `float spot = request.security(underSym, timeframe.period, close, ignore_invalid_symbol=true)`. The directional confirmation depends on the selected option type. For CE options, the underlying index should be moving upward. For PE options, the underlying index should be moving downward. This provides additional directional context to the option premium analysis. If the underlying data cannot be retrieved, the corresponding directional filter is treated as satisfied. Users should verify the underlying symbol mapping before relying on the dashboard.
6. BULLISH CANDLE CONFIRMATION
The indicator checks for bullish price action before accepting a BUY signal. It identifies two types of confirmation: a bullish candle closing above the previous candle's high, or a bullish engulfing candle formation. Code logic: `bool engulf = close > open and close[1] < open[1] and open <= close[1] and close > open[1]` and `bool candleOK = close > open and (close > high[1] or engulf)`. This condition helps filter situations where momentum indicators show recovery but the price has not yet demonstrated sufficient bullish confirmation. Users can enable or disable this requirement through the indicator settings.
7. VWAP POSITIONING AND RECOVERY
The indicator calculates Volume Weighted Average Price (VWAP) using the option premium chart. Code logic: `float vwap = ta.vwap(hlc3)`. The system considers this condition satisfied when the premium is below VWAP or crosses above VWAP. Code logic: `bool vwapOK = close < vwap or ta.crossover(close, vwap)`. This helps evaluate whether the premium is trading below its volume-weighted average or beginning to recover above it. VWAP is evaluated alongside the other conditions and is not independently considered a BUY signal.
8. PREMIUM DRAWDOWN ANALYSIS
The indicator calculates the percentage decline in the option premium from its highest price during a configurable lookback period. Default settings: Drawdown Lookback: 30 bars; Minimum Premium Drawdown: 15%. Code logic: `float hh = ta.highest(high, ddLen)` and `float dd = hh > 0 ? (hh - close) / hh * 100 : 0`. The condition is confirmed through `bool ddOK = dd >= ddMin`. The purpose is to identify potential recovery opportunities after a meaningful premium correction instead of chasing an already extended upward movement. A discounted premium does not necessarily mean that an option is undervalued or will recover.
CONFLUENCE SCORING ENGINE
All eight conditions are combined into a single scoring mechanism. Each satisfied condition contributes one point. The maximum score is 8 when OI data is available and 7 when OI data is unavailable. The scoring calculation is: `int score = (osOK ? 1 : 0) + (liqOK ? 1 : 0) + (volOK ? 1 : 0) + (oiOK ? 1 : 0) + (spotOK ? 1 : 0) + (candleOK ? 1 : 0) + (vwapOK ? 1 : 0) + (ddOK ? 1 : 0)`. The default minimum confluence score is 6. When OI data is unavailable, the required score is automatically reduced by one point. Suggested score interpretation: 0–2 indicates limited technical confirmation; 3–4 indicates developing market conditions; 5 indicates moderate technical alignment; 6 represents the default BUY threshold; 7 indicates stronger technical alignment; and 8 indicates that all eight analytical conditions are satisfied. These scores represent the number of programmed conditions satisfied. They do not represent a statistically calculated probability or guaranteed success rate.
BUY SIGNAL GENERATION
A BUY signal is generated only when the required confluence score is achieved and the additional signal restrictions are satisfied. The system checks the minimum confluence score, optional bullish candle confirmation, trading session availability, optional EMA trend filter, positive chart volume, cooldown between signals, absence of an existing indicator trade and confirmed candle closure. The final signal logic uses `bool buySignal = rawBuy and not inTrade and (bar_index - lastSigBar) > cooldown and barstate.isconfirmed`. The use of `barstate.isconfirmed` ensures that the BUY signal is generated on a confirmed chart candle rather than intentionally generating signals on unfinished candles.
AUTOMATIC CE AND PE IDENTIFICATION
The indicator supports automatic identification of option type and strike from compatible TradingView option ticker formats. For example, C52000 identifies a Call option with strike 52000, while P52000 identifies a Put option with strike 52000. Users can alternatively select the option type and strike manually. The system also calculates additional option contract information. Intrinsic Value for CE is calculated as `max(Spot Price - Strike Price, 0)`. Intrinsic Value for PE is calculated as `max(Strike Price - Spot Price, 0)`. Estimated Time Value is calculated as Option Premium minus Intrinsic Value. Moneyness is classified as ITM when intrinsic value is positive, ATM when the underlying spot price is within 0.2% of the strike, and OTM when the option has no intrinsic value and is outside the defined ATM range. These calculations provide additional context for evaluating the selected option contract.
INTEGRATED RISK MANAGEMENT SYSTEM
Once a BUY signal is confirmed, the indicator automatically calculates the entry reference, initial Stoploss, five profit targets and trailing Stoploss.
ENTRY PRICE: The closing price of the confirmed BUY signal candle is used as the indicator's entry reference.
INITIAL STOPLOSS: The Stoploss is calculated using the lowest low of a configurable lookback period, adjusted by an ATR buffer. Code logic: `float rawSL = structLow - atr * slAtrBuf` and `float capSL = close * (1 - slMaxPct / 100)`. The final Stoploss is calculated using `slPx = math.max(math.max(rawSL, capSL), syminfo.mintick)`. Default settings: Structural SL Lookback: 10 bars; ATR Length: 14; ATR Buffer: 0.5; Maximum SL Distance: 20%. The maximum SL percentage acts as a cap on the calculated Stoploss distance.
FIVE AUTOMATIC PROFIT TARGETS: The indicator calculates five configurable targets based on the entry premium. Default configuration: Target 1: +10%; Target 2: +20%; Target 3: +30%; Target 4: +40%; Target 5: +50%. Calculation: `t1 = entryPx * (1 + t1Pct / 100)`, `t2 = entryPx * (1 + t2Pct / 100)`, `t3 = entryPx * (1 + t3Pct / 100)`, `t4 = entryPx * (1 + t4Pct / 100)`, and `t5 = entryPx * (1 + t5Pct / 100)`. All five targets can be modified through the indicator settings.
DYNAMIC TRAILING STOPLOSS: The trailing Stoploss is activated after Target 1 has been touched. Before Target 1, the initial Stoploss remains fixed. After Target 1, the trailing Stoploss progressively moves upward as additional targets are reached. The system combines target-based stop progression with an ATR-based trailing calculation. Code logic: `tslPx := math.max(tslPx, math.max(stepLvl, high - atr * trailAtr))`. The trailing Stoploss never moves downward during an active indicator trade. This mechanism is intended to help manage favourable premium movements while maintaining a progressively higher protective reference. The displayed Stoploss and trailing levels are analytical price references, not guaranteed execution prices.
INTEGRATED TRADING DASHBOARD
The indicator includes a 12-column analytical dashboard designed to provide a consolidated view of the option contract, trade plan, market conditions and signal strength. The dashboard contains three main sections.
TRADE PLAN: Displays current trade status, open P&L, entry price, initial Stoploss, trailing Stoploss, Targets 1–5, target progress, maximum favourable points, risk-to-reward ratio, last recorded indicator trade result, trading session status, total BUY signals, T1 hits and initial Stoploss exits.
OPTION DATA: Displays underlying spot price, spot price movement, option strike, CE or PE identification, ITM/ATM/OTM classification, intrinsic value, estimated time value, VWAP and premium drawdown percentage.
OPEN INTEREST AND FLOW ANALYSIS: Displays current Open Interest where available, OI change, Long Buildup, Short Covering, Short Buildup, Long Unwinding, estimated buying-volume percentage, volume relative to average and liquidity sweep status.
MOMENTUM AND CONFLUENCE: Displays RSI value, RSI market condition, EMA trend classification, current confluence score, minimum required score and individual pass/fail status of all eight analytical conditions. The dashboard is designed to help users understand why the indicator is generating or withholding a BUY signal.
VWAP AND EMA CHART INTEGRATION
Users can optionally display VWAP and the trend EMA directly on the main price chart. The default EMA length is 50. The optional EMA filter blocks BUY signals when the option premium is below a falling EMA. The EMA filter is disabled by default and can be enabled through the indicator settings.
TRADING SESSION AND COOLDOWN
The default signal window is 09:18 to 15:00 Indian Standard Time. The indicator uses the Asia/Kolkata timezone. Default cooldown is 10 bars. The cooldown mechanism prevents repeated BUY signals within a short period. The optional square-off function allows users to close the indicator's internal trade state at a configurable time, with the default square-off time set to 15:20 IST. The square-off exit is disabled by default.
TRADINGVIEW ALERTS
The indicator supports alerts for BUY signals, Target 1 reached, Target 2 reached, Target 3 reached, Target 4 reached, Target 5 reached, initial Stoploss exit, trailing Stoploss exit and square-off exit when enabled. Users can configure alerts through TradingView's alert interface. Alerts are notifications only. The indicator does not automatically place orders or execute transactions through a broker.
RECOMMENDED USAGE
For the intended analytical setup, open TradingView, select a supported NIFTY or BANKNIFTY CE or PE option contract, open the 1-minute chart and apply aiTrendview Options Buyer (BUY Only). Verify the option strike and CE/PE identification, verify the underlying index symbol, check Open Interest data availability, review the confluence score and individual conditions, review the Entry, Stoploss and five target levels, and configure TradingView alerts if required. Although designed primarily for 1-minute option charts, the script does not technically restrict other timeframes. Using different timeframes changes the calculations and lookback periods.
TECHNICAL LIMITATIONS
This is an indicator, not a TradingView Strategy Tester strategy. The internal trade tracking, P&L calculations and counters are not independently verified brokerage performance or backtest results. Buying and selling volume are estimated from candle structure and do not represent actual exchange-level order-flow data. Open Interest availability depends on the supported TradingView data feed. Option premiums are affected by underlying price movements, implied volatility, time decay, liquidity and bid-ask spreads. This indicator does not calculate implied volatility or option Greeks. The underlying directional filter is treated as satisfied when spot data is unavailable. Users must verify their underlying symbol mapping. The indicator uses chart OHLC values to evaluate targets and Stoploss levels. It cannot determine the exact sequence of intrabar price movements or guarantee execution at displayed levels. The internal performance counters are analytical statistics, not verified trading performance. They do not account for brokerage, slippage, taxes or actual execution costs.
ABOUT AITRENDVIEW
aiTrendview is a software development and analytical technology company specialising in financial charting systems, technical analysis tools, market-data visualisation and customised analytical software. Our objective is to develop technology-driven analytical platforms that help users organise, interpret and monitor complex market information through structured dashboards and configurable analytical systems. aiTrendview develops software tools for TradingView and other analytical environments. Our products are designed to provide technical analysis capabilities and information visualisation.
STRICT DISCLAIMER – IMPORTANT RISK DISCLOSURE
aiTrendview Options Buyer (BUY Only) is an analytical software product developed and distributed by aiTrendview for educational, informational, technical-analysis and market-research purposes only. This indicator does not constitute financial advice, investment advice, trading advice, portfolio management, investment recommendations or a solicitation to buy or sell any financial instrument. All BUY signals, entry levels, Stoploss levels, trailing Stoploss levels, profit targets, confluence scores and dashboard readings are algorithmically generated analytical outputs based on predefined mathematical conditions. aiTrendview does not guarantee the accuracy of signals, achievement of profit targets, effectiveness of Stoploss calculations, future market direction, trading profitability or continuity of software availability.
Options trading involves substantial financial risk. Option premiums may decline rapidly and may lose their entire value. Changes in implied volatility, time decay, market liquidity, sudden price movements, spreads and execution conditions can result in substantial losses. A displayed Stoploss does not guarantee protection against losses or execution at the displayed price.
Users are solely responsible for their trading decisions, independent research, risk assessment, position sizing, capital allocation, order placement and execution. This software does not automatically execute trades, manage brokerage accounts or guarantee order execution. TradingView alerts are notifications only.
The indicator depends on TradingView's platform, available market data, supported symbols and Pine Script functionality. Missing data, data inaccuracies, connectivity interruptions, symbol incompatibility and platform outages may affect its operation.
To the maximum extent permitted by applicable law, aiTrendview, its developers, directors, representatives, affiliates and distributors shall not be responsible for trading losses, financial damages, loss of capital, loss of profits, missed opportunities, execution failures or damages arising from the use or inability to use this software. Nothing in this disclaimer excludes or limits liability that cannot legally be excluded under applicable law.
This software is an analytical technology product and does not represent regulatory approval, endorsement or authorisation by SEBI, any stock exchange, broker or financial regulator. Users are responsible for ensuring that their activities comply with the applicable laws and regulations of their jurisdiction.
By installing, accessing or using this indicator, users acknowledge that they understand its functionality, limitations and associated financial risks.
FINAL NOTICE
aiTrendview provides analytical software, not guaranteed trading outcomes. USE AT YOUR OWN RISK. TRADE RESPONSIBLY. NEVER RISK MONEY YOU CANNOT AFFORD TO LOSE.

Отказ от ответственности
Информация и публикации не предназначены для предоставления и не являются финансовыми, инвестиционными, торговыми или другими видами советов или рекомендаций, предоставленных или одобренных TradingView. Подробнее читайте в Условиях использования.
Отказ от ответственности
Информация и публикации не предназначены для предоставления и не являются финансовыми, инвестиционными, торговыми или другими видами советов или рекомендаций, предоставленных или одобренных TradingView. Подробнее читайте в Условиях использования.