OPEN-SOURCE SCRIPT
Обновлено Really Relative Volume (RVol) [BruzX]
█ OVERVIEW
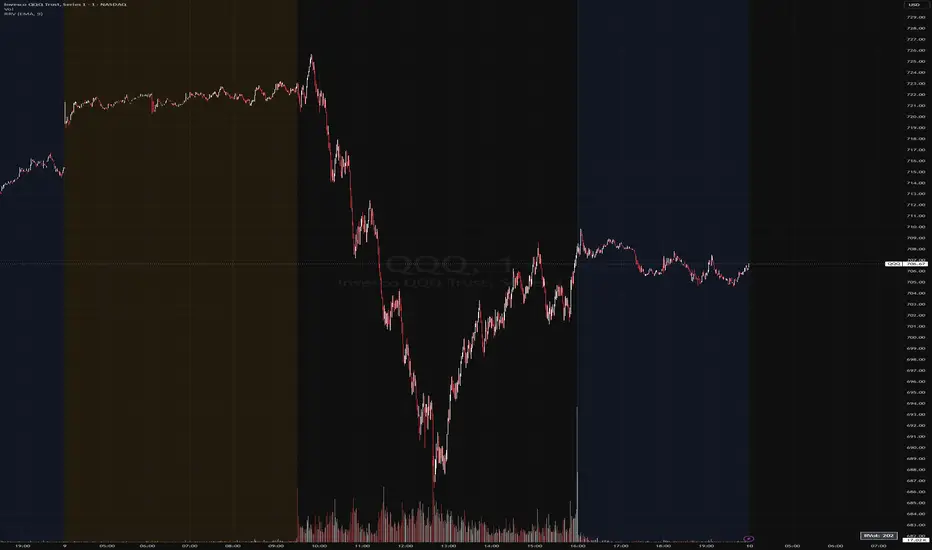
This indicator simply shows an estimate of intraday relative volume (RVol). By default, this is displayed as a small label at a configurable location on the pane. Optionally, the indicator can be moved to its own pane, where a plot of the historic values is shown as RVol develops throughout the session, as shown in the image below.

█ FEATURES
█ CONCEPTS
Relative volume (RVol) is the cumulative volume up to the current bar in the current session compared to the average cumulative volume up to the same bar over previous sessions. It is expressed as a percentage and is useful for assessing how actively a symbol is traded during the current day compared to what has been recently normal for that symbol.
It is intended for intraday use only. The exact value may vary slightly across timeframes due to how RVol is calculated. Generally, the lower the chart timeframe, the more accurate it is.
Between candle opens and closes, RVol is estimated using linear interpolation, based on the exact time of each tick, creating an estimate proportional to the amount of time elapsed within each bar.
RVol will differ during market hours depending on whether premarket data is included or excluded; this is expected and correct behaviour.
This indicator handles the average cumulative volume per bar correctly by storing the average for each bar in an array, making it more accurate than some similar indicators.
█ LIMITATIONS
A simple average is not available as an averaging method due to the complexity involved in storing a large matrix of each session’s volume values for each bar. Speed and efficiency are prioritised, and EMA and RMA can both be calculated recursively and efficiently. The difference is usually not significant.
█ DISCLAIMER
This indicator is provided for informational purposes only and should not be used in isolation without a good understanding of what it does and without considering other factors. You should not take trades using real money based solely on what this indicator indicates. Any trades you take are entirely at your own risk.
This indicator simply shows an estimate of intraday relative volume (RVol). By default, this is displayed as a small label at a configurable location on the pane. Optionally, the indicator can be moved to its own pane, where a plot of the historic values is shown as RVol develops throughout the session, as shown in the image below.
█ FEATURES
- Shows RVol either as a small label in a configurable location or as a plot
- Optionally can exclude pre- and post-market volume from the calculation for stocks
- Allows choosing between exponential moving average (EMA) and relative moving average (RMA) for the averaging method of cumulative volume per session
█ CONCEPTS
Relative volume (RVol) is the cumulative volume up to the current bar in the current session compared to the average cumulative volume up to the same bar over previous sessions. It is expressed as a percentage and is useful for assessing how actively a symbol is traded during the current day compared to what has been recently normal for that symbol.
It is intended for intraday use only. The exact value may vary slightly across timeframes due to how RVol is calculated. Generally, the lower the chart timeframe, the more accurate it is.
Between candle opens and closes, RVol is estimated using linear interpolation, based on the exact time of each tick, creating an estimate proportional to the amount of time elapsed within each bar.
RVol will differ during market hours depending on whether premarket data is included or excluded; this is expected and correct behaviour.
This indicator handles the average cumulative volume per bar correctly by storing the average for each bar in an array, making it more accurate than some similar indicators.
█ LIMITATIONS
A simple average is not available as an averaging method due to the complexity involved in storing a large matrix of each session’s volume values for each bar. Speed and efficiency are prioritised, and EMA and RMA can both be calculated recursively and efficiently. The difference is usually not significant.
█ DISCLAIMER
This indicator is provided for informational purposes only and should not be used in isolation without a good understanding of what it does and without considering other factors. You should not take trades using real money based solely on what this indicator indicates. Any trades you take are entirely at your own risk.
Информация о релизе
- Added "%" to the RVol labelИнформация о релизе
Changed default averaging method from EMA to RMA, and default length from 9 to 14 daysСкрипт с открытым кодом
В истинном духе TradingView, создатель этого скрипта сделал его открытым исходным кодом, чтобы трейдеры могли проверить и убедиться в его функциональности. Браво автору! Вы можете использовать его бесплатно, но помните, что перепубликация кода подчиняется нашим Правилам поведения.

If you like my free indicators, please consider my paid ones also: marketalchemists.org/indicators
Отказ от ответственности
Информация и публикации не предназначены для предоставления и не являются финансовыми, инвестиционными, торговыми или другими видами советов или рекомендаций, предоставленных или одобренных TradingView. Подробнее читайте в Условиях использования.
Скрипт с открытым кодом
В истинном духе TradingView, создатель этого скрипта сделал его открытым исходным кодом, чтобы трейдеры могли проверить и убедиться в его функциональности. Браво автору! Вы можете использовать его бесплатно, но помните, что перепубликация кода подчиняется нашим Правилам поведения.
If you like my free indicators, please consider my paid ones also: marketalchemists.org/indicators
Отказ от ответственности
Информация и публикации не предназначены для предоставления и не являются финансовыми, инвестиционными, торговыми или другими видами советов или рекомендаций, предоставленных или одобренных TradingView. Подробнее читайте в Условиях использования.