RSI EMA Dot (Long Below / Short Above)
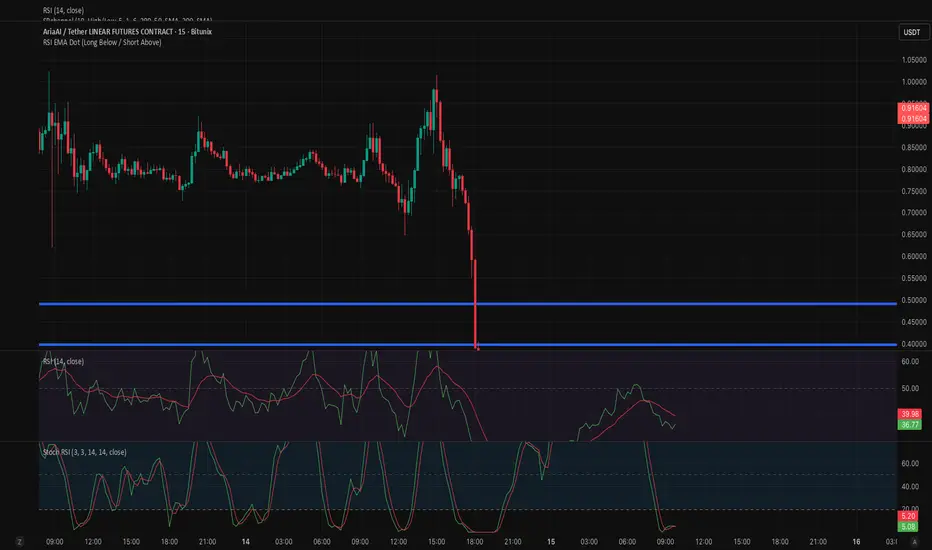
RSI EMA Cross Dot Indicator
This indicator identifies potential reversal points by combining RSI extremes with momentum shifts.
A signal is generated when the RSI (14) crosses its EMA (14) after being in an extreme zone:
Long signal (green dot below the candle):
RSI was below 20 (oversold) and then crosses above its EMA.
Short signal (red dot above the candle):
RSI was above 80 (overbought) and then crosses below its EMA.
Dots are plotted directly on the chart:
Long signals appear below the candle
Short signals appear above the candle
This helps highlight potential market reversals after extreme conditions, making it useful for identifying high-probability reaction zones.
This indicator identifies potential reversal points by combining RSI extremes with momentum shifts.
A signal is generated when the RSI (14) crosses its EMA (14) after being in an extreme zone:
Long signal (green dot below the candle):
RSI was below 20 (oversold) and then crosses above its EMA.
Short signal (red dot above the candle):
RSI was above 80 (overbought) and then crosses below its EMA.
Dots are plotted directly on the chart:
Long signals appear below the candle
Short signals appear above the candle
This helps highlight potential market reversals after extreme conditions, making it useful for identifying high-probability reaction zones.

Отказ от ответственности
Информация и публикации не предназначены для предоставления и не являются финансовыми, инвестиционными, торговыми или другими видами советов или рекомендаций, предоставленных или одобренных TradingView. Подробнее читайте в Условиях использования.
Отказ от ответственности
Информация и публикации не предназначены для предоставления и не являются финансовыми, инвестиционными, торговыми или другими видами советов или рекомендаций, предоставленных или одобренных TradingView. Подробнее читайте в Условиях использования.