OPEN-SOURCE SCRIPT
Обновлено Daily RVOL (Raw) SMA/EMA + Surge Marker - TP
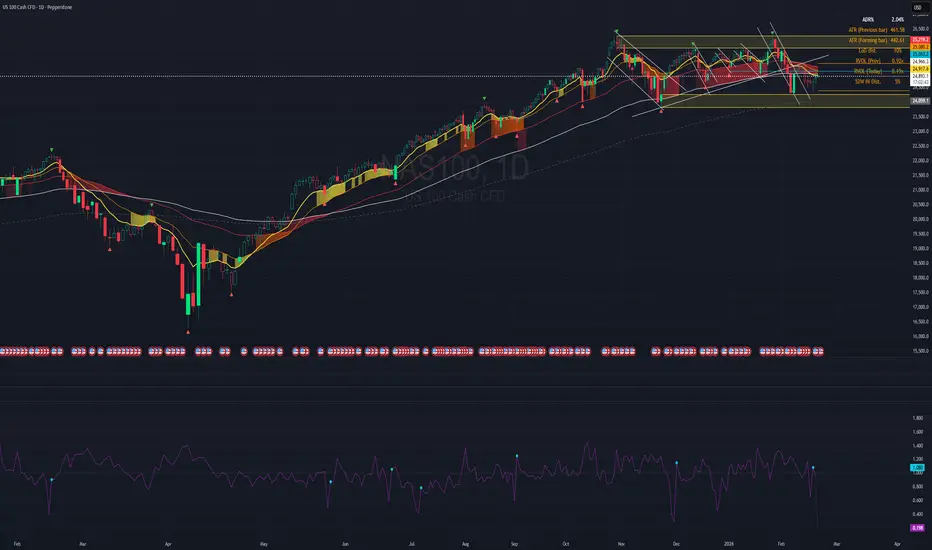
## Daily RVOL (Raw) SMA/EMA + Surge Marker (TP)
This indicator helps you spot **unusual institutional-style participation** by measuring **Daily Relative Volume (RVOL)** and highlighting **sudden RVOL “surges”** compared to the prior day.
### What it shows
**RVOL (raw)** is a ratio:
**RVOL = Today’s Daily Volume ÷ Average Daily Volume (lookback)**
* **1.00x** = normal volume
* **1.50x** = ~50% above normal
* **2.00x** = ~2x normal
The “Average Daily Volume” baseline can be calculated using either:
* **SMA** (simple average), or
* **EMA** (faster-reacting average)
The baseline uses **completed daily bars only**, so it won’t be distorted by a partially completed day.
### Surge Marker (Circle)
The circle prints when **today’s RVOL jumps significantly vs yesterday’s RVOL**:
**RVOL Surge % = (RVOL Today ÷ RVOL Prev − 1) × 100**
So if your surge threshold is **80%**, the circle triggers when:
**RVOL Today ≥ 1.80 × RVOL Prev**
This is meant to detect **volume acceleration**—not just “high volume,” but a **step-change** in participation.
### How to use it (in plain English)
Think of RVOL as a **crowd-size meter**, and the surge circle as a **“big money showed up today”** alert.
It does **not** directly label buy vs sell—it highlights **participation**. Direction comes from price action and context.
### Bullish vs Bearish clues (price + volume together)
Use the circle as a clue, then read the candle and key levels:
**Potential bullish signs**
* Breakout/reclaim of resistance + surge circle (strong confirmation)
* Strong up day (wide range, closes near highs) + surge circle
* **High volume down-close that *does NOT* break lower lows** (holds support)
→ Often means selling pressure was absorbed and price held the line. This can be a **bullish “support/absorption” tell**, especially if the next day confirms with strength.
**Potential bearish signs**
* Breakdown below support + surge circle (distribution confirmation)
* Rejection at resistance on surge circle (supply showing up)
* **High volume up-close that *fails to make higher highs* / can’t push through resistance**
→ Often suggests buying effort was met by strong supply (selling into strength). This can be a **bearish “stall/failure” tell**, especially if the next day confirms with weakness.
### Suggested settings
* **RVOL Length:** 20 is a solid default
* **SMA vs EMA:**
* SMA = smoother baseline
* EMA = reacts faster to recent volume changes
* **Surge Threshold:**
* **80–150%** = rare “shock” participation (fewer, stronger signals)
* **40–80%** = balanced signals
* **10–40%** = more signals, more noise
### Best practice
Use RVOL + surge circles as **confirmation**, not a standalone entry/exit:
* Combine with trend, support/resistance, and candle structure.
* The surge circle says **“participation surged”**—price action tells you **whether it’s accumulation (support) or distribution (supply).**
*(Educational use only. Not financial advice.)*
This indicator helps you spot **unusual institutional-style participation** by measuring **Daily Relative Volume (RVOL)** and highlighting **sudden RVOL “surges”** compared to the prior day.
### What it shows
**RVOL (raw)** is a ratio:
**RVOL = Today’s Daily Volume ÷ Average Daily Volume (lookback)**
* **1.00x** = normal volume
* **1.50x** = ~50% above normal
* **2.00x** = ~2x normal
The “Average Daily Volume” baseline can be calculated using either:
* **SMA** (simple average), or
* **EMA** (faster-reacting average)
The baseline uses **completed daily bars only**, so it won’t be distorted by a partially completed day.
### Surge Marker (Circle)
The circle prints when **today’s RVOL jumps significantly vs yesterday’s RVOL**:
**RVOL Surge % = (RVOL Today ÷ RVOL Prev − 1) × 100**
So if your surge threshold is **80%**, the circle triggers when:
**RVOL Today ≥ 1.80 × RVOL Prev**
This is meant to detect **volume acceleration**—not just “high volume,” but a **step-change** in participation.
### How to use it (in plain English)
Think of RVOL as a **crowd-size meter**, and the surge circle as a **“big money showed up today”** alert.
It does **not** directly label buy vs sell—it highlights **participation**. Direction comes from price action and context.
### Bullish vs Bearish clues (price + volume together)
Use the circle as a clue, then read the candle and key levels:
**Potential bullish signs**
* Breakout/reclaim of resistance + surge circle (strong confirmation)
* Strong up day (wide range, closes near highs) + surge circle
* **High volume down-close that *does NOT* break lower lows** (holds support)
→ Often means selling pressure was absorbed and price held the line. This can be a **bullish “support/absorption” tell**, especially if the next day confirms with strength.
**Potential bearish signs**
* Breakdown below support + surge circle (distribution confirmation)
* Rejection at resistance on surge circle (supply showing up)
* **High volume up-close that *fails to make higher highs* / can’t push through resistance**
→ Often suggests buying effort was met by strong supply (selling into strength). This can be a **bearish “stall/failure” tell**, especially if the next day confirms with weakness.
### Suggested settings
* **RVOL Length:** 20 is a solid default
* **SMA vs EMA:**
* SMA = smoother baseline
* EMA = reacts faster to recent volume changes
* **Surge Threshold:**
* **80–150%** = rare “shock” participation (fewer, stronger signals)
* **40–80%** = balanced signals
* **10–40%** = more signals, more noise
### Best practice
Use RVOL + surge circles as **confirmation**, not a standalone entry/exit:
* Combine with trend, support/resistance, and candle structure.
* The surge circle says **“participation surged”**—price action tells you **whether it’s accumulation (support) or distribution (supply).**
*(Educational use only. Not financial advice.)*
Информация о релизе
* The RVOL now **automatically matches your chart timeframe**.* On **Daily** charts, it shows **Daily RVOL**.
* On **Weekly** charts, it shows **Weekly RVOL**.
* On **Monthly** charts, it shows **Monthly RVOL**.
* If you’re on an **intraday chart** (like 5m/1h), it **still shows Daily RVOL** by default.
* It still updates **live during the current bar** (day/week/month): as volume keeps coming in, the RVOL value updates in real time.
* The “average” it compares against is based on **only fully finished past bars**, so the baseline stays clean and doesn’t get distorted by today/this week’s partial volume.
Информация о релизе
Screenshot updateИнформация о релизе
Added a “Forming Bar Opacity” setting that automatically fades the **latest (still-building) bar** on the RVOL line and surge circles, so you can visually tell the current live value is not finalized yet—while all completed bars stay fully solid.----
Additional findings: Sudden drop in RVOL signifies a reversal may it be upward or downward(sudden volume drying up preparing for a next decisive move)
Скрипт с открытым кодом
В истинном духе TradingView, создатель этого скрипта сделал его открытым исходным кодом, чтобы трейдеры могли проверить и убедиться в его функциональности. Браво автору! Вы можете использовать его бесплатно, но помните, что перепубликация кода подчиняется нашим Правилам поведения.

Отказ от ответственности
Информация и публикации не предназначены для предоставления и не являются финансовыми, инвестиционными, торговыми или другими видами советов или рекомендаций, предоставленных или одобренных TradingView. Подробнее читайте в Условиях использования.
Скрипт с открытым кодом
В истинном духе TradingView, создатель этого скрипта сделал его открытым исходным кодом, чтобы трейдеры могли проверить и убедиться в его функциональности. Браво автору! Вы можете использовать его бесплатно, но помните, что перепубликация кода подчиняется нашим Правилам поведения.
Отказ от ответственности
Информация и публикации не предназначены для предоставления и не являются финансовыми, инвестиционными, торговыми или другими видами советов или рекомендаций, предоставленных или одобренных TradingView. Подробнее читайте в Условиях использования.