Directional Change DC/OS + Regime
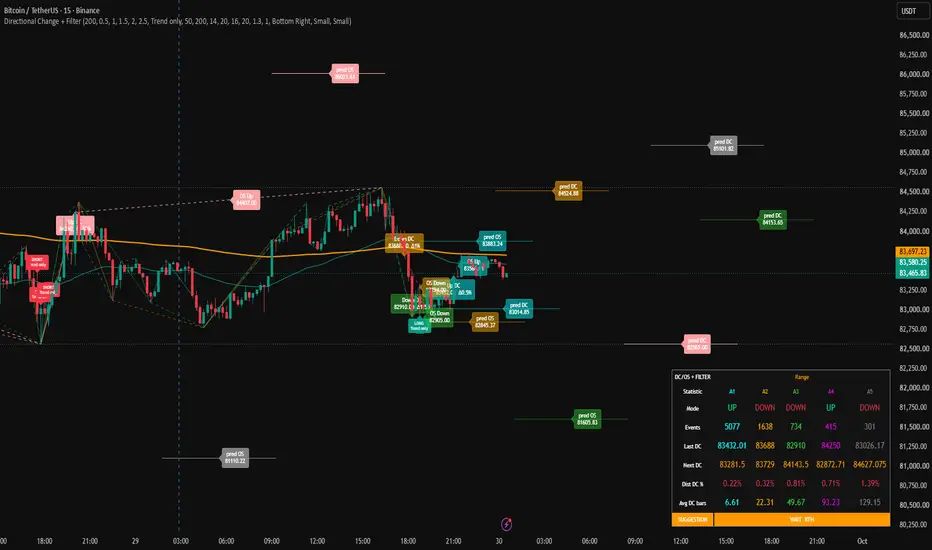
DC/OS Filter — Directional Change & Overshoot Observer
DC/OS Filter is a market-structure observation tool. It does not forecast price. It does not predict turns. It simply marks what has already happened in terms of Directional Change (DC) and Overshoot (OS) events, measures them, and — optionally — filters those observations through a regime context.
Everything you see on the chart is a record of a completed move. Nothing on the chart is a promise about the future.
What it observes
The indicator runs up to five independent agents, each with its own sensitivity threshold (0.5% / 1% / 2% / 5% / 10% by default). Each agent tracks price using the Directional Change / Overshoot event framework:
DC (Directional Change) — a reversal of at least δ% from the last extreme. This is a confirmed change of direction, measured after the fact.
OS (Overshoot) — a continuation beyond the last DC extreme, in the same direction. Also confirmed after the fact.
Every DC and OS is a historical event, plotted at the moment it completed — never before.
For each agent, the tool accumulates statistics on those events: event counts, average DC duration, average OS duration, average OS length, and the level at which the next DC would occur given the current extreme.
What the dashed "prediction" lines actually mean
The dashed horizontal lines labeled "pred DC" and "pred OS" are not forecasts.
They are arithmetic projections of the current observation state:
pred DC = the price at which a DC event would be confirmed if price were to reach it. It is derived purely from the current extreme and the agent's threshold.
pred OS = the price at which the next OS would be recorded, based on the historical average OS length of that agent.
The vertical placement of these lines on the time axis is derived from the agent's own historical average cycle time — how long, on average, past DC+OS cycles have taken to complete. It is a backward-looking average, not a forward-looking estimate.
If the market never reaches those levels, nothing happens. The lines are simply a reference grid showing where events would trigger, given today's structure.
The regime filter
The optional filter classifies the current environment into one of: Trend Up, Trend Down, Range, Chop, or Neutral, using:
EMA 50 / EMA 200 for directional bias
ADX for trend strength
A body-ratio chop detector
Optional RTH session gate (0930–1600)
Optional volume-spike requirement
Its purpose is to contextualize the DC/OS events — to say, "given the current regime, this observation is consistent with a trend continuation, or with a range boundary." It does not add information about the future. It only describes the present.
How to read it
Colors and labels — Every DC and OS is drawn with its own line, marker, and text label. Hover any label for full details: price, time, threshold, direction, event counts.
Dashboard — Per-agent statistics (mode, event count, last DC, next DC level, distance to next DC, average cycle length) are shown in a compact table. A SUGGESTION row summarizes the current observational state — again, a description, not a signal.
Prediction lines — Show where an event would be confirmed and roughly when, based on history. Treat them as reference levels, not targets.
Signal marks — When enabled, LONG/SHORT triangles mark moments where a completed DC or OS aligns with the current regime filter. These are confirmations of what the structure already did, not entries into what it will do.
What this indicator is not
Not a forecasting tool. It does not predict price, direction, or timing.
Not a signal generator in the traditional sense. The LONG/SHORT markers annotate completed structure, not anticipated structure.
Not a strategy. There are no entries, exits, or position sizing rules baked in.
Not a replacement for risk management. Observations are not advice.
Why this framing matters
Most indicators on TradingView are marketed as predictors. This one deliberately is not. Directional Change theory is fundamentally a descriptive framework — it defines events rigorously so they can be counted, measured, and compared. The value of the tool is in the discipline of that measurement:
It removes ambiguity about "when did the trend change?" — because a DC is a precisely defined event.
It lets you compare the same market across multiple sensitivities at once, so you can see the structure at different scales simultaneously.
It gives you a stable, statistics-based reference grid for the levels at which structure would change — so you can plan around them instead of guessing.
You are not being told what will happen. You are being shown what has happened, measured consistently, and laid out cleanly so you can make your own decision.
Settings overview
Agents 1–5 — Enable/disable, threshold %, colors. All five run independently.
Performance — Max bars to draw, chart drawings on/off, text on lines on/off.
Regime filter — Action mode (Off / Trend only / Range only), RTH, volume spike, EMA/ADX lengths, signal agent selection, bar-close confirmation.
Style — Dashboard position and size, line label size.
Notes and limitations
The tool is designed for 15-minute stock charts but works on any liquid instrument and timeframe.
Historical drawings are pruned beyond Max Bars to Draw to stay within TradingView object limits.
Prediction lines are recomputed on each DC event; they are state-driven, not time-driven, and will move as structure evolves.
Tooltips render at TradingView's standard size; only line label size is configurable.
NOT A FINANCIAL ADVICE ... ONLY FOR EDUCATIONAL PURPOSES
DC/OS Filter is a market-structure observation tool. It does not forecast price. It does not predict turns. It simply marks what has already happened in terms of Directional Change (DC) and Overshoot (OS) events, measures them, and — optionally — filters those observations through a regime context.
Everything you see on the chart is a record of a completed move. Nothing on the chart is a promise about the future.
What it observes
The indicator runs up to five independent agents, each with its own sensitivity threshold (0.5% / 1% / 2% / 5% / 10% by default). Each agent tracks price using the Directional Change / Overshoot event framework:
DC (Directional Change) — a reversal of at least δ% from the last extreme. This is a confirmed change of direction, measured after the fact.
OS (Overshoot) — a continuation beyond the last DC extreme, in the same direction. Also confirmed after the fact.
Every DC and OS is a historical event, plotted at the moment it completed — never before.
For each agent, the tool accumulates statistics on those events: event counts, average DC duration, average OS duration, average OS length, and the level at which the next DC would occur given the current extreme.
What the dashed "prediction" lines actually mean
The dashed horizontal lines labeled "pred DC" and "pred OS" are not forecasts.
They are arithmetic projections of the current observation state:
pred DC = the price at which a DC event would be confirmed if price were to reach it. It is derived purely from the current extreme and the agent's threshold.
pred OS = the price at which the next OS would be recorded, based on the historical average OS length of that agent.
The vertical placement of these lines on the time axis is derived from the agent's own historical average cycle time — how long, on average, past DC+OS cycles have taken to complete. It is a backward-looking average, not a forward-looking estimate.
If the market never reaches those levels, nothing happens. The lines are simply a reference grid showing where events would trigger, given today's structure.
The regime filter
The optional filter classifies the current environment into one of: Trend Up, Trend Down, Range, Chop, or Neutral, using:
EMA 50 / EMA 200 for directional bias
ADX for trend strength
A body-ratio chop detector
Optional RTH session gate (0930–1600)
Optional volume-spike requirement
Its purpose is to contextualize the DC/OS events — to say, "given the current regime, this observation is consistent with a trend continuation, or with a range boundary." It does not add information about the future. It only describes the present.
How to read it
Colors and labels — Every DC and OS is drawn with its own line, marker, and text label. Hover any label for full details: price, time, threshold, direction, event counts.
Dashboard — Per-agent statistics (mode, event count, last DC, next DC level, distance to next DC, average cycle length) are shown in a compact table. A SUGGESTION row summarizes the current observational state — again, a description, not a signal.
Prediction lines — Show where an event would be confirmed and roughly when, based on history. Treat them as reference levels, not targets.
Signal marks — When enabled, LONG/SHORT triangles mark moments where a completed DC or OS aligns with the current regime filter. These are confirmations of what the structure already did, not entries into what it will do.
What this indicator is not
Not a forecasting tool. It does not predict price, direction, or timing.
Not a signal generator in the traditional sense. The LONG/SHORT markers annotate completed structure, not anticipated structure.
Not a strategy. There are no entries, exits, or position sizing rules baked in.
Not a replacement for risk management. Observations are not advice.
Why this framing matters
Most indicators on TradingView are marketed as predictors. This one deliberately is not. Directional Change theory is fundamentally a descriptive framework — it defines events rigorously so they can be counted, measured, and compared. The value of the tool is in the discipline of that measurement:
It removes ambiguity about "when did the trend change?" — because a DC is a precisely defined event.
It lets you compare the same market across multiple sensitivities at once, so you can see the structure at different scales simultaneously.
It gives you a stable, statistics-based reference grid for the levels at which structure would change — so you can plan around them instead of guessing.
You are not being told what will happen. You are being shown what has happened, measured consistently, and laid out cleanly so you can make your own decision.
Settings overview
Agents 1–5 — Enable/disable, threshold %, colors. All five run independently.
Performance — Max bars to draw, chart drawings on/off, text on lines on/off.
Regime filter — Action mode (Off / Trend only / Range only), RTH, volume spike, EMA/ADX lengths, signal agent selection, bar-close confirmation.
Style — Dashboard position and size, line label size.
Notes and limitations
The tool is designed for 15-minute stock charts but works on any liquid instrument and timeframe.
Historical drawings are pruned beyond Max Bars to Draw to stay within TradingView object limits.
Prediction lines are recomputed on each DC event; they are state-driven, not time-driven, and will move as structure evolves.
Tooltips render at TradingView's standard size; only line label size is configurable.
NOT A FINANCIAL ADVICE ... ONLY FOR EDUCATIONAL PURPOSES

Отказ от ответственности
Информация и публикации не предназначены для предоставления и не являются финансовыми, инвестиционными, торговыми или другими видами советов или рекомендаций, предоставленных или одобренных TradingView. Подробнее читайте в Условиях использования.
Отказ от ответственности
Информация и публикации не предназначены для предоставления и не являются финансовыми, инвестиционными, торговыми или другими видами советов или рекомендаций, предоставленных или одобренных TradingView. Подробнее читайте в Условиях использования.