Liquidity Volume Profile
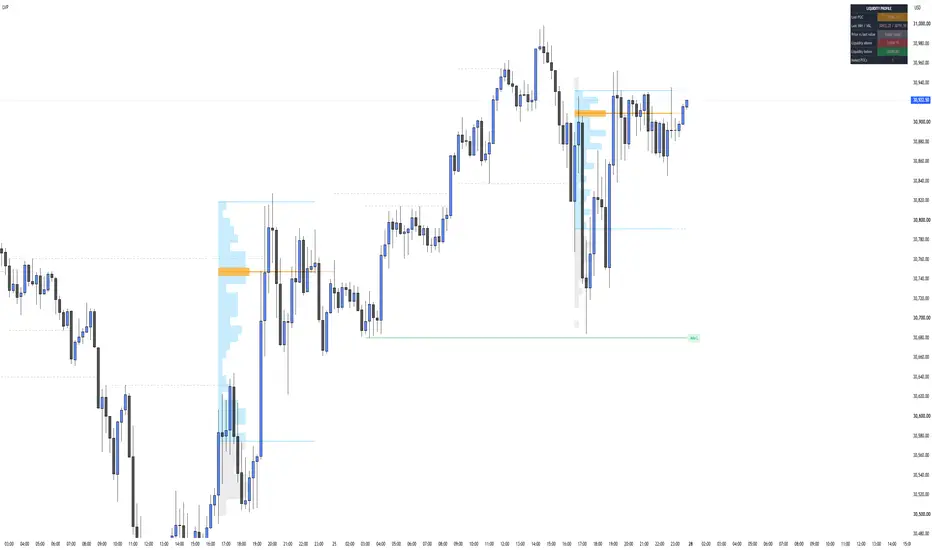
Liquidity Volume Profile builds a session volume profile and combines it with the liquidity levels intraday traders watch most, in one clean indicator.
Session profile:
- Volume profile for each NY session (09:30-16:00) or the full day
- Point of Control (POC), Value Area High and Low (default 70%)
- Developing profile for the current session, updated in real time
- Volume is distributed using a lower timeframe (1 minute by default) for better precision than chart bars alone
Profile levels:
- Previous session VAH / VAL extended into the next session
- Naked POCs: each POC stays extended until price trades back to it
Liquidity:
- Asia high/low, London high/low and previous day high/low
- Unswept levels stay active with a label; once price trades through a level it turns into a short dashed line
Dashboard:
- Developing and last POC / VAH / VAL
- Price position relative to the last value area (above, inside, below)
- Nearest unswept liquidity above and below
- Number of active naked POCs
Alerts:
- Buy-side liquidity swept
- Sell-side liquidity swept
- Naked POC touched
Settings:
Session times, timezone, number of rows, value area %, precision timeframe, histogram width, colors and which liquidity levels to show can all be changed.
Notes:
- Volume is distributed evenly across each lower-timeframe bar's range, so the profile is an approximation of true tick-level volume.
- Designed for index futures such as NQ/MNQ and ES/MES on intraday charts, but it works on any symbol with volume data.
- This is an analysis tool, not financial advice or a trading signal.
Session profile:
- Volume profile for each NY session (09:30-16:00) or the full day
- Point of Control (POC), Value Area High and Low (default 70%)
- Developing profile for the current session, updated in real time
- Volume is distributed using a lower timeframe (1 minute by default) for better precision than chart bars alone
Profile levels:
- Previous session VAH / VAL extended into the next session
- Naked POCs: each POC stays extended until price trades back to it
Liquidity:
- Asia high/low, London high/low and previous day high/low
- Unswept levels stay active with a label; once price trades through a level it turns into a short dashed line
Dashboard:
- Developing and last POC / VAH / VAL
- Price position relative to the last value area (above, inside, below)
- Nearest unswept liquidity above and below
- Number of active naked POCs
Alerts:
- Buy-side liquidity swept
- Sell-side liquidity swept
- Naked POC touched
Settings:
Session times, timezone, number of rows, value area %, precision timeframe, histogram width, colors and which liquidity levels to show can all be changed.
Notes:
- Volume is distributed evenly across each lower-timeframe bar's range, so the profile is an approximation of true tick-level volume.
- Designed for index futures such as NQ/MNQ and ES/MES on intraday charts, but it works on any symbol with volume data.
- This is an analysis tool, not financial advice or a trading signal.

Отказ от ответственности
Информация и публикации не предназначены для предоставления и не являются финансовыми, инвестиционными, торговыми или другими видами советов или рекомендаций, предоставленных или одобренных TradingView. Подробнее читайте в Условиях использования.
Отказ от ответственности
Информация и публикации не предназначены для предоставления и не являются финансовыми, инвестиционными, торговыми или другими видами советов или рекомендаций, предоставленных или одобренных TradingView. Подробнее читайте в Условиях использования.