Market Weather: Volatility Forecast
█ Overview
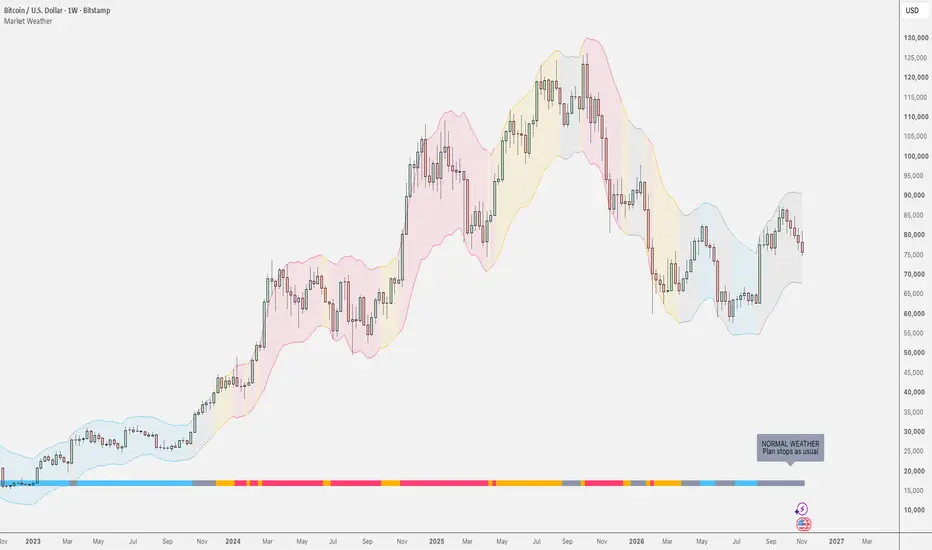
Market Weather is a volatility forecast indicator for TradingView. It shows how stormy the market is right now and how big the next candles are likely to be, before they appear. A colored ribbon along the bottom of the chart works like a weather map, and a channel around price widens in a storm and tightens when calm.
Volatility comes in clusters: big candles tend to follow big candles, and quiet candles tend to follow quiet ones. The indicator measures this with two ATR readings and turns it into four weather levels. It forecasts the size of moves, not their direction. Buy and sell decisions stay with you.
All readings are taken on closed bars, so nothing repaints and the live bar shows exactly what history shows.
It works on crypto, forex, stocks, indices and futures, on any timeframe.

▌ Weather ribbon
A row of small squares along the bottom of the pane, one per bar across the whole chart. The color is the weather at that bar:
▌ Expected-range channel
A shaded channel around a smooth average of price (10-bar EMA). Its width is the typical high-to-low range of the next 10 bars. It widens when volatility is rising and tightens when it fades. The channel takes the color of the current weather, so the whole history shows when the market was quiet and when it woke up.
▌ Forecast label
A two-line label sits near the bottom of the chart, above the ribbon and a few bars left of the last candle, so it never covers price. It names the weather and says what to do with it, for example "STORM: BIG MOVES LIKELY" and "Wider stops, smaller size".

█ How It Works
█ How to Use
█ Settings
Display
There are no other settings on purpose. The thresholds and lengths are fixed.
█ Alerts
Use "Once Per Bar Close". All alerts follow the current bar only.
█ Good to Know
█ Disclaimer
This indicator is an analytical and educational tool. It is not financial advice and does not guarantee future results. You are responsible for your own trading decisions.
Market Weather is a volatility forecast indicator for TradingView. It shows how stormy the market is right now and how big the next candles are likely to be, before they appear. A colored ribbon along the bottom of the chart works like a weather map, and a channel around price widens in a storm and tightens when calm.
Volatility comes in clusters: big candles tend to follow big candles, and quiet candles tend to follow quiet ones. The indicator measures this with two ATR readings and turns it into four weather levels. It forecasts the size of moves, not their direction. Buy and sell decisions stay with you.
All readings are taken on closed bars, so nothing repaints and the live bar shows exactly what history shows.
It works on crypto, forex, stocks, indices and futures, on any timeframe.
▌ Weather ribbon
A row of small squares along the bottom of the pane, one per bar across the whole chart. The color is the weather at that bar:
- Blue (CALM): volatility is below its normal level. Candles are small.
- Grey (NORMAL): volatility is about average.
- Amber (BUILDING): volatility is rising. Candles are getting bigger.
- Red (STORM): volatility is high. Big candles are likely.
▌ Expected-range channel
A shaded channel around a smooth average of price (10-bar EMA). Its width is the typical high-to-low range of the next 10 bars. It widens when volatility is rising and tightens when it fades. The channel takes the color of the current weather, so the whole history shows when the market was quiet and when it woke up.
▌ Forecast label
A two-line label sits near the bottom of the chart, above the ribbon and a few bars left of the last candle, so it never covers price. It names the weather and says what to do with it, for example "STORM: BIG MOVES LIKELY" and "Wider stops, smaller size".
█ How It Works
- Fast volatility: ATR over 5 bars.
- Slow volatility: ATR over 50 bars.
- Weather: ratio = fast ATR ÷ slow ATR. Below 0.8 is CALM, 0.8 to 1.0 is NORMAL, 1.0 to 1.25 is BUILDING, and above 1.25 is STORM.
- Channel width: the typical high-to-low range of the next 10 bars is estimated as 1.83 + 1.73 × ratio, in units of slow ATR (the ratio is limited to 0.6 to 1.8). The channel half-width is half of that. The line was fitted on historical data from stocks, gold, crypto and forex, and it describes a typical range, not a limit.
- Closed bars only: the ratio, the weather and the channel update on the close of each bar. During the open bar the last closed reading is shown.
- Direction: nothing in the calculation looks at the direction of price.
█ How to Use
- Set stops and size: in a STORM, wider stops and a smaller position keep risk steady. In CALM, tighter stops fit.
- Watch for BUILDING: the first amber squares are an early warning that moves are getting bigger.
- Respect calm: quiet periods often end quickly, and the label says so.
- Compare markets: switch symbol or timeframe to see which markets are stormy and which are quiet.
- Combine with your own analysis: entries, levels, structure and risk rules remain yours. Market Weather supplies information about the size of moves, and the decision of whether and how to act stays with the trader.
- Use the alerts: set alerts for storms, calm and building volatility, so the chart does not need to be watched.
█ Settings
Display
- Show expected-range channel (on): the shaded channel and its edges.
- Show weather ribbon (bottom) (on): the row of colored squares.
- Show forecast label (on): the two-line label near the bottom.
There are no other settings on purpose. The thresholds and lengths are fixed.
█ Alerts
- Storm: volatility is high: fires at bar close when the weather turns to STORM.
- Calm: volatility is low: fires at bar close when the weather turns to CALM.
- Storm building: fires at bar close when the weather first reaches BUILDING or STORM.
Use "Once Per Bar Close". All alerts follow the current bar only.
█ Good to Know
- Size, not direction: the forecast is about how big candles are likely to be. It does not say whether price will rise or fall.
- News: scheduled and surprise news can cause moves that the forecast cannot foresee.
- Warm-up: the first 50 bars of a chart have no reading while the slow ATR is built.
- Chart types: use regular candles or bars. On Heikin Ashi, Renko and similar chart types the values come from synthetic prices.
- Not a strategy: this is an indicator. No backtest, win rate or profit figures are published or implied.
█ Disclaimer
This indicator is an analytical and educational tool. It is not financial advice and does not guarantee future results. You are responsible for your own trading decisions.

🔻🔻🔻🔻🔻🔻🔻🔻🔻🔻🔻🔻🔻🔻🔻🔻🔻🔻🔻
📊 Free Tools: minimalisttrading.com/tools
👨🏫 Free Education: minimalisttrading.com/learn
📈 Trading Indicators: minimalisttrading.com
🔺🔺🔺🔺🔺🔺🔺🔺🔺🔺🔺🔺🔺🔺🔺🔺🔺🔺🔺
📊 Free Tools: minimalisttrading.com/tools
👨🏫 Free Education: minimalisttrading.com/learn
📈 Trading Indicators: minimalisttrading.com
🔺🔺🔺🔺🔺🔺🔺🔺🔺🔺🔺🔺🔺🔺🔺🔺🔺🔺🔺
Отказ от ответственности
Информация и публикации не предназначены для предоставления и не являются финансовыми, инвестиционными, торговыми или другими видами советов или рекомендаций, предоставленных или одобренных TradingView. Подробнее читайте в Условиях использования.
🔻🔻🔻🔻🔻🔻🔻🔻🔻🔻🔻🔻🔻🔻🔻🔻🔻🔻🔻
📊 Free Tools: minimalisttrading.com/tools
👨🏫 Free Education: minimalisttrading.com/learn
📈 Trading Indicators: minimalisttrading.com
🔺🔺🔺🔺🔺🔺🔺🔺🔺🔺🔺🔺🔺🔺🔺🔺🔺🔺🔺
📊 Free Tools: minimalisttrading.com/tools
👨🏫 Free Education: minimalisttrading.com/learn
📈 Trading Indicators: minimalisttrading.com
🔺🔺🔺🔺🔺🔺🔺🔺🔺🔺🔺🔺🔺🔺🔺🔺🔺🔺🔺
Отказ от ответственности
Информация и публикации не предназначены для предоставления и не являются финансовыми, инвестиционными, торговыми или другими видами советов или рекомендаций, предоставленных или одобренных TradingView. Подробнее читайте в Условиях использования.