OPEN-SOURCE SCRIPT
Historical Returns [BigBeluga]
🔵 OVERVIEW
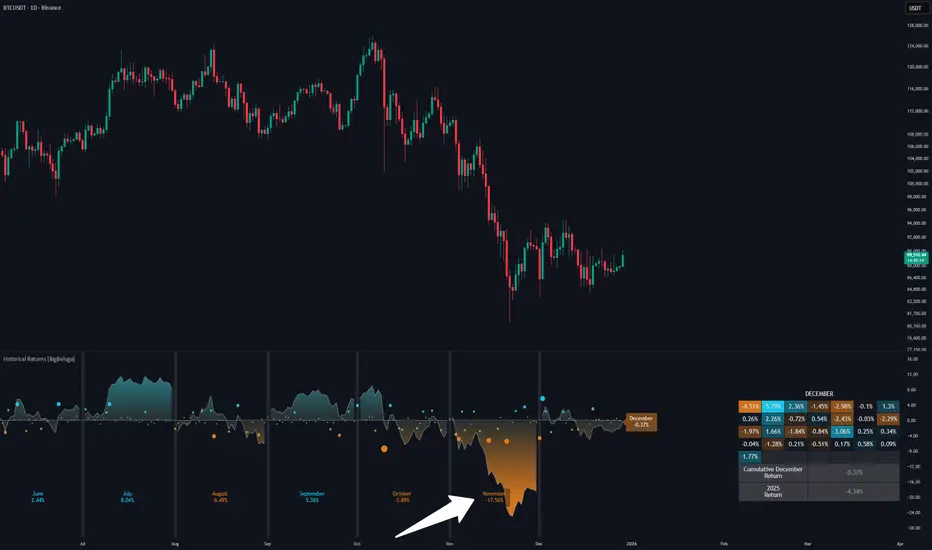
The Historical Returns [BigBeluga] indicator visualizes daily and monthly return data to help traders assess seasonal performance and volatility behavior. It provides a clean and informative dashboard showing the current month’s daily return bubbles, monthly return curves, and a snapshot of the current month and year performance. This tool is ideal for spotting recurring return patterns and understanding the broader profitability context of a symbol.
🔵 CONCEPTS
🔵 FEATURES
🔵 HOW TO USE
🔵 CONCLUSION
Historical Returns [BigBeluga] is your visual companion for return analytics — helping you identify profitable months, detect volatility surges, and understand historical seasonality at a glance. With a clean dashboard and insightful overlays, this tool supports better timing and improved statistical edge in both short- and long-term trades.
The Historical Returns [BigBeluga] indicator visualizes daily and monthly return data to help traders assess seasonal performance and volatility behavior. It provides a clean and informative dashboard showing the current month’s daily return bubbles, monthly return curves, and a snapshot of the current month and year performance. This tool is ideal for spotting recurring return patterns and understanding the broader profitability context of a symbol.
🔵 CONCEPTS
- Daily Return Bubbles: Each trading day is analyzed for its return percentage, and plotted as a bubble with size proportional to the return magnitude.
- Monthly Performance Curves: Average or cumulative returns are calculated and plotted to show how the current month is performing relative to historical averages.
- Current Year Return: Current year performance as a single return value, giving traders context on long-term profitability.
- Current Month Average Return: Current month average performance as a single return value, giving traders context on short-term profitability.
- Extreme Return Labels: Optionally highlights daily returns above +4% or below -4% with labeled percentages for spike recognition.
🔵 FEATURES
- Shows daily return bubbles (1%–7%+), color-coded by direction.
- Labels monthly returns with the month name and percentage value.
- Displays a performance dashboard with:
- Daily return heatmap for the current month.
- Average return for the current month.
- Year-to-date return.
- Toggle between average and cumulative modes for monthly return curves.
- Clearly marks days with abnormal return spikes using optional labels.
- Clean fallback warning if not on a daily chart ("⚠️USE DAILY TIMEFRAME").
- Custom color themes for bullish and bearish values.
🔵 HOW TO USE
- Use the monthly return curve to compare how the current month is performing against historical averages.
- Look for clusters of positive or negative bubbles as signals of strong directional weeks.
- Watch extreme return labels for volatility spikes or catalyst days.
- Use year-to-date return to assess how the asset is trending in the broader macro cycle.
- Combine with other BigBeluga tools to align trades with historically favorable periods.
🔵 CONCLUSION
Historical Returns [BigBeluga] is your visual companion for return analytics — helping you identify profitable months, detect volatility surges, and understand historical seasonality at a glance. With a clean dashboard and insightful overlays, this tool supports better timing and improved statistical edge in both short- and long-term trades.
Скрипт с открытым кодом
В истинном духе TradingView, создатель этого скрипта сделал его открытым исходным кодом, чтобы трейдеры могли проверить и убедиться в его функциональности. Браво автору! Вы можете использовать его бесплатно, но помните, что перепубликация кода подчиняется нашим Правилам поведения.

🌐 bigbeluga.org/tv - Get access to our powerful tools & indicators.
🔵 Learn More -> docs.bigbeluga.org/
🔵 Join Discord -> go.bigbeluga.org/k65q9bfqfu
All content provided by BigBeluga is for educational purposes only
🔵 Learn More -> docs.bigbeluga.org/
🔵 Join Discord -> go.bigbeluga.org/k65q9bfqfu
All content provided by BigBeluga is for educational purposes only
Отказ от ответственности
Информация и публикации не предназначены для предоставления и не являются финансовыми, инвестиционными, торговыми или другими видами советов или рекомендаций, предоставленных или одобренных TradingView. Подробнее читайте в Условиях использования.
Скрипт с открытым кодом
В истинном духе TradingView, создатель этого скрипта сделал его открытым исходным кодом, чтобы трейдеры могли проверить и убедиться в его функциональности. Браво автору! Вы можете использовать его бесплатно, но помните, что перепубликация кода подчиняется нашим Правилам поведения.
🌐 bigbeluga.org/tv - Get access to our powerful tools & indicators.
🔵 Learn More -> docs.bigbeluga.org/
🔵 Join Discord -> go.bigbeluga.org/k65q9bfqfu
All content provided by BigBeluga is for educational purposes only
🔵 Learn More -> docs.bigbeluga.org/
🔵 Join Discord -> go.bigbeluga.org/k65q9bfqfu
All content provided by BigBeluga is for educational purposes only
Отказ от ответственности
Информация и публикации не предназначены для предоставления и не являются финансовыми, инвестиционными, торговыми или другими видами советов или рекомендаций, предоставленных или одобренных TradingView. Подробнее читайте в Условиях использования.