NYAM open levelsThe highest high and lowest low. NYAM if you wanna be profitable use this indicatior u crazy mfs Индикаторот SpankkyyTV4
Stock Option Seller - Open Road ## 📌 Description — Open Road · Option Seller **Open Road · Option Seller** is a structured decision-support indicator designed for **systematic option sellers** trading monthly credit spreads on large-cap Indian equities. It converts price action, momentum, and volatility into a **clear, rules-based structure selection**: * **Put Credit Spread** * **Call Credit Spread** * **Iron Condor** * **Wait (no trade)** The goal is simple: Remove discretion and provide a **repeatable framework for dirИндикаторот distinctSeahor2028714
The-go-Giver - wma45RSI v2The-go-Giver - wma45RSI rsi ema9(rsi) wma45(rsi) Using rsi, ema9, wma45 to catch form buy, sell, or out of market Индикаторот Thegogiver17
MVSH Fractal Alignment System StrategyThe script is based on the 3-candle fractal pattern using two timeframes: daily and 30 minutes. highly successful on EURUSD and GBPUSDСтратегияот LVWD_MVSH15
VCP Historical Score Histogram PM📊 VCP Historical Score Histogram The VCP Historical Score Histogram is a specialized companion tool to the Pro Dashboard, designed to visualize the "silent" contraction of volatility over the history of a stock. While standard price action can look random, the VCP Score reveals the underlying institutional accumulation and the precise moments when a stock becomes "tight" enough to explode. 🔍 Why Use the Histogram? VCP (Volatility Contraction Pattern) trading is all about timing. This indicatoИндикаторот Forex_Trading_Karnataka63
Trend Energy Filter 🚀 Trend Energy Filter Introducing a new dimension in trend analysis: Trend Energy. In automotive systems (like ECU sensor data), we use hysteresis and noise-gates to prevent "jitter" from triggering false responses. This script applies that same logic to Momentum (Trend Energy): ENERGY: Measures the "Engine Load" of the trend by calculating the distance from a long-term SMA. NOISE FILTER: Uses an ATR-based threshold. The Energy value only updates if the change is significant, effИндикаторот TheRealHawk61
NQ 5m StructureThis indicator combines four core SMC/ICT concepts into one clean, minimal overlay — designed for NQ and MNQ futures traders on the 5m chart. Swing Rays Confirms pivot highs and lows using configurable swing length. Each confirmed point prints a short dashed ray extending right — marking unmitigated structural levels without cluttering the chart with infinite lines. Auto Fib Retracement Automatically anchors a Fibonacci retracement to the most recent confirmed swing leg. Draws 0 / 0.382 / 0.5 / Индикаторот plyboylu28
OpenRoad_NiftyOptions **Open Road V3 — NIFTY Weekly Option Selling Framework** A rules-based, regime-aware indicator for NIFTY 50 weekly option sellers. Built from 3 years of backtested data (Apr 2023–Apr 2026), this framework tells you *what* to sell, *where* to sell it, and *when to sit out* — every Wednesday morning. **How It Works** The indicator runs two engines: *Engine A — Weekly Directional Spreads* Uses a V2 Regime Filter (2-of-3 vote system) to determine market direction, then generates exact credit sИндикаторот distinctSeahor2028714
Vegas Tunnel REAL MTF SMOOTHThe Vegas Tunnel REAL MTF SMOOTH is a multi-timeframe trend structure based on the classic Vegas Tunnel EMAs (144 / 169), enhanced with real higher-timeframe data and additional smoothing to eliminate step-like movements. 🔹 Concept This indicator combines multiple timeframes into a single chart, allowing traders to clearly identify market structure, trend direction, and potential entry zones. Included tunnels: Chart Timeframe – execution & timing ×5 Timeframe – short-term trend ×15 TimeframeИндикаторот Sachse-1980Обновлено 31
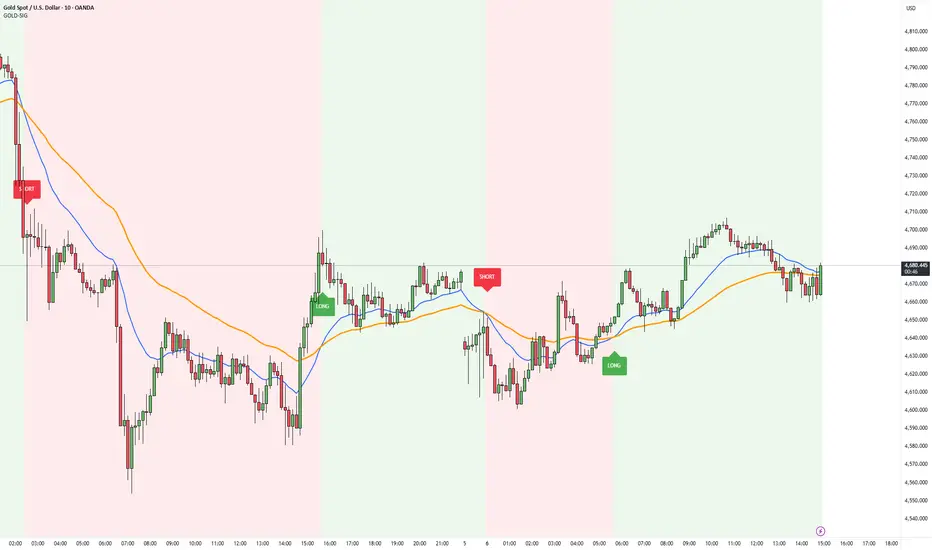
Gold Trend Signal Indicator📋 Trading Rules (For XAUUSD M10 Chart) 1. Entry Rules Long Entry: Enter a long position immediately when the green LONG label appears (20EMA crosses above 50EMA, uptrend confirmed). Short Entry: Enter a short position immediately when the red SHORT label appears (20EMA crosses below 50EMA, downtrend confirmed). 2. Stop-Loss Rules Long Stop-Loss: Place stop-loss order below the 50EMA line (adjust based on your risk tolerance, e.g., 0.5-1% below the line). Short Stop-Loss: Place stop-loss orИндикаторот CsmillrSirrry175
Artemis Oscillator PROArtemis Oscillator PRO is a momentum oscillator built on a custom Directional Range Momentum (DRM) engine — an original algorithm that measures signed range impulse, not price distance. Unlike RSI or Stochastic, DRM scores the direction and force of range expansion relative to its own history, normalized to 0–100. The result is an oscillator that reacts cleanly to structural momentum shifts without the lag inherent in traditional smoothed-ratio oscillators. The indicator integrates five analytИндикаторот a_jabbaroffОбновлено 29 1.8 K
Nifty Institutional Trend Rider omHow this manages your "Big Lots" and "Cutting": High Conviction Entry: It only enters CE when the RSI is above 60. This means you aren't just guessing; you are entering when momentum is already strong. The "VWAP" Guard: Big players (FIIs/DIIs) use VWAP. By staying on the same side as VWAP, you avoid being "trapped" by big institutional sell-offs. Automatic "Cutting" (Trailing SL): The red line that appears on your chart when you are in a trade is your Trailing Stop Loss. Стратегияот sojiritesh200318
Sonic R + ComboThis is a very Line in in scripts, you have to select this line and this line is progressing with Fibonach Digits want to just developed more this script to specify the buy and sell pointsИндикаторот alamosmithi607812
Absorption Detector 2.0Detects institutional absorption patterns where large orders defend key price levels. Approximates order flow concepts using standard OHLCV data — no Level 2 or DOM data required. What is Absorption? Absorption occurs when one side of the market (buyers or sellers) aggressively attacks a price level, but price refuses to move. This happens because a large institutional order is sitting at that level, absorbing all incoming market orders. It's one of the strongest signals of institutional defenИндикаторот YUHUNGTsai1259
XAUUSD Strong Reversal Probability by kimmoney making. dfknsgbjowdbv dbpjfnpkdvn dav b apdkv pkvn dgvnwegkvnw evg v;pkwegnpwegИндикаторот kimchitradesss126
SMA 20, 50, 200Sure, if you want a professional English description for your script to keep your TradingView workspace clean and standard, here is a concise and technical version you can use. You can paste this directly into the description parameter of your indicator function: English Description for your Script: Title: MNQ Trend Following SMA Trio (20/50/200) Description: > This indicator is designed specifically for Micro E-mini Nasdaq-100 (MNQ) futures trading. It utilizes three Simple Moving Averages (Индикаторот uthi3u10
DTT Time based Ranges CVLT @CVLTraders · · Aug 14, 2025 Fibonacci using Like ICT said: Algo runs 20-30% of the range So we can project Turtle Soup Fibo on your TPD ( -0.1, -0.2, -0.3, -0.4, -0.5 STD ) to catch the Turtle Soup Entry while sSMT occurs OR you can use C2 as your Dealing Range and work with it on LTFИндикаторот provancha33822126
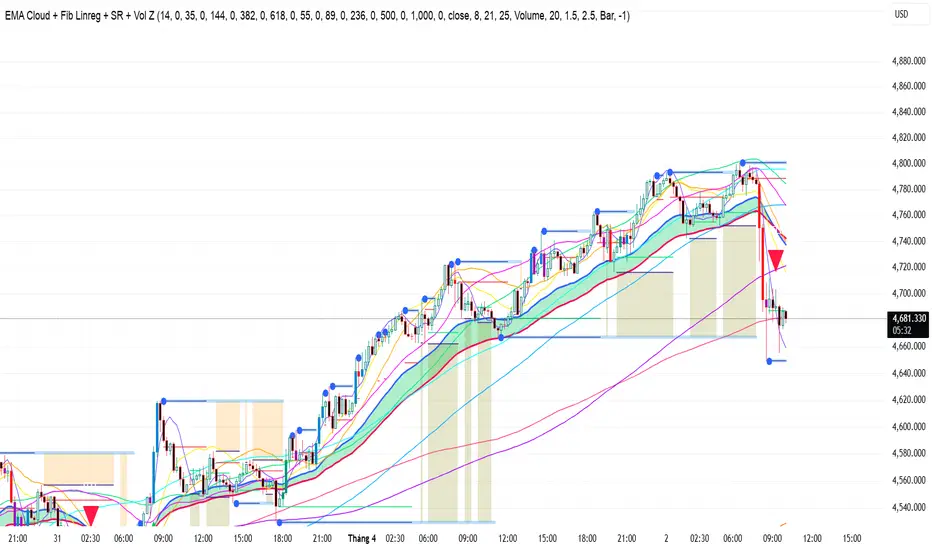
hungf10 Fibonacci Linreg + SR + VolThis is a very Line in in scripts, you have to select this line and this line is progressing with Fibonach Digits want to just developed more this script to specify the buy and sell pointsИндикаторот alamosmithi607811
Checklist FelipeFx95 Riesgo, Noticias, Ny, PD4, Chock. Checklist FelipeFx95 Riesgo, Noticias, Ny, PD4, Chock. Индикаторот mtormu10130
VRP IV vs Realised Vol **Indicator name:** VRP — IV vs Realised Vol --- **What it calculates:** **Line 1 — India VIX (IV)** It pulls the daily closing value of India VIX directly from TradingView using `request.security("INDIAVIX", "D", close)`. This is your implied volatility — what the market expects NIFTY to move annually. **Line 2 — 20-day Realised Volatility (RV)** It calculates the actual movement of NIFTY over the past 20 trading days using log returns. The formula is: standard deviation of daily log returИндикаторот distinctSeahor20287118
Green and Red Candles following EMAThis indicator showing candles in Green when the trend is bullish and Red when the trend is Bearish. The label also marking the range of each swing. Индикаторот Bonus79Обновлено 9667
MTF Momentum Heatmap A visual momentum heatmap that displays 10 bands of price momentum across different lookback periods, from fast (short-term) to slow (long-term). Inspired by professional momentum heatmap indicators. How it works: Each horizontal band represents a different momentum lookback period. The bottom band is the fastest (shortest period), and the top band is the slowest (longest period). Momentum is calculated as the normalized rate of change, smoothed to reduce noise. Color Scale: - Red / Orange / Индикаторот YUHUNGTsai7
Exhaustion Detector Detects potential trend exhaustion using volume spikes combined with rejection wicks. How it works: The indicator uses a scoring system (0-6) that evaluates each candle across four dimensions: volume intensity relative to average, wick length relative to body size, candle close position, and prior trend context. A score of 4+ triggers a standard signal, 5+ triggers a strong signal. Bullish Exhaustion (bottom): After a downtrend, price shows a long lower wick with high volume and closes near theИндикаторот YUHUNGTsai1630