Индикатор
Индикаторы ширины рынка

Индикатор

Target Fusion Overlay TheGutixxTheGutixx Fusion Overlay es un indicador avanzado de análisis técnico diseñado para combinar en una sola herramienta la fuerza del RSI Trend, la estructura de tendencia mediante EMA 9/21 y un sistema visual de objetivos de precio.
Este indicador ayuda a identificar posibles oportunidades de mercado mediante la combinación de momentum, dirección de tendencia y estructura del precio, mostrando señales visuales directamente sobre el gráfico.
Características principales:
✅ RSI Trend Integration
D
Индикатор

Bystry Counter Strike Style + PVSRABystry Counter Strike Style + PVSRA
This indicator is a breakout and trade-management tool designed to help traders visualize potential long and short strike zones, dynamic profit targets, stop levels, and volume-based candle context directly on the chart.
The script combines four main components:
1. Dynamic Strike Channel
The indicator builds a dynamic price channel using recent market structure. The upper boundary represents a potential long breakout area, while the lower boundary repres
Индикатор

Bystry Prime-Style Oscillator ProBystry Prime-Style Oscillator Pro is a multi-layer momentum, money-flow and volume oscillator designed to help traders read market pressure, exhaustion zones and potential momentum shifts in a clean oscillator panel.
This indicator is an original Pine Script v6 tool. It is not affiliated with, endorsed by, or intended to reproduce any proprietary or closed-source indicator. The goal of this script is to provide a transparent, self-contained oscillator framework that combines momentum, volume pr
Индикатор

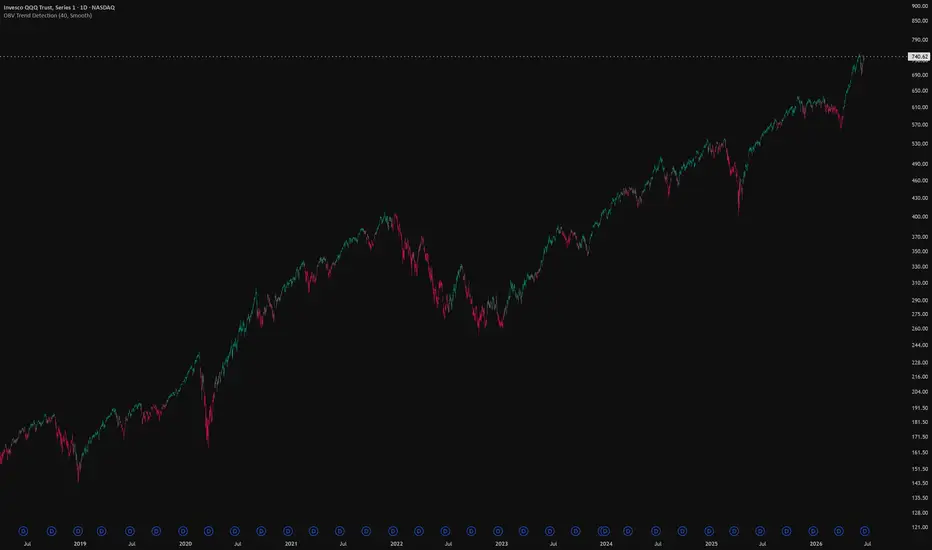
OBV Trend CandlesOBV Trend Candles
This indicator colors your candles based on the relationship between On-Balance Volume (OBV) and a moving average of OBV. It's a simple way to keep volume-based trend context visible directly on the price chart, without having to watch a separate OBV pane.
How it works
OBV accumulates volume on up-closes and subtracts it on down-closes, so a rising OBV means volume is flowing into the asset and a falling OBV means it's flowing out. This script takes that OBV line and comp
Индикатор
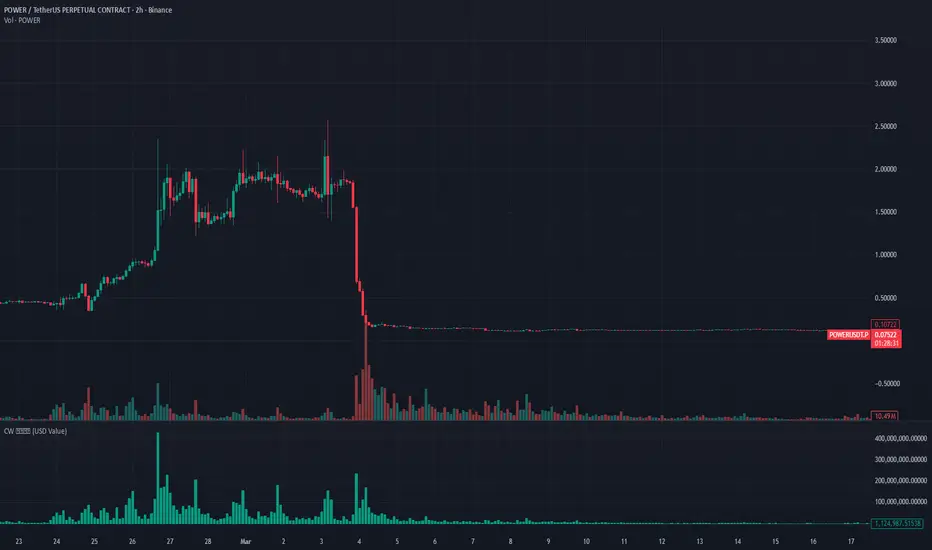
Closewinter Volume ValueThe Illusion of Token Count vs. Actual Capital Volume
To put it simply, the critical limitation of traditional volume indicators is that they fail to account for price changes and only display the absolute number of tokens traded.
For instance, buying $100 worth of an asset at $1 generates 100 tokens. However, buying $100 worth at $10 generates only 10 tokens. Even though the exact same amount of capital was deployed, the number of filled tokens varies depending on the price.
The inherent fla
Индикатор
Sessions Suite [claysul] + FVGSessions Suite + FVG + Market Structure — Warsaw Time
Sessions Suite + FVG + Market Structure is a visual market context indicator designed to help traders organize intraday price action around trading sessions, important highs/lows, opening prices, opening gaps, Fair Value Gaps and basic BOS/CHOCH structure.
The script is built as an overlay indicator and is intended for chart analysis, market preparation and visual context. It does not execute trades, does not provide guaranteed buy/sell sig
Индикатор

Alligator - Cross Signals-False signalsThis very simple indicator generates buy and sell signals at each crossover of the alligator's lips, offering good visual readability. If a signal is contradicted by an opposite signal within the following two candles, an alert signal is triggered. When combined with a 200-period EMA and an MACD, it can help improve entry and exit points, although the trader's own analysis remains essential.
Индикатор
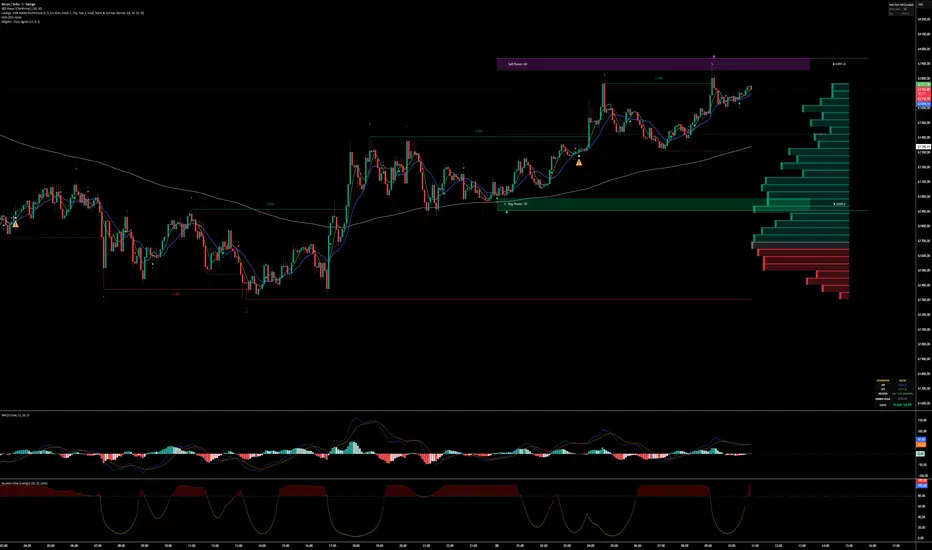
Trucker Stock Trader Confluence ProTrucker Stock Trader Confluence Pro
Built for beginners and experienced day traders alike
This indicator combines several popular trading tools into one easy-to-read dashboard so you don’t have to jump between 5 different indicators.
How It Works (Simple Version):
Think of it like a traffic light system for buying or selling stocks:
The Colored Shapes on the Chart:
Green Circle = MACD just turned bullish (momentum shifting up)
Green Triangle = RSI crossing above 50 (getting stronger)
Green Squar
Индикатор

Fibonacci Volume Profilefibonacci volume profile — institutional edition v2
fibonacci volume profile is a chart-based volume profile tool designed to combine volume structure, fibonacci levels, poc, vah, val, bull/bear volume split, merged poc clusters, confluence detection, global heatmap zones and live volume profile gauges in one visual workspace.
the goal of this tool is to help traders understand where volume is concentrated, where price is reacting, and where important structural levels may exist on the chart.
Индикатор

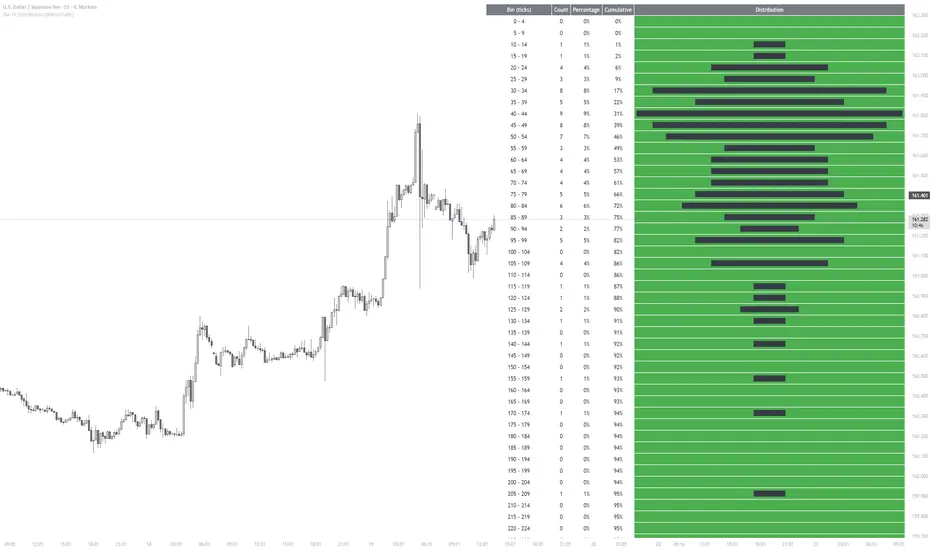
Bar HL Distribution [XWiseTrade]Analyze the distribution of High-Low ranges over the last N bars.
This indicator groups candle ranges (in ticks) into bins and displays:
• Count per bin
• Percentage and cumulative %
• Visual histogram bars
Perfect for understanding typical volatility, setting realistic targets/stops, and spotting unusual bar sizes.
Features:
• Adjustable lookback and bin size
• Clean table with truncation warning
• Lightweight and always up-to-date
Индикатор
Индикатор

SwiftFlow SPX Early Entry PROتحليل يومي لمؤشر S&P 500 باستخدام مؤشر SwiftFlow SPX Early Entry PRO . يعتمد المؤشر على تحليل الزخم والاتجاه لتحديد فرص CALL و PUT بدقة عالية. هذا التحليل لأغراض تعليمية فقط وليس توصية مالية.
Индикатор

SwiftFlow SPX Early Entry PROتحليل يومي لمؤشر S&P 500 باستخدام مؤشر SwiftFlow SPX Early Entry PRO . يعتمد المؤشر على تحليل الزخم والاتجاه لتحديد فرص CALL و PUT بدقة عالية. هذا التحليل لأغراض تعليمية فقط وليس توصية مالية.
Индикатор

Market Breadth: NH/NLMarket Breadth: NH/NL Indicator
This indicator tracks the daily number of stocks making New Highs (NH) and New Lows (NL) across the NYSE and NASDAQ exchanges to evaluate underlying market breadth.
Key Features:
Data Source: Utilizes native TradingView breadth tickers (USI:NYH, USI:NYL, USI:NDH, USI:NDL).
Visual Layout: New Highs are plotted above the zero line. New Lows are inverted and plotted below the zero line for immediate visual assessment of market bias.
Formatting: NYSE breadth is d
Индикатор

Equivest Supply and Demand Zoneupply & Demand Zone Indicator is a technical analysis tool that automatically identifies key buying (Demand) and selling (Supply) areas on a price chart.
🟢 Demand Zone: Area where buyers previously entered aggressively, potentially causing the price to rise.
🔴 Supply Zone: Area where sellers previously dominated, potentially causing the price to fall.
🎯 Helps traders identify entry, exit, stop-loss, and target levels.
📈 Useful for intraday, swing trading, and positional trading.
⚡ Works best wh
Индикатор

Elite Ultimate SMC PRO - Probability EngineDescription:
Overview:
This indicator is a comprehensive Smart Money Concepts (SMC) engine designed to filter noise and identify high-probability trade setups. By combining market structure analysis with momentum and trend filters, the engine generates a dynamic "Probability Score" (0-100).
How it works:
The script evaluates four core market conditions before triggering an entry signal:
1-Market Structure: Identifies swing highs and lows using custom lookback periods.
2-Momentum (Stochastic)
Индикатор

SCALE Strat Trade Plan (+ Wedge Trendlines)A discretionary decision-support overlay that combines "The Strat" reversal logic with a 5-point S.C.A.L.E confluence score, draws a clean, ready-to-read trade plan — entry, stop, and a 3-step target ladder — and overlays auto-drawn wedge trendlines and the structure that matters.**
It does not predict the market or promise results. It *organizes* what's already on your chart — reversals, levels, momentum, trendlines, and a scored setup — so you can make faster, more consistent discretionary de
Индикатор

Индикатор

Tableau Technique Multi-TFThe 4-hour timeframe is now fully integrated into the table, using the same signal logic (RSI + EMA crossover) as the other timeframes. The table will display signals like:
"Achat Fort" / "Vente Forte" (strong buy/sell)
"Achat" / "Vente" (buy/sell)
"Neutre" (neutral).
Great job! The script is now complete with support for 1m, 5m, 15m, 30m, 1h, and 4h timeframes.
Индикатор

G10 Excess Liquidity Leading Indicator (Proxy)█ OVERVIEW
This indicator plots a GDP-weighted composite of real money growth across ten G10 economies, measured as the deviation of each economy's annual real money growth from its own trailing trend, in a separate pane. The thesis it expresses is the excess-liquidity idea: when real money across the major economies is growing faster than its recent trend, the liquidity backdrop for risk assets is supportive, and when it is growing below trend the backdrop is restrictive. An optional SPX YoY
Индикатор

Alpha Flow AI Pro V17Alpha Flow AI Pro is an all-in-one trading assistant that combines multi-timeframe trend analysis, smart money concepts and automated risk management.
It gives clear buy and sell signals with a confidence score, dynamic support and resistance zones, trading session tracking, and automatic take profit and stop loss levels with lot size calculation for any account size.
Main features:
- 8 factor AI confidence engine with multi-timeframe confirmation
- Automatic TP1, TP2, TP3 and Stop Loss with l
Индикатор

Alpha Flow AI Pro V17Alpha Flow AI Pro is an all-in-one trading assistant that combines multi-timeframe trend analysis, smart money concepts and automated risk management.
It gives clear buy and sell signals with a confidence score, dynamic support and resistance zones, trading session tracking, and automatic take profit and stop loss levels with lot size calculation for any account size.
Main features:
- 8 factor AI confidence engine with multi-timeframe confirmation
- Automatic TP1, TP2, TP3 and Stop Loss with l
Индикатор
