Индикатор

ZigZag Break - Zero Lag TF Sync Optimized ffOverview
This MTF tool synchronizes and visualizes Dow Theory breakouts across up to 4 timeframes. It is designed to be versatile: you can choose to use it on the Main Pane for structural analysis or in a Separate Pane for flow monitoring, depending on your trading style.
Two Usage Styles
1. Main Pane: Structural Analysis
By setting the indicator to overlay on the price chart, you can visualize ZigZags, high/low lines, and breakout ribbons directly. This is ideal for identifying the "physical walls" (structural levels) the price has breached and understanding which market force is currently dominant.
2. Separate Pane: Stream Monitoring
By using the indicator in a sub-window, you can monitor 4 parallel columns of direction history as dots. This keeps the main chart clean while allowing you to track the "trend flow" and synchronization depth across all 4 timeframes (Current TF + 3 HTFs) at a glance.
Key Features
Body Breakout Detection: Determines trend direction based solely on the physical fact of candle bodies closing beyond confirmed high/low levels.
MTF Confluence (Sync): Highlights precise moments when multiple timeframes align, providing visual evidence of trend confluence via background ribbons and history dots.
Flexible Visualization: Toggle individual ZigZags, labels, and historical data to suit your specific monitoring needs.
MTF Alerts: Trigger notifications for individual timeframe breakouts or when all specified timeframes synchronize.
Settings
ZigZag Settings: Customize visibility and calculation parameters for each interval.
History Display: Adjust the number of historical dots and their positioning for separate pane monitoring.
Alerts: Enable/disable notifications for specific breakout or sync events.
Disclaimer
This tool is for analytical assistance only and does not constitute investment advice. Trading based on historical price facts does not guarantee future financial results.
Overview / 概要
ダウ理論に基づくブレイクアウト事実を、最大4つの時間軸で同期・可視化します。
ユーザーのトレードスタイルに合わせ、**「メインペインでの構造把握」か「別ペインでの潮流監視」**か、あるいはその両方か、最適な表示方法を選択して使用してください。
Synchronizes and visualizes Dow Theory breakouts across up to 4 timeframes. Choose the display method that best fits your trading style: "Structural Analysis on the Main Pane" or "Flow Monitoring on a Separate Pane."
Usage / 運用スタイルに合わせた選択
メインペインで使用する場合 (Main Pane: Structural Analysis)
ジグザグと高低値ライン、ブレイク背景(リボン)を価格チャート上に直接表示します。現在の価格がどの「物理的な壁」を突破し、どちらの勢力圏にあるのか、構造を視覚的に把握するのに適しています。
Displays ZigZag, high/low lines, and breakout ribbons directly on the price chart. Ideal for visually tracking which "physical walls" price has breached and understanding the dominant market structure in real-time.
別ペインで使用する場合 (Separate Pane: Stream Monitoring)
サブウィンドウに4列のドット履歴を展開します。メインチャートをクリーンに保ちながら、表示足から上位3足までの「潮流の揃い(同期)」を時系列で監視。過去から続くトレンドの深さを一目で判断するのに特化しています。
Plots 4 parallel columns of direction history as dots in a separate sub-window. Keeps the main chart clean while allowing focused monitoring of trend confluence (sync) across all timeframes at a glance.
Features / 機能
実体ブレイク判定 (Body Breakout Detection): 予測を排し、確定した高値・安値を実体で抜けた事実のみを根拠に方向を確定。
MTF同期アラート (MTF Confluence Alerts): 各時間足のブレイクに加え、複数足が同期した決定的な局面をリアルタイムで通知。
Settings / 設定
Indicator Overlay: overlay=true(メイン)か false(別ペイン)かを用途に合わせて切り替えて使用。
ZigZag & History Settings: 各時間軸の表示・判定条件、および履歴件数の調整。
Индикатор

Quantum Kinetic Matrix [Velocity + EQV + CVD] v3.0🚨 OFFICIAL RELEASE NOTES: QUANTUM INTELLIGENCE SUITE 🚨
Deployment Date: April 12, 2026
Target: The Ultimate 5D Scalping Matrix
🟢 Quantum Kinetic Matrix v3.0
The standalone Kinetic Equivolume Candles and Kinetic Confluence CVD indicators have been successfully merged into a single, highly-optimized powerhouse script.
Key Features Consolidated:
Dynamic Equivolume: Candle width actively reflects relative volume pressure.
Kinetic Physics (Hyper-Glow): Color saturation shifts through Gray, Dim, and Neon based on the exact moment Velocity, Acceleration, and Jerk perfectly align.
Directional Ghost Wicks: Squeeze candles retain directional bias via translucent color wicks.
CVD Whale Footprints: Circular bubbles trigger only when extreme buy/sell delta aligns perfectly with volume expansions AND a kinetic snap.
Data Flow Labels: Numerical Delta text prints directly on high-volume candles.
⚠️ CRITICAL CHART SETUP INSTRUCTIONS ⚠️
To prevent ugly visual overlap, you MUST turn off TradingView's default candles.
1. Right-click your chart and select Settings > Symbol.
2. UNCHECK the blue boxes next to Body, Borders, and Wick. (They must be completely empty, not just at 0% opacity).
3. Click OK. Индикатор

TheStrat Markov Percentages RoadmapTheStrat Markov Percentages Roadmap
Overview
The Markov Percentages Roadmap is a high-precision statistical engine designed for practitioners of The Strat. It bridges the gap between objective price action patterns and mathematical probability. By combining the structural rules of Broadening Formations (BF) with a historical Markov-style audit, this indicator calculates the real-world frequency of setups reaching user-defined "Reaction Zones."
Trading is not about being "right"; it is about understanding the frequency of success for a specific setup within a specific structural context. This roadmap provides the evidence.
The Background: Why "Markov"?
In probability theory, a Markov Chain is a model describing a sequence of possible events in which the probability of each event depends only on the state attained in the previous event.
In this indicator, we apply that logic to price action:
Current State: A specific "Strat" trigger (e.g., a Failed 2, a 2-1-2 Reversal, or a Continuation).
Next State: Price entering your user-defined Reaction Zone (defaulted to the 50% and 70% levels).
The Roadmap scans your historical data (Stat Lookback) to find every instance where a setup occurred and calculates exactly how many of those "states" successfully transitioned into the "Zone" within your chosen time horizon (Success Window).
Core Features
1. The Iron-Clad Anchor
The indicator locks onto the previously closed Higher Timeframe (HTF) candle. This ensures that the structural levels (BF High and BF Low) remain perfectly horizontal and fixed for the duration of the session. There is zero "lagging" or "trailing"—the goalposts are set before the first bar of the current session even opens.
2. Automatic Polarity Correction
Standard Fibonacci retracements often require manual flipping when the trend changes. This engine automates that logic.
Bullish HTF Candle: The 50/70 zone is measured down from the High (Reclaim/Retracement logic).
Bearish HTF Candle: The 50/70 zone is measured up from the Low (Reclaim/Retracement logic).
3. The Structural "Zoom Lens"
Using the Structure Lookback input, you can define your playing field:
Lookback = 1: Anchors the roadmap to the single prior HTF candle.
Lookback = 70+: Anchors the roadmap to the extremes of a major multi-day Broadening Formation.
4. The Statistical Dashboard
The real-time table provides a granular audit of:
Count: Total occurrences of the setup within the lookback period.
Prob. To Zone: The percentage frequency of that setup hitting your target.
Prob. To High/Low: The likelihood of price reaching the structural extremes.
How to Use the Roadmap
Identify the Playing Field: Set your Structural Timeframe (e.g., 4H) and Lookback.
Define the Goal: Input your Floor and Ceiling percentages (e.g., 50% and 70%).
Audit the Evidence: Check the dashboard for the setup currently triggering on your execution chart (e.g., 15m). If the "Prob. To Zone" is high (e.g., >65%), the roadmap suggests a high-probability "Reclaim" trade is in play.
Project the Move: Use the Extension Bar Count to project the current levels into the future space, allowing you to visualize the price's trajectory toward the target.
Disclaimer
This indicator is a statistical analysis tool based on historical price action. It does not provide financial advice, nor does it guarantee future results. Trading involves significant risk. The Markov probabilities generated are for educational and research purposes only.
Visual Settings Tip: If you use a light-colored chart, remember to adjust the "Table Text Color" in the Visuals group to ensure all statistical data is clearly visible. Индикатор

Индикатор

Индикатор

Индикатор

Vantage Protocol [JOAT]Vantage Protocol
Introduction
Vantage Protocol is an advanced open-source execution strategy that integrates regime classification, adaptive momentum filtering, volume confirmation, session timing, and ATR-based risk management into a unified NNFX-aligned trading engine. Rather than relying on a single entry signal, the strategy requires alignment across five independent subsystems — regime state, momentum direction, cumulative volume delta, volume presence, and session timing — before entering a trade. This multi-gate architecture is designed to filter out low-probability setups and only execute when multiple independent factors converge.
This strategy exists because most retail strategies fail for a predictable reason: they use one or two conditions for entry and ignore the broader market context. A moving average crossover in a choppy market produces losses. A momentum signal during a low-volume session lacks follow-through. An entry outside the active institutional window misses the liquidity needed for clean execution. Vantage Protocol addresses each of these failure modes with a dedicated subsystem, and only enters when all subsystems agree.
Important Note on Strategy Results
Backtesting results shown with this strategy are historical simulations and do not guarantee future performance. Markets change, and strategies that performed well historically may not perform well in the future. The default settings use realistic parameters: 2% of equity per trade, $100,000 initial capital, no pyramiding, and zero margin. Users should add commission and slippage appropriate for their broker and instrument in the strategy Properties dialog before evaluating results. The strategy is published with these defaults to provide a transparent starting point — users are expected to adjust parameters for their specific trading conditions.
Strategy Architecture
The strategy follows an NNFX (No Nonsense Forex) inspired architecture where each subsystem acts as an independent gate. A trade is only entered when all gates are open simultaneously.
Gate 1: Regime Engine
The regime engine determines whether the market is trending or ranging. It combines three independent measures:
H-Infinity Filter: An adaptive filter from control theory that tracks price under worst-case noise assumptions. The filter's slope determines directional bias — positive slope = bullish, negative slope = bearish
R-Squared Efficiency Gate: Measures how well price fits a linear regression. When R-squared exceeds an auto-calibrating threshold (rolling mean plus k standard deviations), the efficiency gate opens, indicating a trending market. A hysteresis band prevents flickering
Chop Score: Measures path efficiency — the ratio of net movement to total path length. High chop scores indicate choppy, non-directional markets where trend-following strategies fail
The regime is classified as trending (bullish or bearish) only when R-squared confirms efficiency AND chop score confirms directional movement. If either condition fails, the regime is classified as ranging and no entries are allowed.
bool regimeTrend = effOK and not isChoppy
int regimeBias = regimeTrend ? (hinfSlope >= 0 ? 1 : -1) : 0
Gate 2: Momentum Core
The momentum subsystem uses a Laguerre RSI processed through JMA adaptive smoothing. The Laguerre filter provides a smoother, less laggy momentum reading than standard RSI, and the JMA smoothing further reduces noise while preserving responsiveness to genuine momentum shifts.
Momentum must confirm the regime direction:
For long entries: JMA-smoothed Laguerre RSI must be above the bull threshold (default: 62)
For short entries: JMA-smoothed Laguerre RSI must be below the bear threshold (default: 38)
This prevents entries when momentum is neutral or contradicts the regime bias.
Gate 3: Volume Filter (CVD)
Cumulative Volume Delta tracks net buying versus selling pressure. The strategy requires the CVD slope (smoothed with an EMA) to confirm the trade direction:
For long entries: CVD slope must be positive (net buying pressure increasing)
For short entries: CVD slope must be negative (net selling pressure increasing)
Additionally, the current bar's volume must exceed a minimum ratio relative to the 50-bar average (default: 0.7x). This filters out entries during thin-liquidity periods where price moves lack conviction and slippage risk is elevated.
Gate 4: Session Filter
An optional session window filter restricts entries to a configurable time window (default: 0200-1200 New York time). This aligns trading with the London and New York sessions where institutional liquidity is deepest. Entries outside this window are blocked because low-liquidity sessions produce unreliable price action and wider spreads.
Gate 5: Cooldown
After any exit (whether by stop loss, take profit, or regime exit), a configurable cooldown period (default: 5 bars) must pass before a new entry is allowed. This prevents revenge trading and allows the market to establish a new setup after a position closes.
Entry and Exit Logic
Entry Conditions:
All five gates must be open simultaneously, and the strategy must be flat (no existing position):
bool longSetup = regimeBias == 1 and momBull and cvdBull and volOK and sessOK and cooldownOK
bool shortSetup = regimeBias == -1 and momBear and cvdBear and volOK and sessOK and cooldownOK
Stop Loss and Take Profit:
SL and TP levels are calculated using ZEMA-smoothed ATR multiplied by configurable factors:
Stop Loss: Entry price minus (ZEMA-ATR x SL Multiplier) for longs, plus for shorts (default SL multiplier: 1.8)
Take Profit: Entry price plus (ZEMA-ATR x TP Multiplier) for longs, minus for shorts (default TP multiplier: 2.8)
The default risk-reward ratio is approximately 1:1.56 (1.8 SL to 2.8 TP). ZEMA smoothing on the ATR removes noise from the volatility measure, producing more stable SL/TP levels than raw ATR.
Regime Exit:
If the regime flips to ranging or the opposite direction while a position is open, the strategy closes the position immediately with a "Regime Exit" comment. Additionally, if momentum deteriorates significantly (Laguerre RSI crossing back toward neutral), the position is closed. This prevents holding positions through regime changes where the original thesis is no longer valid.
Band Structure Visualization
The strategy plots a JMA baseline with regime-colored glow, and SL/TP bands around it:
SL bands (inner) shown in muted scarlet with fill zones
TP bands (outer) shown in muted jade with cross-style plotting
The baseline color shifts based on regime: green for bullish trend, red for bearish trend, purple for ranging
Bar coloring reflects the current position state: green when long, red when short, purple when ranging (no position allowed), and grey when flat in a trending regime.
Default Strategy Properties
These are the default values used in the strategy's Properties dialog:
Initial Capital: $100,000
Order Size: 2% of equity per trade
Pyramiding: 0 (no adding to positions)
Margin: Long 0%, Short 0% (cash account simulation)
Commission: Not set by default — users should configure this for their broker (typical values: 0.01-0.1% for crypto, $1-5 per contract for futures, 1-3 pips for forex)
Slippage: Not set by default — users should configure this for their instrument (typical values: 1-3 ticks for liquid instruments, more for illiquid ones)
Users are strongly encouraged to set realistic commission and slippage values before evaluating backtesting results. Results without commission and slippage will overstate performance.
Input Parameters
Regime Engine:
R-Squared Length (default: 30), R-Squared Threshold k (default: 0.8), Chop Length (default: 20), Chop Threshold (default: 0.55)
H-Infinity Order (default: 3), Noise (default: 0.5), Disturbance (default: 1.0)
Momentum Core:
Laguerre Alpha (default: 0.07), JMA Smooth Period (default: 8), Bull Threshold (default: 62), Bear Threshold (default: 38)
Volume Filter:
CVD Smoothing (default: 14), Min Volume Ratio (default: 0.7)
Band Structure:
JMA Period (default: 21), ATR Length (default: 14), SL Multiplier (default: 1.8), TP Multiplier (default: 2.8)
Session Filter:
Session Filter toggle (default: on), Active Window (default: 0200-1200), Timezone (default: America/New_York)
Risk Management:
Risk % (default: 1.5), Re-entry Cooldown (default: 5 bars)
How to Use This Strategy
Step 1: Configure for Your Instrument
Open the strategy Properties dialog and set commission and slippage values appropriate for your broker and instrument. Adjust the session window if you trade instruments with different liquidity patterns than the default London/NY window.
Step 2: Evaluate on Sufficient Data
Run the strategy on a dataset that produces at least 100 trades for statistical significance. Short datasets with few trades produce unreliable performance metrics. Use the strategy tester's detailed trade list to review individual trades.
Step 3: Monitor the Dashboard
The 9-row dashboard shows the state of every subsystem in real-time: regime classification, momentum reading, CVD direction, volume ratio, session status, current position, ATR value, and cooldown status. This transparency lets you understand exactly why the strategy is or is not entering trades.
Step 4: Understand the Regime Exit
The strategy will close positions when the regime changes, even if the SL/TP has not been hit. This is by design — holding a trend-following position through a regime change to ranging is a common source of losses. Regime exits may result in small wins or small losses, but they prevent the larger losses that come from ignoring changing conditions.
Step 5: Adjust Parameters Thoughtfully
If the strategy produces too few trades, consider lowering the momentum thresholds (bull from 62 to 58, bear from 38 to 42) or reducing the minimum volume ratio. If it produces too many losing trades, consider increasing the R-squared threshold k or the chop threshold. Each parameter change affects the trade-off between signal frequency and signal quality.
Strategy Limitations and Compromises
Trade Frequency: The five-gate architecture is deliberately selective. On many instruments and timeframes, the strategy may only produce a handful of trades per month. This is by design — fewer, higher-quality trades — but it means the strategy is not suitable for traders who need frequent activity
Regime Detection Lag: The regime engine uses lookback-based measures (R-squared, chop score) and persistence requirements. Regime changes are identified with a delay, which means the strategy may miss the first portion of a new trend or hold slightly into a regime change
CVD Approximation: The volume delta calculation (close > open = buying) is an approximation. True order flow requires Level 2 data not available in Pine Script. On instruments with unreliable volume data (forex with tick volume), the CVD gate may be less effective
Fixed SL/TP: Stop loss and take profit are set at entry and do not trail. In strong trends, the strategy may exit at the TP while the trend continues. A trailing stop modification could capture more of extended moves but would also increase the risk of giving back profits during pullbacks
Session Dependency: The default session filter is optimized for forex and futures with distinct London/NY sessions. Crypto and other 24/7 markets may benefit from disabling the session filter or adjusting the window
No Pyramiding: The strategy does not add to winning positions. This limits profit potential in strong trends but also limits risk exposure
Backtesting vs Live: Backtesting assumes fills at the close of the signal bar. In live trading, slippage, requotes, and execution delays may produce different results. Always paper trade before committing real capital
Originality Statement
This strategy is original in its multi-gate architecture that synthesizes five independent subsystems into a unified execution engine. While individual components (regime detection, Laguerre RSI, CVD, session filtering, ATR-based risk management) are established concepts, this strategy is justified because:
The five-gate entry architecture (regime + momentum + CVD + volume + session) provides a systematic approach to filtering low-probability setups that is not available in single-indicator strategies
The H-Infinity filter for regime detection applies control theory to market classification, providing a theoretically grounded alternative to simple moving average crossover regime detection
The triple-measure regime engine (R-squared + chop + H-Infinity slope) provides more robust regime classification than any single measure
The regime exit mechanism actively manages positions based on changing market conditions rather than relying solely on fixed SL/TP levels
The NNFX-inspired architecture with clearly separated subsystems (baseline, confirmation, volume, exit, session) provides a modular framework that traders can understand, evaluate, and modify
The cooldown mechanism prevents revenge trading after exits, addressing a common behavioral trading error
All subsystem states are displayed transparently in the dashboard, allowing traders to understand exactly why trades are or are not being taken
Disclaimer
This strategy is provided for educational and informational purposes only. It is not financial advice or a recommendation to buy or sell any financial instrument. Trading involves substantial risk of loss and is not suitable for all investors.
Backtesting results are historical simulations based on past data. Past performance does not guarantee future results. The strategy's historical performance was generated under specific market conditions that may not repeat. Markets are dynamic, and strategies that worked historically may fail in the future.
The default strategy properties do not include commission or slippage. Users must configure these values for their specific broker and instrument to obtain realistic performance estimates. Results without commission and slippage will overstate actual trading performance.
Always use proper risk management, including position sizing appropriate for your account and risk tolerance. Never risk more than you can afford to lose. Consider paper trading this strategy extensively before using real capital. The author is not responsible for any losses incurred from using this strategy.
-Made with passion by officialjackofalltrades
Стратегия

AG Pro Displacement Quality Finder [AGPro Series]AG Pro Displacement Quality Finder
Overview / What It Does
AG Pro Displacement Quality Finder is designed to identify displacement candles that stand out for structural intent rather than simple size alone. Instead of highlighting every large bar on the chart, the script evaluates whether a candle shows the type of directional expansion that traders often associate with meaningful repricing. The goal is to help separate ordinary volatility from displacement events that may deserve closer attention.
The core logic focuses on the quality of the candle itself and the context immediately connected to it. A displacement candle can look impressive at first glance while still lacking the characteristics that make it useful in analysis. This script addresses that problem by combining body expansion measurements, marubozu-style pressure assessment, and optional volume confirmation into a single quality framework. The result is a more selective view of bullish and bearish displacement conditions.
Once a valid event is detected, the script does not stop at marking the candle. It also maps a follow-up reclaim zone derived from the displacement structure so the user can monitor whether price revisits, respects, or interacts with that area later. This creates a workflow that is not limited to signal spotting. It extends the idea into post-event tracking, which is often the more practical part of chart analysis.
The visual design is intended to keep the chart readable while still making the key information obvious. Displacement candles can be recolored, quality tags can classify stronger events, and reclaim zones can remain visible long enough to preserve market context. The panel summarizes the latest state and core ratios so the user can quickly understand why the most recent event qualified.
Unique Edge
The distinctive feature of this script is that it treats displacement as a quality problem, not just a range problem. Many tools mark large candles. This script tries to isolate higher-conviction expansion candles by checking whether the body is meaningfully large relative to ATR and average body size, whether the candle shows strong close-to-extreme behavior, and whether optional volume confirmation supports the move.
A second differentiator is the reclaim-zone workflow. Instead of placing a marker and ending the analysis there, the script projects a reclaim area from the detected displacement structure. That makes the tool useful both at the moment of expansion and in the bars that follow. Traders who study impulsive moves often care just as much about what happens after the expansion candle as they do about the candle itself.
The script also uses visual hierarchy to keep stronger and more relevant structures easier to read than older or lower-priority ones. This helps reduce the “everything matters equally” problem that often makes zone-based tools harder to use in practice.
Methodology
The script evaluates bullish and bearish displacement candidates using multiple filters that are designed to work together rather than as isolated checks. At the center of the model is body expansion. The candle body is compared against ATR and against an average-body baseline so that the script can judge whether a bar is unusually forceful for the instrument and timeframe being viewed.
A marubozu-proximity component is then used to assess directional cleanliness. In simple terms, the script looks for candles whose closing behavior suggests genuine directional pressure rather than a wide but indecisive bar. This helps reduce false positives from candles that are large in total range but weak in directional conviction.
An optional volume confirmation layer can be enabled for users who want displacement selection to include participation strength. This does not redefine the script into a volume indicator. It simply acts as an additional confirmation filter for users who prefer more selectivity.
When a displacement event qualifies, the script can recolor the candle and assign a quality tag. The quality tag reflects the combined strength of the measured conditions rather than a single-factor reading. The script then builds a reclaim zone tied to that displacement structure and extends it forward so later interaction can be monitored on the chart.
Signals & Alerts
The script is built around bullish and bearish displacement detection. When the selected conditions are met, the chart can display a quality tag and the displacement candle can be visually emphasized. Reclaim zones are then plotted so the user can follow the area after the impulse.
Bullish and bearish alerts can be used to notify the user when a qualified displacement event appears. These alerts are intended to identify the script’s filtered displacement conditions, not to predict the full future path of price. In practice, they are most useful as chart-review prompts or workflow triggers rather than as stand-alone trade instructions.
Key Inputs
Users can customize the strictness and presentation of the model through inputs such as:
- Body expansion sensitivity relative to ATR
- Body expansion sensitivity relative to average candle body
- Marubozu proximity threshold
- Optional volume confirmation
- Candle recoloring
- Quality tag visibility
- Reclaim zone visibility and extension length
- Panel font size
- Label font size
- General visual display preferences
These controls allow the script to be tuned for more aggressive discovery or more selective filtering depending on instrument behavior and timeframe.
Limitations & Transparency
This script does not claim to identify every important move, nor does it assume that every qualified displacement event will lead to continuation. Some valid expansion candles can fail quickly, while some useful moves may be excluded if the filters are set too strictly. That trade-off is part of any selective model.
Reclaim zones are analytical reference areas, not guarantees of support or resistance. Price may react, ignore the zone, briefly interact with it, or invalidate it entirely. The script is designed to visualize these areas in a structured way, but interpretation remains with the user.
Results can vary materially across assets, sessions, volatility regimes, and timeframes. Thresholds that work well on one instrument may be too loose or too strict on another. Users should expect to calibrate settings rather than assume one configuration is universally optimal.
As with most chart tools, visual density can increase if many qualifying events occur in the same region. The script includes hierarchy-oriented visual handling, but it is still best used with sensible chart context and reasonable parameter choices.
Risk Disclosure
This script is an analytical charting tool. It is not financial advice, not a promise of performance, and not a guarantee of future results. It does not know the user’s objectives, risk tolerance, execution quality, or portfolio constraints.
Displacement, momentum expansion, and reclaim behavior can all be useful concepts in market analysis, but none of them remove uncertainty. Users should apply their own process, risk controls, and independent judgment before acting on any chart observation generated by this script.
Индикатор

Стратегия

AG Pro Inside Bar Breakout Quality [AGPro Series]AG Pro Inside Bar Breakout Quality
Overview / What it does
AG Pro Inside Bar Breakout Quality is an overlay tool built to study one of the market’s most familiar compression structures: the inside bar. Instead of stopping at simple detection, the script evaluates what happens after the pattern forms and grades the breakout attempt with a structured quality model. The result is a workflow-oriented view of inside bar compression, breakout strength, and failed continuation behavior.
The script first identifies a strict inside bar condition, where the current bar remains fully contained within the previous bar’s range. That parent range becomes the active reference zone. From there, the script monitors whether price resolves above or below the structure, whether the move is confirmed by close, whether volume supports the breakout, and whether the breakout later fails and re-enters the range within a user-defined window.
This is not designed as a generic “any breakout” marker. Its purpose is narrower and more specific: it focuses on a compact volatility contraction event, then measures how decisively price leaves that compression. In practical chart work, this helps separate a low-commitment range poke from a more convincing expansion move.
The visual presentation is intentionally structured. Inside bar zones are boxed, breakout direction is marked, quality is scored, and fakeouts are labeled when the breakout reverses back into the monitored range. This makes the script suitable for traders who want a cleaner way to inspect inside bar behavior without manually drawing every structure.
Unique Edge
The main difference here is that the script does not treat every inside bar break as equally meaningful. Many tools stop at “pattern detected” or “level broken.” This script adds a second layer: breakout quality. That layer is derived from close position, volume context, candle body participation, and alignment with the parent candle’s directional bias.
A second differentiator is the built-in fakeout logic. After a breakout is detected, the script continues to watch price for a limited number of bars. If the move quickly returns back through the breakout boundary, the event is tagged as a fakeout. This adds post-event context instead of only marking the first directional move.
Another distinction is that the methodology is deterministic and chart-native. The logic is rule-based, visible, and reproducible from bar to bar. Users can decide whether to require close confirmation beyond the inside bar range, whether to require volume confirmation, and how strict they want the displayed threshold to be through the minimum score filter.
In short, this script is not only about finding compression. It is about ranking the quality of the expansion attempt that follows the compression, while also acknowledging that some breakouts fail quickly and should be read differently.
Methodology
1) Inside Bar Detection
An inside bar is identified when the current bar’s high is lower than the previous bar’s high and the current bar’s low is higher than the previous bar’s low. This creates a strict containment definition based on the previous candle’s full range.
2) Reference Zone
Once an inside bar is detected, the prior candle becomes the parent reference bar. Its high and low define the active breakout boundaries. That range can be visualized as a box, with an optional midpoint line to make the compression zone easier to read on chart.
3) Breakout Confirmation
A bullish breakout occurs when price moves above the parent high. A bearish breakout occurs when price moves below the parent low. Users can choose whether breakout confirmation should be based on close beyond the range or on a less restrictive intrabar break condition.
4) Quality Score
Each breakout can be scored on a 0–10 scale. The score is built from multiple components:
- close position relative to the inside bar boundary
- volume ratio versus the selected moving average
- body participation within the breakout candle’s total range
- directional alignment between the breakout and the parent candle bias
This scoring model is designed to estimate how committed the breakout candle appears, rather than assuming all breaks have equal informational value.
5) Fakeout Detection
If enabled, the script monitors a user-defined number of bars after breakout. A bullish breakout that returns back below the upper boundary within that window is labeled as a bull trap / fakeout. A bearish breakout that returns back above the lower boundary within that window is labeled as a bear trap / fakeout.
6) Visual Layer
The script can display the inside bar zone, midpoint, breakout arrows, score labels, and fakeout markers. A summary panel tracks aggregate statistics such as total inside bars, total breakouts, breakout direction counts, fakeouts, and the latest breakout score.
Signals & Alerts
The script can provide alert conditions for:
- bullish inside bar breakout
- bearish inside bar breakout
- fakeout detection
- high-quality breakout events
- any breakout event
These alerts are intended to help users monitor the pattern and its resolution more efficiently. They do not replace trade planning, confirmation from broader market context, or independent risk management.
Key Inputs
Min Score to Show Breakout
Filters displayed breakout labels by quality threshold. This can be useful for reducing low-quality visual noise.
Volume Confirmation Required
When enabled, breakout evaluation requires volume to be above its moving average threshold. This can help remove low-participation breaks.
Volume MA Period
Defines the lookback length for average volume comparison.
Require Close Beyond IB
When enabled, breakout confirmation depends on bar close beyond the parent range. This creates a more conservative and more stable breakout definition.
Max IBs to Display
Controls how many recent structures and related objects remain visible on chart.
Show IB Box / Midline / Breakout Arrow / Score Label
Lets users decide how much visual detail they want to keep on screen.
Glow Effect on High Score
Adds emphasis to stronger breakout events without changing the underlying logic.
Fakeout Window
Defines how many bars after breakout the script should continue monitoring for a return back through the breakout boundary.
Limitations & Transparency
This script studies inside bar compression and subsequent breakout behavior. It does not claim to identify all meaningful consolidations, and it does not attempt to classify every market regime. The methodology is intentionally focused on one structure.
The score is a rule-based quality model, not an objective measure of future outcome. A high score does not guarantee continuation, and a lower score does not guarantee failure. It simply reflects how the breakout candle and its context behave according to the script’s internal criteria.
Volume-based interpretation may vary across symbols and markets. On some instruments, especially those with inconsistent or synthetic volume data, volume confirmation may be less informative than on others. Users should evaluate whether volume filtering is appropriate for the asset they are studying.
Fakeout detection is also definition-dependent. The script labels a fakeout when price returns through the breakout boundary within the selected lookback window. Different traders may prefer a different timing window or a different failure definition.
As with any overlay, chart readability depends on market volatility, timeframe, and user settings. On lower timeframes or during highly active periods, more visual events may appear. The built-in filters and display controls are there to help manage that density.
Risk Disclosure
This script is an analytical tool for chart study. It is not financial advice, not a trade recommendation, and not a promise of future results.
Inside bar breakouts can behave differently across timeframes, instruments, and market regimes. Users should not rely on a single pattern, score, or alert in isolation. Context still matters, including trend condition, liquidity environment, nearby structure, volatility regime, and execution discipline.
Before using this script in any live decision process, it should be reviewed in the specific market and timeframe relevant to the user’s own approach. Testing, observation, and risk controls remain essential.
Индикатор

PVSRA Candles Hunter v1.2A volume-spread analysis indicator that classifies every candle by the relationship between its volume and spread, matching the original MT4 PVSRA detection logic. Identifies climax volume, above-average volume, and absorption candles through color-coded visualization.
What PVSRA is
PVSRA stands for Price, Volume, Spread, Relative Analysis. The core idea: not all candles are equal. A candle with 3x average volume and a wide spread represents aggressive institutional activity. A candle with 3x average volume but a tiny spread represents absorption ... institutions quietly absorbing orders at a price level, often preceding a reversal. Standard charts treat all candles the same. PVSRA does not.
How classification works
Each candle is classified into one of three categories based on two metrics:
Metric 1: Volume relative to the simple average over the lookback period (default 10 bars).
Metric 2: Effort value, calculated as volume multiplied by spread (high minus low). This captures not just volume alone but the "effort" behind the move.
Classification logic (matching the original MT4 source):
Climax: volume is at least 2x the average, OR the effort value equals the highest effort value in the lookback period
Above Average: volume is at least 1.5x the average (but does not qualify as climax)
Normal: everything else
Bull or bear is determined by close versus open.
Absorption detection
When a candle qualifies as climax volume but has a spread less than half the average spread, it is flagged as absorption. This means massive volume was transacted but price barely moved. Institutions are absorbing sell orders (bullish absorption) or buy orders (bearish absorption) at that level. Absorption candles frequently mark turning points.
Color scheme (standard PVSRA palette)
Climax bull: lime. Climax bear: red. Above average bull: blue. Above average bear: fuchsia. Normal bull: white. Normal bear: gray. All colors are configurable in settings.
Display modes
Three modes are available: Candle Color (recolors the candle body and wicks), Background (subtle highlight behind the candle without changing candle colors), or Both. This lets you combine PVSRA with other candle-coloring indicators if needed.
Volume source override
Many CFD brokers report tick volume rather than real exchange volume. Tick volume on CFDs is unreliable for PVSRA analysis because it measures broker-specific tick counts, not actual contracts traded. The override feature lets you pull real volume from a liquid exchange source. For example: use COMEX:GC1! volume when charting XAUUSD on a CFD broker, or INDEX:BTCUSD when charting BTCUSDT on a low-volume feed. When override is off, native chart volume is used.
Optional features
Labels: C▲/C▼ marks climax candles, ABS marks absorption candles. Off by default to keep the chart clean.
Stats table: shows current volume, average volume, volume ratio, and classification. Useful for understanding the numbers behind the colors. Position is configurable. Off by default.
Alerts
Six alert conditions: Climax Bull, Climax Bear, Above Average Bull, Above Average Bear, Absorption Detected, Any Vector Candle. Absorption alerts are particularly useful as early reversal warnings.
How to use
Add the indicator to your chart. Climax candles (lime/red) at key support or resistance levels signal strong institutional interest. Absorption candles at those same levels are high-probability reversal signals. Above-average candles (blue/fuchsia) confirm momentum. Normal candles in a trend are continuation ... normal candles in a range are noise.
The indicator works on any instrument and any timeframe. For CFD instruments, enable the volume override and point it to the corresponding futures or index feed for accurate classification.
Settings
Volume: lookback period (default 10), climax multiplier (default 2.0x), above-average multiplier (default 1.5x). Display: mode selection, label toggle, stats table toggle. Colors: full PVSRA palette customization. All defaults match the standard PVSRA configuration from the original MT4 implementation.
What is original
The PVSRA classification logic faithfully reproduces the MT4 source. The additions are: volume source override for CFD feeds (solving the tick volume problem), absorption detection (climax volume with narrow spread), three display modes, configurable stats table, and structured alert conditions for each classification type. Индикатор

Индикатор

AG Pro Pin Bar Quality Filter [AGPro Series]AG Pro Pin Bar Quality Filter
Overview / What it does
AG Pro Pin Bar Quality Filter is a price-action overlay built to detect pin bar candles and then separate higher-quality rejection candles from weaker or noisier ones.
The script does not treat every long-wick candle as equally meaningful. Instead, it evaluates the internal candle structure first, then applies a compact quality framework around volume, recent momentum, and local support/resistance context. The result is a filtered pin bar workflow designed for traders who want cleaner chart annotation rather than a raw pattern dump.
This tool focuses on one specific job: identifying rejection candles with a measurable structure and presenting them with a readable quality label directly on the chart. It is intended to help users inspect potential reaction points, not to replace broader market context or execution rules.
The visual design is intentionally simple at the core: pin bar body highlighting, wick emphasis, directional markers, and compact quality labels. This makes the script suitable for traders who want candle-based context without converting the chart into a full market-structure dashboard.
Unique Edge
The distinctive feature of this script is that it does not stop at pattern detection.
A standard pin bar script often marks candles only because they have a long wick. This script goes further by checking whether the wick is large enough relative to the body, whether the body itself is small enough relative to the full candle range, and whether one wick clearly dominates the other. That combination helps reduce ambiguous candles that visually resemble pin bars but do not express clean rejection.
After the structural test, the script applies a three-part quality model:
- volume confirmation
- momentum context
- support/resistance proximity
This creates a practical quality hierarchy rather than a binary pattern label. In other words, the script is not only asking “Is this a pin bar?” but also “How much contextual support does this pin bar have?”
An optional piercing check is also available for users who want stricter validation. This adds another layer of selectivity by requiring the candle body to show stronger positional behavior relative to the prior bar.
Methodology
The script starts by measuring the current candle:
- candle body size
- full candle range
- upper wick length
- lower wick length
- dominant wick versus body ratio
A raw pin bar candidate requires:
- a minimum wick/body ratio
- a maximum body percentage of full range
- directional wick dominance
This helps define whether the candle is a legitimate bullish or bearish rejection structure.
Bullish pin logic is based on lower-wick dominance.
Bearish pin logic is based on upper-wick dominance.
Once a raw pin bar is detected, the script evaluates three contextual filters.
1) Volume filter
The current volume can be compared against a moving average of volume. This helps identify candles that form with relatively stronger participation.
2) Momentum confirmation
The script can check whether recent candles were moving in the opposite direction of the current pin bar. For example, a bullish pin bar becomes more meaningful when it forms after short-term downward pressure, while a bearish pin bar becomes more meaningful after short-term upward pressure.
3) Support / resistance proximity
The script tracks pivot-based reference levels and checks whether the pin bar forms close to a recent local support or resistance area, using an ATR-based distance threshold.
Each passed filter contributes to the final quality score. This produces a compact tiered output instead of a single undifferentiated signal stream.
Signals & Alerts
The script can identify:
- bullish pin bars
- bearish pin bars
- higher-quality pin bars based on the selected minimum score
Visual elements may include:
- body highlighting on detected pin bars
- wick emphasis
- directional arrow markers
- quality labels with contextual details
- an information panel summarizing the active state
The quality label can display the signal tier and relevant confirmations such as:
- wick/body ratio
- volume confirmation
- momentum confirmation
- support/resistance proximity
Alert conditions are available for:
- bullish pin bars
- bearish pin bars
- prime-quality pin bars
- any valid pin bar that meets the selected score threshold
This allows users to align alerts with their own strictness settings rather than monitoring every possible candle manually.
Key Inputs
Important user controls include:
- minimum wick/body ratio
- maximum body percentage of full range
- wick dominance threshold
- optional piercing requirement
- volume filter enable/disable
- momentum filter enable/disable
- support/resistance filter enable/disable
- minimum quality score
- label size
- panel display
- maximum number of displayed signals
These settings make the script adaptable across different instruments and chart styles. Users who prefer a broader scan can lower the strictness, while users who want fewer but cleaner signals can raise the thresholds.
Limitations & Transparency
This script is a rule-based candle-quality filter. It is not a market prediction engine, and it does not attempt to classify broader trend structure, liquidity behavior, or macro regime by itself.
A pin bar can still fail even when all filters pass. A visually strong rejection candle is not automatically a durable reversal. Context such as higher-timeframe structure, trend state, volatility regime, session behavior, and instrument-specific character still matters.
Support and resistance detection in this script is pivot-based and proximity-based. It is designed as a practical contextual filter, not as a complete structural mapping model.
Volume behavior also varies by asset and market type. On some instruments, especially where centralized volume data is limited or interpreted differently, the volume filter should be treated as a supplementary input rather than a universal truth test.
The momentum check is intentionally compact and local. It is meant to improve candle context, not to replace broader directional analysis.
For these reasons, the script is best used as a chart-reading assistant within a larger process, not as a standalone decision framework.
Risk Disclosure
This script is provided for technical analysis and chart annotation purposes only.
It highlights selected pin bar conditions based on user-defined structural and contextual rules. It does not provide financial advice, investment advice, or guaranteed trade outcomes. Markets can remain irrational, trend continuation can invalidate rejection candles, and false positives can occur in all timeframes and asset classes.
Users should validate the script on their own instruments, timeframes, and risk models before relying on it in live conditions. Position sizing, stop placement, execution discipline, and overall trade management remain the responsibility of the user.
In summary, AG Pro Pin Bar Quality Filter is designed to help traders study rejection candles with more structure, more selectivity, and cleaner on-chart presentation than a basic pin bar marker, while remaining transparent about what the script does and does not do.
Индикатор

AG Pro Engulfing Candle Quality [AGPro Series]AG Pro Engulfing Candle Quality
Overview / What it does
AG Pro Engulfing Candle Quality is a price action overlay designed to detect bullish and bearish engulfing candles and then grade them through a structured quality framework instead of treating every engulfing event as equally important.
Rather than marking all engulfing candles with the same visual weight, this script evaluates whether the candle shows characteristics that may make the event more meaningful in context. The goal is to reduce low-value pattern noise and help the user focus on engulfing candles that display stronger internal structure and better surrounding conditions.
The script can color qualifying candles, display score labels directly on the chart, add optional background emphasis, and summarize recent signal state through an information panel. This makes it suitable for traders who want a cleaner way to review engulfing behavior without turning the chart into a generic pattern map.
In practical use, the script is not intended to predict direction on its own. It is designed as a filtering and chart-reading aid for users who already work with structure, liquidity, support/resistance, trend context, or discretionary execution rules.
Unique Edge
Many engulfing tools stop at pattern detection. This script takes a different approach by treating engulfing candles as a quality event rather than a binary event.
Its core difference is the scoring model. Each qualifying candle is evaluated through a multi-factor framework that can include relative volume behavior, body-to-range efficiency, prior directional context, engulf strength, and optional support/resistance proximity. This creates a 1-10 quality score that helps separate weaker engulfing events from stronger ones.
The result is a more selective workflow:
- detect the pattern,
- evaluate the candle quality,
- display only the events that meet the user’s threshold,
- and keep the chart focused on higher-interest formations.
This makes the script different from simple engulfing markers, basic candlestick libraries, or broad pattern collections. Its purpose is not to label everything. Its purpose is to rank and filter.
Methodology
The script identifies bullish and bearish engulfing conditions using configurable detection logic. Users can choose a stricter close-based interpretation or a broader wick-based interpretation depending on how selective they want the pattern engine to be.
Once an engulfing candle is detected, the script evaluates the event with a weighted quality framework. The conceptual components include:
1. Relative volume
The candle is compared against a moving average of volume. A candle that forms with stronger-than-normal participation can receive a higher quality contribution than one forming on ordinary or weak activity.
2. Body efficiency
The candle body is evaluated relative to the full range. A larger, more decisive body may indicate stronger commitment than a candle with excessive wick noise and a relatively small real body.
3. Prior directional context
The script reviews recent directional pressure over a user-defined lookback window. This helps distinguish engulfing candles that appear after a more meaningful opposing move from those that form in flatter or less informative conditions.
4. Engulf strength
The script can incorporate how convincingly the current candle overtakes the prior candle structure, adding another layer beyond simple pattern recognition.
5. Optional support/resistance proximity
Users can enable an additional contextual bonus when the engulfing event forms near pivot-derived support or resistance areas.
These components are normalized into a score from 1 to 10. The score is then used for chart display, filtering, and alerts. This means the script is not simply asking whether an engulfing candle exists. It is asking whether the engulfing candle appears to have enough internal and contextual quality to deserve attention.
Signals & Alerts
The script can display:
- bullish engulfing events,
- bearish engulfing events,
- candle coloring for qualified signals,
- optional score labels,
- optional background highlights,
- and a chart panel summarizing recent signal state.
Alerts are deterministic and based on confirmed rule conditions inside the script. Users can create alerts for:
- bullish engulfing events,
- bearish engulfing events,
- high-quality bullish engulfing events,
- high-quality bearish engulfing events,
- or any engulfing event that meets the selected minimum score threshold.
As with any chart tool, users should understand that alerts reflect the script’s rules, not an outcome guarantee. An alert means the selected condition has been satisfied according to the methodology. It does not imply that the next market move will be favorable.
Key Inputs
The script includes several controls so users can adapt the tool to different symbols and timeframes.
Important inputs include:
- minimum score required for display,
- label cooldown to reduce visual clustering,
- trend-strength lookback,
- strict close-based or broader wick-based engulf logic,
- bullish and bearish visibility toggles,
- optional support/resistance bonus,
- support/resistance pivot length,
- ATR-based proximity setting,
- scoring weights for volume, body efficiency, trend context, and engulf strength,
- volume average threshold,
- body/range threshold,
- color controls for bullish, bearish, and score states,
- label size,
- background highlight toggle,
- candle-coloring toggle,
- score label visibility,
- panel visibility, position, font size, and theme,
- and minimum score required for alerts.
These inputs allow the user to keep the script conservative and selective, or make it more permissive when reviewing more active charts.
Limitations & Transparency
This script is a rule-based visual analysis tool. It does not know future price action, and it does not confirm trade quality on its own.
Several points are important:
- An engulfing candle is still a local pattern. It can fail, especially in noisy or low-liquidity environments.
- Strong scores do not guarantee continuation or reversal.
- The support/resistance context is approximate and derived from pivot logic, not from a universal market map.
- Volume behavior can vary across markets and data feeds.
- Different timeframes can produce very different signal density and quality distribution.
- The script is designed for confirmation and filtering, not for fully automated decision-making.
Users should treat the score as a structured quality estimate, not as a promise. In many workflows, the script is most useful when combined with broader context such as market structure, trend bias, higher-timeframe levels, session behavior, or risk management rules.
Risk Disclosure
This script is provided for chart analysis and educational use. It is not financial advice, not an execution system, and not a guarantee of performance.
All trading and investing involve risk. Market conditions can change quickly, and any pattern, score, or alert can fail. Users are responsible for their own analysis, entries, exits, and risk controls.
Use the script as a decision-support tool, not as a substitute for judgment.
Индикатор

AG Pro BOS & CHoCH Auto Detector [AGPro Series]AG Pro BOS & CHoCH Auto Detector
OVERVIEW / WHAT IT DOES
AG Pro BOS & CHoCH Auto Detector is a market structure overlay designed to organize swing-based price action into a more readable workflow. Instead of leaving the chart covered with disconnected pivot labels or generic break markers, this script tracks structural swing progression, identifies when prior highs or lows are broken, and classifies those breaks as either BOS (Break of Structure) or CHoCH (Change of Character). The goal is not to predict the next move, but to help traders read whether price is continuing an existing structure or beginning to challenge it.
The script monitors HH, HL, LH, and LL development using pivot logic, then uses those reference points to detect structural breaks. A break in the direction of the active structure is treated as BOS, while the first meaningful break against the prior directional structure is treated as CHoCH. This distinction matters because many charts show every break in the same visual language, even though continuation and character shift do not carry the same analytical meaning. Here, those events are separated clearly.
A second layer of usefulness comes from presentation discipline. This script is built to keep structural information visible without turning the chart into a wall of labels. Swing density can be reduced, major structures can be emphasized, and the higher timeframe overlay can remain active in the background to keep local execution aligned with broader structure. The result is a structure map that stays informative without becoming visually noisy.
This tool is intended for traders who already use price structure as part of their chart reading and want a cleaner way to monitor continuation versus transition. It can support discretionary workflows around trend continuation, pullback analysis, structure failure, and higher timeframe context, while still remaining transparent about how its signals are formed.
UNIQUE EDGE
Many market structure tools stop at plotting swing points or printing BOS / CHoCH text when a level is crossed. AG Pro BOS & CHoCH Auto Detector is built around a more organized structure engine approach.
Its edge is not based on trying to forecast direction or force trade entries. Its edge is based on classification, hierarchy, and chart readability:
- It separates continuation breaks from character-change breaks instead of treating all structural violations as equivalent.
- It preserves the swing chain context behind each event, so BOS and CHoCH are not isolated labels detached from surrounding structure.
- It allows confirmation mode selection, so the user can decide whether structure breaks require close confirmation or can react to intrabar violations.
- It includes higher timeframe structure context directly on the chart rather than forcing the user to reconstruct that context manually.
- It includes swing-density controls so the visual output can be kept clean even when structure is active.
This makes the script less like a simple labeling utility and more like a workflow layer for structure-based chart reading.
METHODOLOGY
1) Swing Structure Detection
The script uses pivot-based highs and lows to identify structural reference points. Those pivots are then classified into HH, HL, LH, and LL sequences, allowing the chart to reflect whether structure is strengthening, weakening, or transitioning.
2) BOS Logic
When price breaks a prior structural level in the direction of the active trend, the event is labeled as BOS. In practical terms, this represents structural continuation rather than directional reversal.
3) CHoCH Logic
When price breaks against the previously established directional structure, the event is labeled as CHoCH. This is treated as a possible character shift, not as a guaranteed reversal. It highlights that the prior structure has been challenged.
4) Confirmation Mode
Users can choose whether structure breaks are confirmed by candle close or by intrabar price action. Close mode is more conservative and can reduce noise. Intrabar mode is more responsive and may show earlier breaks.
5) Higher Timeframe Overlay
An optional MTF layer allows the script to bring higher timeframe structure context onto the active chart. This can help users avoid reading local swings in isolation when broader structure is still dominant.
6) Visual Hierarchy
The script uses horizontal structure levels, event labels, optional arrows, controlled swing density, and a compact information panel to keep key structure events readable. The design priority is to preserve analytical clarity.
SIGNALS & ALERTS
This script can generate structure-based alerts for the following event types:
- Bullish BOS
- Bearish BOS
- Bullish CHoCH
- Bearish CHoCH
- Any structure break
These alerts are event-driven and tied to the script's structural logic. They are intended to notify the user when a relevant break occurs according to the selected confirmation mode. They are not trade instructions and should be interpreted within the user's broader process.
KEY INPUTS
Swing Pivot Length
Controls pivot sensitivity. Lower values detect swings faster but may produce more noise. Higher values are more selective.
Confirmation Mode
Choose between Close and Intrabar logic for structure break confirmation.
Max Structures to Show
Limits how many structural events remain plotted on the chart.
Swing Label Density
Lets users choose between fuller swing annotation and a cleaner major-structure view.
Max Swing Labels on Chart
Helps prevent excessive label build-up in active market conditions.
Enable MTF Overlay
Adds higher timeframe structure context to the active chart.
MTF Timeframe
Defines which higher timeframe structure layer is projected onto the chart.
Label Size / Panel Font Size / Line Settings
Allow visual tuning without changing structural logic.
LIMITATIONS & TRANSPARENCY
This script uses pivot-based structure logic. That means swing points are confirmed only after the required pivot bars are completed. Because of this, the tool is confirmation-based by design and does not attempt to label unfinished pivots as confirmed structure.
BOS and CHoCH are structural events, not certainty statements. A CHoCH may signal that the prior directional structure is being challenged, but it does not guarantee a lasting reversal. Likewise, a BOS indicates continuation within the script's structural framework, but not guaranteed follow-through.
The higher timeframe overlay is designed to add context, not to replace direct higher timeframe chart review. Users should still interpret local and higher timeframe structure together rather than relying on a single signal state.
This script is best used as a structure-mapping tool within a broader analytical framework. It is not a standalone trading system, not a predictor, and not a substitute for risk management.
RISK DISCLOSURE
This indicator is for chart analysis and educational use. It does not provide financial advice, does not guarantee outcomes, and should not be treated as a complete trading methodology on its own. Market structure tools can help organize price action, but all trading decisions remain the responsibility of the user.
Индикатор

Индикатор
ZigZag Break - Zero Lag TF Sync1Script Name: ZigZag Break - Zero Lag TF Sync
Overview
This indicator is a Multi-Timeframe (MTF) ZigZag and Market Structure monitoring tool, designed to capture "Structural Shifts" without the typical noise of standard indicators. It defines trend changes based on "Confirmed Candle Closes" and "Higher Timeframe Synchronization" as its core disciplinary principles.
Key Features
1. Zero Lag TF Sync
Utilizing lookahead=barmerge.lookahead_on combined with a proprietary logic that calculates based on the "Previous Confirmed Close," this script eliminates repainting while reflecting Higher Timeframe (HTF) structural changes at near-real-time speed. It mirrors the market's physical facts without the lag common in MTF scripts.
2. Evidence-Based Market Structure Shift (MSS)
A break is only acknowledged when a "Candle Closes beyond the boundary." By ignoring mere wick penetrations (noise), the script identifies true structural breaks driven by actual market demand, ensuring you only react to validated trend shifts.
3. Dynamic Vertex Tracking
When a break occurs, the algorithm automatically scans back up to 500 bars to identify the true Extreme High/Low that initiated the move. It doesn't just draw lines; it identifies the "Higher Lows" and "Lower Highs" based on Dow Theory.
4. Compact Status Dashboard
A clean, non-intrusive table in the top-right corner allows you to instantly identify the current market bias—BUY, SELL, or WAIT—keeping your decision-making process transparent and grounded.
Trading Discipline & Philosophy
This tool was developed to synchronize the user's market view with the following principles:
Noise Elimination: Wait for the close to avoid "fakeouts."
Respect for the Flow: Always stay aware of the "Walls" formed by Higher Timeframes.
Clarity of Decision: Complex calculations are handled in the background, presenting only the "Facts" (Lines and Colors) to support your final execution.
Settings
ZigZag Settings: Toggle visibility for Current TF and two customizable Higher Timeframes.
Dow Break Settings: Customize break lines, labels, and background fills.
Alerts: Bilingual (English/Japanese) alert notifications for structural breaks across all monitored timeframes.
ツール名:ZigZag Break - Zero Lag TF Sync
概要 / Overview
このインジケーターは、市場の「構造の変化」をノイズなく捉えるために設計された、マルチタイムフレーム(MTF)対応のジグザグ・ブレイクアウト監視ツールです。
単なる高安値の結線ではなく、**「終値での確定」と「上位足との同期」**を絶対的な規律としています。
主要機能 / Key Features
1. Zero Lag TF Sync(遅延なき上位足同期)
lookahead=barmerge.lookahead_on を活用しつつも、計算には「1本前の確定終値」を用いる独自のロジックを採用。リペイント(後出し)を徹底的に排除しながら、上位足の構造変化をリアルタイムに近い速度でチャート上に鏡のように映し出します。
2. 実需に基づいた構造破壊(Dow Break)
単なるヒゲの更新ではなく、**「終値による境界線の突破」**のみを構造破壊(Market Structure Shift)として受理します。これにより、突発的なスパイクやノイズに惑わされない、実需を伴った潮流の変化を特定します。
3. 自動追跡型ジグザグ(Dynamic Vertex Tracking)
ブレイクが発生した際、その起点を過去500本まで遡り、真の最高値・最安値を頂点として自動同定します。視覚的なジグザグ線だけでなく、ダウ理論に基づいた「押し安値・戻り高値」のラインを自動描画します。
4. マルチタイムフレーム・ステータス
右上のコンパクトなテーブルにより、現在のメイン足の勢力が「BUY(買い)」か「SELL(売り)」かを一目で判別可能です。
ロジックの背後にある規律 / Trading Discipline
このツールは、以下の相場観をユーザーと同期させるために開発されました。
ノイズの排除: 終値確定を待つことで、ダマシを回避する。
潮流への敬意: 常に上位足(Higher Time Frame)の壁を意識する。
判断の透明化: 複雑な計算をバックグラウンドで行い、ユーザーの前には「事実(ラインと色)」のみを提示する。 Индикатор

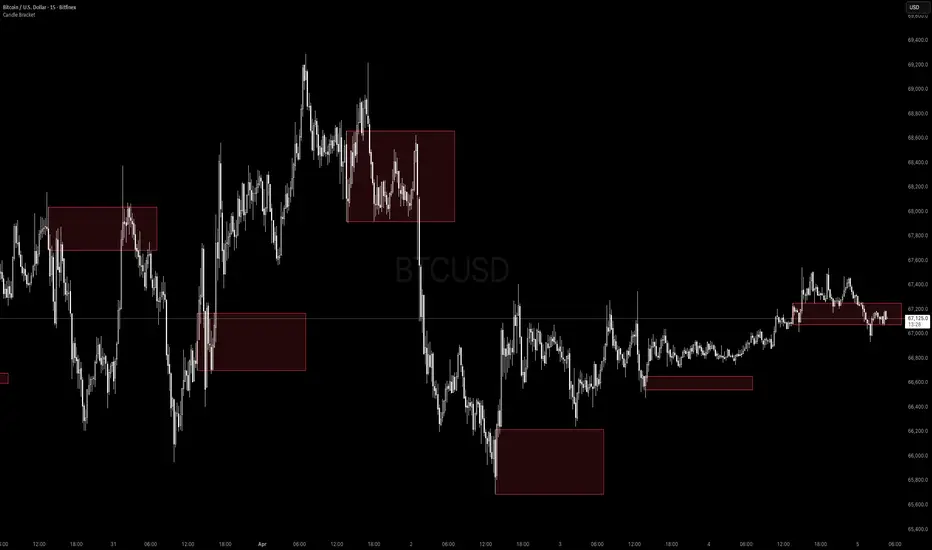
Candle Bracket - Mark Any HTF Candle's Range at a Specific TimeWhat It Does
Candle Bracket draws a visual range box using the High and Low of any higher timeframe candle at a user-defined time of day. Set it to the 9:30 AM 15-minute candle and you get the Opening Range. Set it to the London open, the New York open, or any key session candle — the indicator marks it automatically, every day.
Use Cases
- Opening Range Breakout (ORB) - Mark the 9:30 or 9:45 AM candle as your initial range
- Session Opens - London (3:00 AM ET), New York (9:30 AM ET), Asia (8:00 PM ET)
- News Candles - Mark a recurring economic release time (e.g. 8:30 AM CPI/NFP candle)
- Custom Reference Ranges - Any time-based candle you want as a daily anchor
Settings
- Fixed Timeframe - The HTF candle to pull from (e.g. 15, 30, 60, D)
- Target Hour / Minute - The exact time of the candle you want to mark
- Timezone - Defaults to America/New_York. Adjustable for any global session
- Rectangle Width (Bars) - How far the box extends to the right
- Box Color + Opacity Full visual customization
How to Use It
1. Set the timeframe to match your candle of interest (e.g. '15' for a 15-minute candle)
2. Set the target time to the candle's open time (e.g. '9:30' for the NY open candle)
3. The box draws automatically on every matching candle going back in history
4. Use the High and Low of the box as your key levels breakout, rejection, or retest
Notes
- Works on any asset and any chart timeframe
- Keeps the last 20 boxes by default to manage memory efficiently
- Best used on intraday charts (1m, 5m, 15m) when targeting session-level candles Индикатор

Индикатор

SR Breakout Arrows# SR Breakout Arrows - Documentation
> **Version**: v1.0
> **Author**: jeffprotrader168
> **Pine Script Version**: v6
> **License**: Mozilla Public License 2.0
---
## 📊 Overview
A fractal-based Support/Resistance breakout detection indicator. Uses `ta.pivothigh` / `ta.pivotlow` to identify local highs and lows as S/R levels, then signals with arrows when price breaks through these levels. Features optional RSI/CCI filtering and anti-repaint protection. Works on all markets and timeframes.
Ported from MQL4 (originally by Barry Stander 2004 / Lennoi Anderson 2015 / rewritten by Jeff Reed).
---
## 🎯 Key Features
- **Fractal-based S/R Detection**: Confirms fractals with 2 bars on each side, auto-extends horizontal lines until next fractal
- **Breakout Arrow Signals**: Draws triangle arrows below/above bars when close breaks S/R levels
- **Anti-Repaint Guarantee**: Signals only confirmed after bar close by default; historical arrows never disappear
- **RSI/CCI Filtering**: Optional dual-filter to reduce false breakouts
- **Deduplication**: Each S/R level triggers only one signal, preventing consecutive duplicate arrows
- **Bilingual Interface**: English / Traditional Chinese toggle
- **Full Color Customization**: S/R lines and arrow colors are fully configurable
---
## ⚙️ Configuration
### ⚙️ Basic Settings
| Parameter | Default | Description |
|-----------|---------|-------------|
| `i_language` | EN | Language selection (EN / Traditional Chinese) |
### 📊 Signal Settings
| Parameter | Default | Range | Description |
|-----------|---------|-------|-------------|
| `i_signal_dots` | 3 | | Minimum bars after fractal before breakout is valid; higher = more conservative |
| `i_apply_to_close` | true | — | When enabled, signals only appear after bar closes (anti-repaint) |
### 🔍 RSI/CCI Filter
| Parameter | Default | Range | Description |
|-----------|---------|-------|-------------|
| `i_rsicci_filter` | false | — | Enable RSI+CCI dual filtering |
| `i_rsi_period` | 14 | | RSI calculation period |
| `i_rsi_overbought` | 75.0 | — | RSI overbought level (buy signals require RSI below this) |
| `i_rsi_oversold` | 25.0 | — | RSI oversold level (sell signals require RSI above this) |
| `i_cci_period` | 14 | | CCI calculation period |
| `i_cci_buy_level` | 50.0 | — | CCI buy threshold (buy signals require CCI above this) |
| `i_cci_sell_level` | -50.0 | — | CCI sell threshold (sell signals require CCI below this) |
### 🎨 Display
| Parameter | Default | Description |
|-----------|---------|-------------|
| `i_show_arrows` | true | Show breakout arrows |
| `i_show_sr_lines` | true | Show S/R extension lines |
| `i_res_color` | Red | Resistance line color |
| `i_sup_color` | Blue | Support line color |
| `i_arrow_up_color` | Blue | Breakout up arrow color |
| `i_arrow_dn_color` | Magenta | Breakout down arrow color |
---
## 📈 Visual Elements
### Chart Elements
- **Resistance Line** (red stepline): Extends horizontally from upper fractal high until a new upper fractal appears
- **Support Line** (blue stepline): Extends horizontally from lower fractal low until a new lower fractal appears
- **Breakout Up Arrow** (blue triangle ▲ + BUY): Below the breakout bar, indicating bullish breakout
- **Breakout Down Arrow** (magenta triangle ▼ + SELL): Above the breakout bar, indicating bearish breakout
### Color Scheme
| Element | Default Color | Description |
|---------|--------------|-------------|
| Resistance Line | Red | Current resistance level |
| Support Line | Blue | Current support level |
| Breakout Up Arrow | Blue | Resistance Breakout: BUY |
| Breakout Down Arrow | Magenta | Support Breakout: SELL |
---
## 🔔 Alert Conditions
### Alert 1: SR Breakout: BUY
**Trigger Condition**: Close price breaks above resistance level (all filter conditions passed)
**Message Format**: `{ticker} Resistance Breakout: BUY at {close} ({interval})`
### Alert 2: SR Breakout: SELL
**Trigger Condition**: Close price breaks below support level (all filter conditions passed)
**Message Format**: `{ticker} Support Breakout: SELL at {close} ({interval})`
### Alert 3: SR Breakout: Any
**Trigger Condition**: Any direction breakout signal
**Message Format**: `{ticker} S/R Breakout at {close} ({interval})`
---
## 💡 Usage Tips
1. **Best Timeframes**: M15 to H4; fractals are more reliable on higher timeframes
2. **Complementary Indicators**: Pair with trend indicators (MA, ADX) to confirm breakout direction
3. **Trading Hours**: Avoid low-liquidity sessions (e.g., late Asian session) where breakout quality is lower
4. **Risk Management**: Arrows are entry references; combine with fixed or ATR-based stop-loss
### Suggested Configurations
**Conservative** (fewer false breakouts):
```
i_signal_dots = 5
i_rsicci_filter = true
i_rsi_overbought = 70, i_rsi_oversold = 30
```
**Aggressive** (fast reaction):
```
i_signal_dots = 1
i_rsicci_filter = false
```
**Balanced** (recommended default):
```
i_signal_dots = 3
i_rsicci_filter = false
i_apply_to_close = true
```
---
## 🔍 Technical Details
### Algorithm Explanation
The indicator follows a three-step process:
**Step 1: Fractal Detection**
Uses `ta.pivothigh(high, 2, 2)` and `ta.pivotlow(low, 2, 2)` to detect local highs and lows. Requires 2 bars on each side for confirmation, consistent with the classic fractal definition. When a fractal is detected, the corresponding S/R level is updated and the bar counter resets.
**Step 2: S/R Extension and Counting**
Each bar increments the counter until a new fractal resets it. The counter ensures breakouts occur sufficiently far from the fractal (`>= i_signal_dots`), avoiding false signals near the fractal point.
**Step 3: Breakout Detection**
When close price exceeds the S/R level, the counter meets the threshold, and the level hasn't been broken before, a breakout signal fires. Optional RSI/CCI filtering further screens low-quality breakouts.
### Anti-Repaint Mechanism
| Layer | Mechanism | Description |
|-------|-----------|-------------|
| 1 | `barstate.isconfirmed` gate | Only evaluates breakout after bar close |
| 2 | `var` persistence | State accumulates bar-by-bar; historical results are fixed |
| 3 | `last_broken_res/sup` dedup | Each S/R value triggers only once |
### Performance Considerations
- All visuals use `plot()` / `plotshape()` — no dynamic drawing object limits
- RSI/CCI computed once per bar, referenced via function to avoid redundant calls
---
## 📝 Version History
| Version | Date | Changes |
|---------|------|---------|
| v1.0 | 2026-04-03 | Initial release: full port from MQL4 to Pine Script v6 |
---
## 📌 FAQ
### Q1: How does this differ from the MQL4 version?
A: Core logic (fractal → S/R → breakout) is identical. The Pine version removes MQL4-specific GlobalVariable persistence (Pine auto-recalculates all history on load), arrow symbol codes (replaced with `plotshape`), and notification channel toggles (managed by TradingView platform). Adds color customization and bilingual interface.
### Q2: Why are some breakouts missing arrows?
A: Possible reasons: (1) `i_signal_dots` is set too high — not enough bars since fractal; (2) RSI/CCI filter is enabled but conditions aren't met; (3) The S/R level was already triggered by a previous breakout (dedup mechanism).
### Q3: Can both up and down arrows appear on the same bar?
A: Yes. Up and down breakouts are evaluated independently, allowing simultaneous signals in extreme market conditions.
### Q4: What happens with `i_apply_to_close = false`?
A: The latest unconfirmed bar participates in breakout evaluation, which may cause arrows to appear then disappear (repainting). Recommended to keep the default value `true`.
---
## 📞 Support & Feedback
For any questions or suggestions about this indicator, please feel free to open an Issue or Discussion.
---
*Last Updated: 2026-04-03*
Индикатор

Индикатор

Inside / Outside BarsThis indicator highlights Inside Bars and Outside Bars directly on the chart, helping identify consolidation and expansion phases in price action.
Key Features:
Inside Bar Detection
An Inside Bar is a candle whose high and low are fully contained within the range of the previous candle.
This typically signals consolidation, reduced volatility, and potential buildup before a breakout.
Outside Bar Detection
An Outside Bar is a candle whose high is higher than the previous high and whose low is lower than the previous low.
This reflects range expansion, increased volatility, and possible reversal or continuation momentum.
Visual Highlighting
Inside and Outside Bars are clearly marked on the chart with customizable colors, allowing quick recognition without manual analysis.
Clean and Minimal Design
-The indicator is designed to avoid clutter, focusing only on key price action signals.
-Works on Any Market
-Can be applied to crypto, forex, stocks, and indices.
Use Cases:
-Identify breakout setups after consolidation (Inside Bars)
-Spot volatility expansion and potential reversals (Outside Bars)
-Combine with higher timeframe levels and liquidity concepts for improved decision-making
This tool is built for traders who rely on pure price action and want a clear, automated way to track key candle patterns. Индикатор