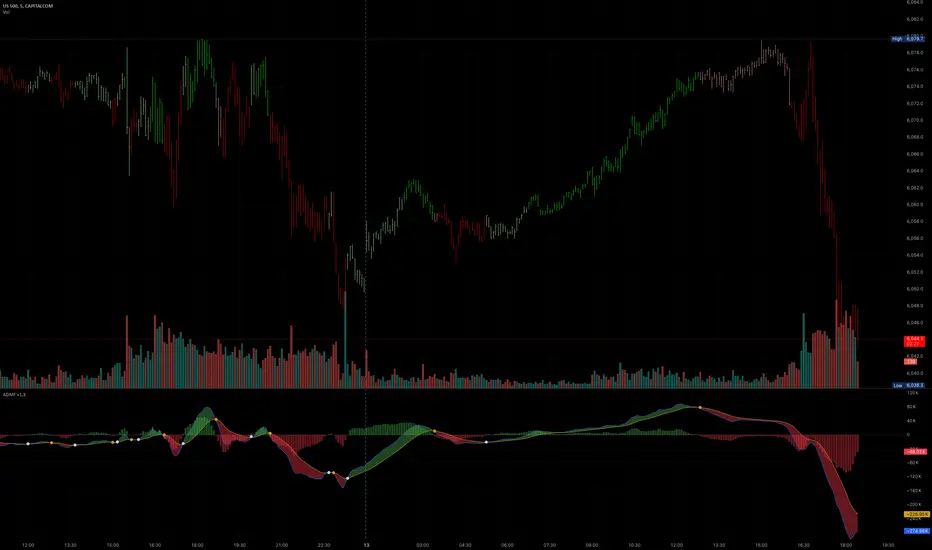
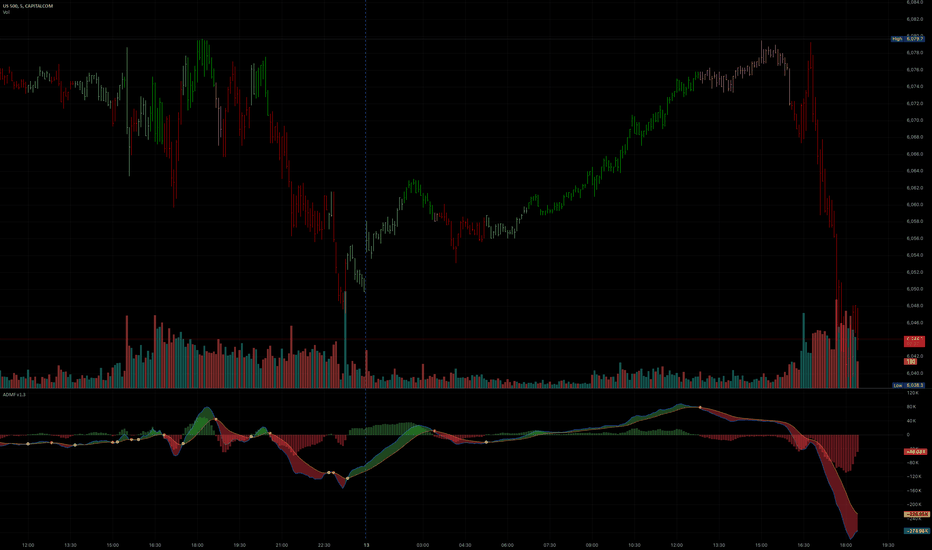
Advanced Volume [v3.1]Advanced Volume Indicator & Divergence Dashboard -
Volume is the fuel that drives market structure. While price dictates *where* the market is going, volume reveals *how much conviction* is behind the move.
The **Advanced Volume Indicator** is a comprehensive, multi-factor analysis toolkit designed to move beyond single-metric volume analysis. By aggregating seven distinct volume indicators, a cooldown-aware divergence engine, and a dynamic scoring dashboard, this tool provides a complete, institutional-grade picture of market participation and order flow.
Core Metrics Included
You can select any of the following primary oscillators to display on your main indicator pane. Regardless of your visual selection, the background engine continuously tracks all of them:
* **Chaikin Money Flow (CMF):** Measures the balance of accumulation and distribution over a rolling period.
* **Money Flow Index (MFI):** A volume-weighted relative strength index used to spot volume exhaustion and overbought/oversold extremes.
* **Volume RSI:** Applies momentum calculations strictly to volume, identifying periods of expanding or contracting participation.
* **Relative Volume (RVOL):** Compares the current bar's volume against a rolling baseline average to highlight significant spikes.
* **Volume Oscillator:** Tracks the percentage spread between short-term and long-term volume moving averages to determine volume trend direction.
* **VWAP Position:** Evaluates price action relative to the session's Volume Weighted Average Price (an institutional benchmark).
* **Estimated Cumulative Volume Delta (CVD):** Approximates net buying and selling pressure.
The Weighted Aggregate Dashboard
The centrepiece of this indicator is the on-chart Heads-Up Display (HUD). It provides real-time status updates for all seven metrics and combines them into a **Weighted Aggregate Signal**.
The engine evaluates all data points simultaneously and outputs a directional score ranging from **-9 (Strong Sell)** to **+9 (Strong Buy)**.
The scoring is weighted based on metric reliability:
* **CMF:** ±2 points (Primary money flow driver)
* **MFI:** +2 (oversold), +1 (neutral bullish), or -1 (overbought/bearish bias)
* **Volume Oscillator:** ±1 to ±2 points (Based on trend expansion strength)
* **Volume RSI:** ±1 point
* **VWAP Position:** ±1 point
* **Volume Trend (vs 20 SMA):** ±1 point
Smart Divergence Engine
The script features a robust momentum divergence engine applied to your chosen primary oscillator. It includes three distinct filters to prevent false signals and alert spam:
1. **Divergence Strength Scoring:** Evaluates the severity of both the price displacement and the oscillator displacement.
2. **Minimum Strength Filter:** Allows you to ignore weak, insignificant divergences. (A typical strong signal scores between 1.0 and 5.0).
3. **Cooldown Gate:** Requires a minimum number of bars between signals of the same direction, preventing the engine from spamming repeated alerts during a slow, grinding trend.
Actionable Signals & Alerts
The indicator provides visual markers and fully configurable alerts for:
* **Bullish & Bearish Divergences:** Confirmed momentum shifts.
* **Volume Spikes:** Bars exceeding your custom RVOL threshold (default 2.0x average).
* **Hidden Liquidity:** High-volume Doji candles. These represent extreme volume participation resulting in price indecision—often a footprint of institutional absorption or hidden liquidity resting in the order book.
Recommended Settings by Trading Style
* **Scalping (1m–5m):** Lookback = 3, Cooldown = 5, Min Strength = 0.5, Session CVD Reset = ON
* **Day Trading (15m–1H):** Lookback = 5, Cooldown = 10, Min Strength = 1.0, Session CVD Reset = ON
* **Swing Trading (4H–D):** Lookback = 5, Cooldown = 15, Min Strength = 2.0, Session CVD Reset = OFF
* **Portfolio/Macro (D–W):** Lookback = 8, Cooldown = 20, Min Strength = 1.0, Session CVD Reset = OFF
Strategy Integration
This script exports its internal data silently to the TradingView Data Window. You can easily import these values into your own automated strategy scripts using the `request.security()` function. The exported plots are: `Export_CMF`, `Export_MFI`, `Export_RVOL`, and `Export_DivStrength`.
---
MANDATORY MODERATION DISCLOSURES
**1. Historical Plotting / Offset Confirmation**
By design, the divergence markers plotted by this script appear in the past. To ensure a divergence signal is permanently locked in and mathematically valid, the engine waits for `div_lookback` bars to close *after* the suspected pivot high/low before confirming it. Once confirmed, it plots the marker backward onto the actual pivot bar using a negative offset. **This is not a repainting bug.** It is a strict, standard confirmation feature to prevent repainting and false signals mid-move. Alerts can be set to fire only upon bar close.
**2. Estimated CVD Calculation**
True Cumulative Volume Delta requires tick-by-tick bid/ask order flow data, which is not available on standard TradingView chart feeds. The CVD in this script is explicitly an **Estimated CVD**. It uses the intra-bar close position relative to the high/low range as a mathematical proxy to approximate net buying and selling pressure. A "Session Reset" toggle is included (and recommended) for equities and futures to restart the accumulation daily, mitigating gap-open distortion. Индикатор

Индикатор
Индикатор

Индикатор

Smart Money Flow Signals [QuantAlgo]🟢 Overview
The Smart Money Flow Signals indicator synthesizes significant volume-price dynamics through multi-component analysis to identify potential accumulation and distribution phases driven by substantial market participants. It combines Money Flow Index momentum, Chaikin Money Flow accumulation patterns, volume-weighted price momentum, and buying/selling pressure metrics into a unified composite oscillator that quantifies periods of concentrated capital movement, helping traders and investors identify conditions where significant volume participants may be actively positioning across multiple market conditions and timeframes.
🟢 How It Works
The indicator's core methodology lies in its weighted composite approach, where multiple volume-price components are calculated sequentially and then integrated to create a comprehensive significant flow activity signal.
First, the Money Flow Index (MFI) is calculated to measure buying and selling pressure by incorporating volume into price momentum analysis:
raw_money_flow = source * volume
positive_flow = source >= source ? raw_money_flow : 0
negative_flow = source < source ? raw_money_flow : 0
positive_money_flow = math.sum(positive_flow, mfi_period)
negative_money_flow = math.sum(negative_flow, mfi_period)
money_flow_index = 100 - 100 / (1 + positive_money_flow / negative_money_flow)
This creates an RSI-style momentum indicator that tracks whether money (price × volume) is flowing into or out of the asset, with values ranging from 0 to 100 where readings above 50 suggest buying pressure dominance.
Then, Chaikin Money Flow (CMF) is computed to evaluate accumulation and distribution by analyzing where prices close within each bar's range, weighted by volume:
money_flow_multiplier = high != low ? (close - low - (high - close)) / (high - low) : 0
money_flow_volume = money_flow_multiplier * volume
volume_sma = ta.sma(volume, trend_period)
chaikin_money_flow = volume_sma != 0 ? ta.sma(money_flow_volume, trend_period) / volume_sma : 0
Positive CMF values indicate accumulation (closes near the high of the range), while negative values indicate distribution (closes near the low of the range), with volume weighting emphasizing periods of significant participation.
Next, Volume Analysis is performed to quantify current volume intensity relative to historical averages:
volume_average = ta.sma(volume, trend_period)
volume_strength = volume_average != 0 ? volume / volume_average : 1
volume_weight = math.log(volume_strength + 1)
The logarithmic transformation creates a volume weight that amplifies signals during high-volume periods while preventing extreme volume spikes from overwhelming the composite calculation.
Following this, Buy/Sell Pressure is quantified by comparing cumulative volume during bullish versus bearish candles:
buying_pressure = math.sum(volume * (close >= open ? 1 : 0), trend_period)
selling_pressure = math.sum(volume * (close < open ? 1 : 0), trend_period)
pressure_ratio = (buying_pressure - selling_pressure) / (buying_pressure + selling_pressure) * 100
This creates a directional pressure ratio that reveals whether significant participants are predominantly buying or selling, expressed as a percentage between -100 (all selling) and +100 (all buying).
Then, Volume-Weighted Momentum is calculated through an exponential smoothing channel that adjusts price deviation based on volume intensity:
exponential_smooth_average = ta.ema(source, momentum_channel_period)
deviation = ta.ema(math.abs(source - exponential_smooth_average), momentum_channel_period)
channel_index = deviation != 0 ? (source - exponential_smooth_average) / (0.015 * deviation) * (1 + volume_weight * 0.5) : 0
This channel index measures how far price has deviated from its exponential average relative to typical deviation, with the volume weight multiplier (1 + volume_weight * 0.5) amplifying the signal when significant volume accompanies the price movement.
Finally, the Composite Wave is constructed by combining all components with specific weighting to create the final oscillator:
momentum_wave = ta.ema(channel_index, trend_period)
money_flow_wave = (money_flow_index - 50) * 1.2
chaikin_flow_wave = chaikin_money_flow * 100
composite_wave = momentum_wave * 0.5 + chaikin_flow_wave * 0.3 + money_flow_wave * 0.2
smoothed_wave = ta.sma(composite_wave, signal_smoothing)
This creates a multi-dimensional volume flow oscillator that combines price-volume momentum, accumulation-distribution patterns, and buying-selling pressure into a single signal, providing traders with probabilistic insights into periods of concentrated market activity and directional bias based on weighted component convergence.
🟢 Signal Interpretation
▶ Positive Values (Above Zero, Green): Composite money flow above equilibrium indicating net accumulation pressure, positive buying volume dominance, and bullish volume-price alignment = Favorable conditions for long positions, significant capital flowing into the asset = Buy/hold opportunities
▶ Negative Values (Below Zero, Red): Composite money flow below equilibrium indicating net distribution pressure, negative selling volume dominance, and bearish volume-price alignment = Unfavorable conditions for long positions, significant capital flowing out of the asset = Sell/short opportunities
▶ Extreme Overbought Zone: Excessive bullish money flow indicating potential accumulation exhaustion, where buying pressure may have reached unsustainable levels with elevated reversal risk = Caution on new longs, potential distribution phase beginning, profit-taking zone for existing positions
▶ Extreme Oversold Zone: Excessive bearish money flow indicating potential distribution exhaustion, where selling pressure may have reached unsustainable levels with elevated reversal risk = Caution on new shorts, potential accumulation phase beginning, buying opportunity zone for contrarian entries
▶ Smoothed Trend Line (White) Alignment: When the smoothed trend line confirms the composite wave direction, it validates the underlying volume-price trend and filters false signals caused by short-term noise
▶ Volume Intensity Correlation: Gradient intensity (color saturation) reflects combined wave strength, volume participation, and directional alignment, where darker/more saturated colors indicate stronger concentrated activity and higher-probability directional moves
🟢 Features
▶ Preconfigured Presets: Three optimized parameter configurations accommodate different trading styles, timeframes, and market analysis approaches.
1. "Default" provides balanced volume flow measurement suitable for swing trading on 4-hour and daily charts, offering moderate responsiveness to money flow shifts with standard RSI-equivalent MFI period and moderate smoothing for most market conditions.
2. "Fast Response" delivers heightened sensitivity optimized for active intraday trading and scalping on 1-minute to 1-hour charts, using compressed calculation periods across all components and minimal smoothing to capture rapid volume flow changes and quick trend shifts as they develop, ideal for early entry/exit opportunities with acceptance of increased signal frequency during consolidation.
3. "Smooth Trend" offers conservative extreme identification ideal for position trading and long-term analysis on daily to weekly charts, employing extended periods across all money flow components with substantial smoothing to filter short-term noise and isolate only strong, sustained accumulation and distribution phases driven by significant volume participants.
▶ Built-in Alerts: Seven alert conditions enable comprehensive automated monitoring of significant money flow transitions and extreme market states.
1. "Bullish Flow" triggers when the composite wave crosses above zero, signaling the shift from distribution to accumulation and concentrated buying activity beginning.
2. "Bearish Flow" activates when the composite wave crosses below zero, signaling the shift from accumulation to distribution and concentrated selling activity starting.
3. "Any Flow Direction Change" provides a combined notification for either bullish or bearish crossover regardless of direction, useful for general money flow momentum shifts.
4. "Extreme Overbought" alerts when the composite wave reaches or exceeds the overbought threshold (default +60), indicating excessive buying pressure and potential exhaustion.
5. "Extreme Oversold" notifies when the composite wave reaches or falls below the oversold threshold (default -60), indicating excessive selling pressure and potential capitulation.
6. "Overbought Reversal" triggers specifically when the wave crosses back down through the overbought level after being extended, signaling the beginning of distribution from extreme levels.
7. "Oversold Reversal" activates when the wave crosses back up through the oversold level after being extended, signaling the beginning of accumulation from extreme levels.
▶ Color Customization: Six visual themes (Classic, Aqua, Cosmic, Ember, Neon, plus Custom) accommodate different chart backgrounds and visual preferences, ensuring optimal contrast and immediate identification of bullish versus bearish volume flow conditions across various devices and screen sizes. Optional bar coloring provides instant visual context of current significant volume activity intensity and direction without switching between the price pane and indicator pane, enabling traders and investors to immediately assess volume-price positioning dynamics while analyzing price action.
Индикатор

Индикатор

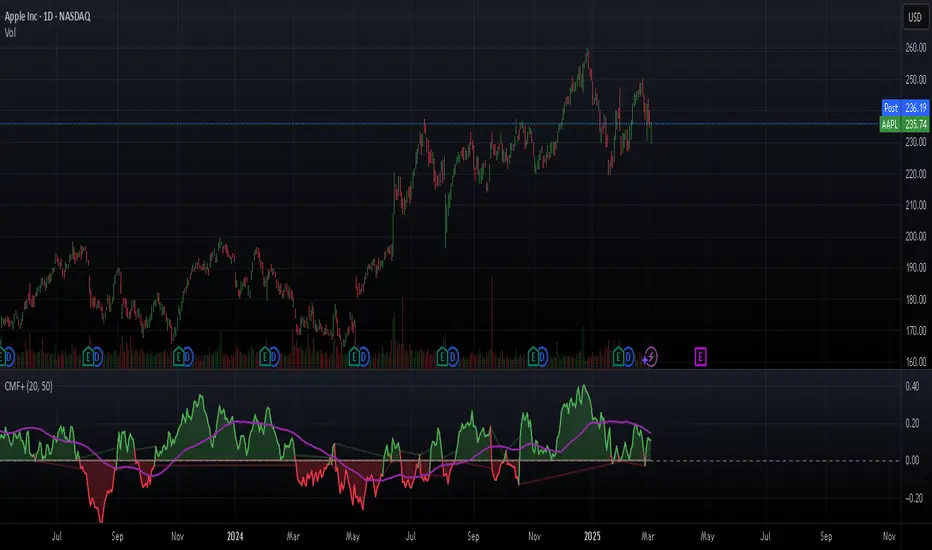
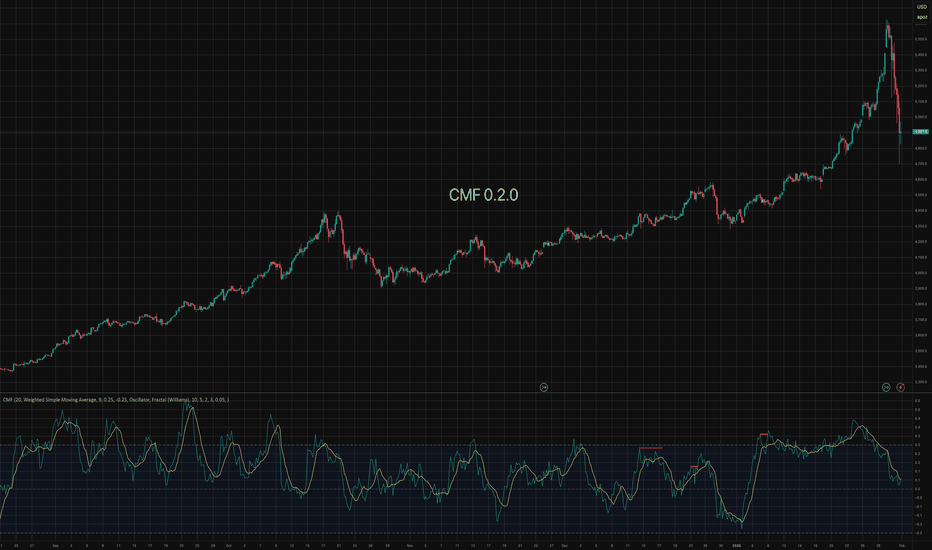
Chaikin Money FlowThis indicator provides an implementation of the classic Chaikin Money Flow (CMF), a volume-weighted oscillator designed to measure money flow pressure. It is enhanced with a customizable signal line and a built-in divergence detection engine.
Key Features:
Full Divergence Suite (Class A, B, C): The primary feature is the integrated divergence engine. It automatically detects and plots all three major types of divergences:
Regular (A): Signals potential trend reversals.
Hidden (B): Signals potential trend continuations.
Exaggerated (C): Signals weakness at double tops/bottoms.
Divergence Filtering and Visualization:
Price Tolerance Filter: Divergence detection is enhanced with a percentage-based price tolerance (pivPrcTol) to filter out insignificant market noise, leading to more robust signals.
Persistent Visualization: Divergence markers are plotted for the entire duration of the signal and are visually anchored to the CMF level of the confirming pivot.
Customizable Signal Line: Includes an optional moving average of the CMF, which serves as a signal line. The type of MA (Signal Smoothing) and its length can be customized. This signal line can also be optionally volume-weighted (Volume weighted).
Note on Confirmation (Lag): Divergence signals rely on a pivot confirmation method to ensure they do not repaint.
The Start of a- divergence is only detected after the confirming pivot is fully formed (a delay based on Pivot Right Bars).
The End of a divergence is detected either instantly (if the signal is invalidated by price action) or with a delay (when a new, non-divergent pivot is confirmed).
Multi-Timeframe (MTF) Capability:
MTF CMF & Signal Lines: The CMF and its signal line can be calculated on a higher timeframe, with standard options to handle gaps (Fill Gaps) and prevent repainting (Wait for...).
Limitation: The Divergence detection engine (pivDiv) is disabled if a timeframe other than the chart's timeframe is selected. Divergences are only calculated on the active chart timeframe.
Integrated Alerts: Includes 16 comprehensive alerts for:
The start and end of all 6 divergence types.
The CMF crossing its signal line.
The CMF crossing the zero line.
DISCLAIMER
For Informational/Educational Use Only: This indicator is provided for informational and educational purposes only. It does not constitute financial, investment, or trading advice, nor is it a recommendation to buy or sell any asset.
Use at Your Own Risk: All trading decisions you make based on the information or signals generated by this indicator are made solely at your own risk.
No Guarantee of Performance: Past performance is not an indicator of future results. The author makes no guarantee regarding the accuracy of the signals or future profitability.
No Liability: The author shall not be liable for any financial losses or damages incurred directly or indirectly from the use of this indicator.
Signals Are Not Recommendations: The alerts and visual signals (e.g., crossovers) generated by this tool are not direct recommendations to buy or sell. They are technical observations for your own analysis and consideration. Индикатор
Индикатор

Индикатор

Индикатор

Индикатор

Индикатор

Индикатор

Индикатор

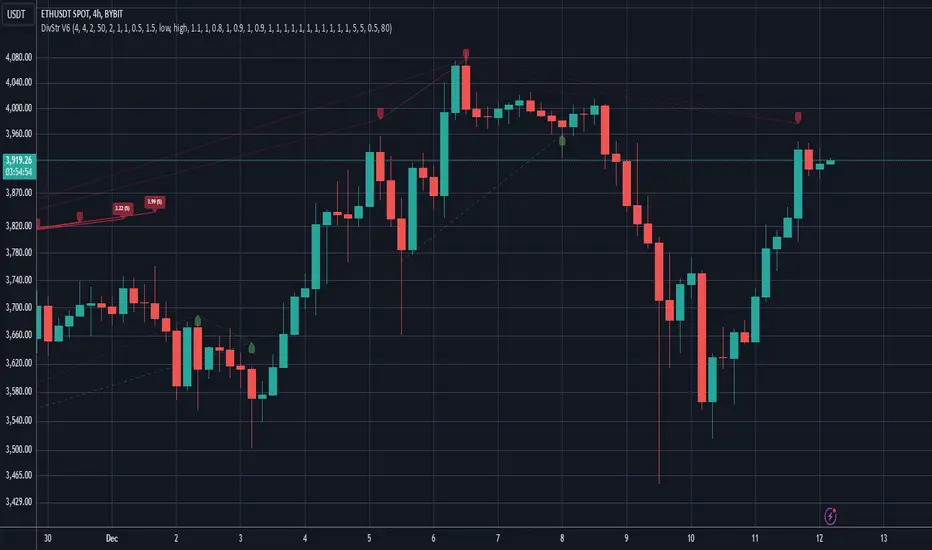
Strength of Divergence Across Multiple Indicators (+CMF&VWMACD)Modified Version of Strength of Divergence Across Multiple Indicators by reees
Purpose:
This Pine Script indicator is designed to identify and evaluate the strength of bullish and bearish divergences across multiple technical indicators. Divergences occur when the price of an asset is moving in one direction while a technical indicator is moving in the opposite direction, potentially signaling a trend reversal.
Key Features:
1. Multiple Indicator Support: The script now analyzes divergences for the following indicators:
* RSI (Relative Strength Index)
* OBV (On-Balance Volume)
* MACD (Moving Average Convergence/Divergence)
* STOCH (Stochastic Oscillator)
* CCI (Commodity Channel Index)
* MFI (Money Flow Index)
* AO (Awesome Oscillator)
* CMF (Chaikin Money Flow) - Newly added
* VWMACD (Volume-Weighted MACD) - Newly added
2. Customizable Divergence Parameters:
* Bullish/Bearish: Enable or disable the detection of bullish and bearish divergences independently.
* Regular/Hidden: Detect both regular and hidden divergences (hidden divergences can indicate trend continuation).
* Broken Trendline Exclusion: Optionally ignore divergences where the trendline connecting price pivots is broken by an intermediate pivot.
* Pivot Lookback Periods: Adjust the number of bars used to identify valid pivot highs and lows for divergence calculations.
* Weighting: Assign different weights to regular vs. hidden divergences and to the relative change in price vs. the indicator.
3. Indicator-Specific Settings:
* Weight: Each indicator can be assigned a weight, influencing its contribution to the overall divergence strength calculation.
* Extreme Value: Define a threshold above which an indicator's divergence is considered "extreme," giving it a higher strength rating.
4. Divergence Strength Calculation:
* For each indicator, the script calculates a divergence "degree" based on the magnitude of the divergence and the user-defined weightings.
* The total divergence strength is the sum of the individual indicator divergence degrees.
* Strength is categorized as "Extreme," "Very strong," "Strong," "Moderate," "Weak," or "Very weak."
5. Visualization:
* Divergence Lines: The script draws lines on the chart connecting the price and indicator pivots that form a divergence (optional, with customizable transparency).
* Labels: Labels display the total divergence strength and a breakdown of each indicator's contribution. The size and visibility of labels are based on the strength.
6. Alerts:
* The script can generate alerts when the total divergence strength exceeds a user-defined threshold.
New Indicators (CMF and VWMACD):
* Chaikin Money Flow (CMF):
* Purpose: Measures the buying and selling pressure by analyzing the relationship between price, volume, and the accumulation/distribution line.
* Divergence: A bullish CMF divergence occurs when the price makes a lower low, but the CMF makes a higher low (suggesting increasing buying pressure). A bearish divergence is the opposite.
* Volume-Weighted MACD (VWMACD):
* Purpose: Similar to the standard MACD but uses volume-weighted moving averages instead of simple moving averages, giving more weight to periods with higher volume.
* Divergence: Divergences are interpreted similarly to the standard MACD, but the VWMACD can be more sensitive to volume changes.
How It Works (Simplified):
1. Pivot Detection: The script identifies pivot highs and lows in both price and the selected indicators using the specified lookback periods.
2. Divergence Check: For each indicator:
* It checks if a series of pivots in price and the indicator are diverging (e.g., price makes a lower low, but the indicator makes a higher low for a bullish divergence).
* It calculates the divergence degree based on the difference in price and indicator values, weightings, and whether it's a regular or hidden divergence.
3. Strength Aggregation: The script sums up the divergence degrees of all enabled indicators to get the total divergence strength.
4. Visualization and Alerts: It draws lines and labels on the chart to visualize the divergences and generates alerts if the total strength exceeds the set threshold.
Benefits:
* Comprehensive Divergence Analysis: By considering multiple indicators, the script provides a more robust assessment of potential trend reversals.
* Customization: The many adjustable parameters allow traders to fine-tune the script to their specific trading style and preferences.
* Objective Strength Evaluation: The divergence strength calculation and categorization offer a more objective way to evaluate the significance of divergences.
* Early Warning System: Divergences can often precede significant price movements, making this script a valuable tool for anticipating potential trend changes.
* Volume Confirmation: The inclusion of CMF and VWMACD add volume-based confirmation to the divergence signals, potentially increasing their reliability.
Limitations:
* Lagging Indicators: Most of the indicators used are lagging, meaning they are based on past price data. Divergences may sometimes occur after a significant price move has already begun.
* False Signals: No indicator is perfect, and divergences can sometimes produce false signals, especially in choppy or ranging markets.
* Subjectivity: While the script aims for objectivity, some settings (like weightings and extreme values) still involve a degree of subjective judgment.
Индикатор

Chaikin's Money FlowOverview : Chaikin's Money Flow (CMF) is a momentum indicator that measures the buying and selling pressure of a financial instrument over a specified period. By incorporating both price and volume, CMF provides a comprehensive view of market sentiment, helping traders identify potential trend reversals and confirm the strength of existing trends.
Key Features:
Volume-Weighted : Unlike price-only indicators, CMF accounts for trading volume, offering deeper insights into the forces driving price movements.
Oscillatory Nature : CMF oscillates between positive and negative values, typically ranging from -100 to +100, indicating the balance between buying and selling pressure.
Trend Confirmation : Positive CMF values suggest accumulating buying pressure, while negative values indicate distributing selling pressure. This aids in confirming the direction and strength of trends.
Calculation Details :
Intraday Intensity (II) = 100 × (2×Close−High−Low) / (High−Low) × Volume
Condition: If High=Low, II is set to 0 to prevent division by zero.
II_smoothed = SMA(II, lookback)
Applies a Simple Moving Average (SMA) to the Intraday Intensity over the defined lookback period to smooth out short-term fluctuations.
Volume Smoothing:
V_smoothed = EMA(Volume, Volume Smoothing Period)
Utilizes an Exponential Moving Average (EMA) to smooth the volume over the specified smoothing period, giving more weight to recent data.
Money Flow Calculation:
Money Flow = II_smoothed / V_smoothed
Condition: If Vsmoothed=0Vsmoothed=0, Money Flow is set to 0 to avoid division by zero.
Usage Instructions:
Parameters Configuration:
Lookback Period: Determines the number of periods over which Intraday Intensity is averaged. A higher value results in a smoother indicator, reducing sensitivity to short-term price movements.
Volume Smoothing Period: Defines the period for the EMA applied to Volume. Adjusting this parameter affects the responsiveness of the Money Flow indicator to changes in trading volume.
Interpreting the Indicator:
Positive Values (>0): Indicate buying pressure. The higher the value, the stronger the buying interest.
Negative Values (<0): Signal selling pressure. The lower the value, the more intense the selling activity.
Crossovers: Watch for Money Flow crossing above the zero line as potential buy signals and crossing below as potential sell signals.
Divergence: Identify divergences between Money Flow and price movements to anticipate possible trend reversals.
Complementary Analysis:
Confluence with Other Indicators: Use CMF in conjunction with trend indicators like Moving Averages or oscillators like RSI to enhance signal reliability.
Volume Confirmation: CMF's volume-weighted approach makes it a powerful tool for confirming the validity of price trends and breakouts.
Acknowledgment: This implementation of Chaikin's Money Flow Indicator is inspired by and derived from the methodologies presented in "Statistically Sound Indicators" by Timothy Masters. The indicator has been meticulously translated to Pine Script to maintain the statistical integrity and effectiveness outlined in the source material.
Disclaimer: The Chaikin's Money Flow Indicator is a tool designed to assist in trading decisions. It does not guarantee profits and should be used in conjunction with other analysis methods. Trading involves risk, and it's essential to perform thorough testing and validation before deploying any indicator in live trading environments. Индикатор

Индикатор
YD_Divergence_RSI+CMFThe ‘YD_Divergence_RSI+CMF’ indicator can find divergence using RSI (Relative Strength Index) and CMF (Chaikin Money Flow) indicators.
📌 Key functions
1. Search pivot high and pivot low points in a certain length of price.
2. Connect pivot high to pivot high , pivot low to pivot low , forming two standards for divergence in result.
The marker then plots only the higher high, lower low lines.
(higher low and lower high in prices are referred to hidden divergence, which are not considered in this indicator)
3. Compare the two standards with RSI and CMF indicators, send an alert if there is a divergence. As a result, the indicator will find four combination of divergence.
A. Higher high price / Lower RSI (Bearish RSI Divergence)
B. Lower low price / Higher RSI (Bullish RSI Divergence)
C. Higher high price / Lower CMF (Bearish CMF Divergence)
D. Lower low price / Higher CMF (Bullish CMF Divergence)
📌 Details
Developing the indicators, we put a lot of effort in making a customizable and user-friendly interface.
#1. Pivot Setting
Users can set the length to find the pivot high / pivot low in ‘Pivot Settings – Pivot Length.’
Increased pivot Length takes more candles to interpret the chart but reduce false signals since the it uses only the most certain pivot high / pivot low values. Obviously, decreased pivot length will act the opposite.
Users can choose whether to use ‘High/Low’ or ‘Close’ in ‘Pivot Reference’ to set the swing point of prices.
Users can also choose whether to display the pivot high / pivot low marker on the chart.
#2 RSI & CMF Settings
Users can adjust the length of RSI & CMF separately. (The default values are set to 14 and 20 each.)
#3 Label Setting
Users can adjust the text displayed on the chart label. (The default values is set to ‘Bullish / Bearish’, ‘RSI/CMF’, ‘Divergence’.)
Users can reduce the length of text label or simply turn the label off. Just click the ‘Bull/Bear’ or ‘None’ button. ‘Divergence’ works the same.
Users can decide whether to display the ‘Divergence Line and Label’, set custom settings for the label and line. (color, thickness, style, etc)
📌 Alert
Alert are provided as a combination of the chart's symbol and the set label text. For example,
‘BINANCE:BTCUSDT.P, Bullish RSI Divergence’
====================================================
"YD_Divergence_RSI+CMF" 지표 는 RSI와 CMF 지표를 이용해서 Divergence 를 찾아낼 수 있습니다.
📌 주요 기능
1. 정해진 가격 움직임 안에서 pivot high와 pivot low 포인트 를 찾아냅니다.
2. Pivot high로만 이어진 라인과, Pivot low로만 이어진 두 라인을 작도한 뒤 divergence의 기준으로 삼습니다.
이 지표에서는 normal divergence만 사용하기 때문에 차트에 higher high와 lower low만 표기 합니다.
(higher low와 lower high는 hidden divergence로 정의되며, 이 지표에서는 다루지 않습니다.
3. 두 기준선과 RSI, CMF 지표를 각각 비교하고, 결과적으로 4개의 조합을 구할 수 있습니다.
A. Higher high price / Lower RSI (Bearish RSI Divergence)
B. Lower low price / Higher RSI (Bullish RSI Divergence)
C. Higher high price / Lower CMF (Bearish CMF Divergence)
D. Lower low price / Higher CMF (Bullish CMF Divergence)
📌 세부 사항
지표를 개발하며 사용자들이 원하는 방향으로 지표를 설정할 수 있게 작업에 많은 공을 들였습니다. 굉장히 다양한 옵션을 선택할 수 있으며, 원하는 방식으로 지표를 사용할 수 있습니다.
#1 Pivot Setting
Pivot setting에서는 Pivot Length를 변경할 수 있습니다.
Pivot Length를 늘릴 경우, 보다 확실한 Swing High와 Swing Low만을 사용하게 되므로, False signal이 줄어들 수 있습니다. 하지만 Swing High/ Low를 판정하는 데에 더 긴 시간이 걸리게 되므로, Signal이 다소 늦게 발생하는 단점이 생기게 됩니다.
Pivot Length를 줄일 경우, 반대로 Swing High/Low의 판정이 더 빨리 일어나기 때문에, Signal을 거래에 이용하기는 좋을 수 있습니다. 다만, Swing High와 Low가 훨씬 더 잦은 빈도로 발생하기 때문에 False Signal을 줄 가능성이 높아집니다.
Pivot Reference에서는 가격의 Swing Point를 설정함에 있어, High/Low(고가/저가)를 이용할 지 Close (종가)를 이용할 지 선택할 수 있습니다.
Pivot High/Low Marker를 선택할 경우 Pivot High/ Low에 Marker가 찍히게 됩니다.
#2 RSI와 CMF Setting
RSI와 CMF Setting에서는 RSI와 CMF의 길이를 각각 설정할 수 있습니다. 기본값은 14와 20으로 설정되어 있습니다.
#3 Label Setting
Label Setting에서는 Label에 표시되는 글자를 선택할 수 있습니다.
기본값은 "Bullish / Bearish", "RSI/CMF", "Divergence"로 선택되어 있으며, 너무 길다고 느껴질 경우 "Bull/Bear" 혹은 "None"을 클릭하여 길이를 줄일 수 있습니다. 마찬가지로 Divergence의 경우도 생략이 가능합니다.
하단에서는 Divergence Line과 Label을 켜고 끌 수 있으며, 선의 색깔, 굵기, 종류, 그리고 Label의 색깔, 크기, 종류를 선택할 수 있습니다. Label의 Text 색 역시 변경이 가능합니다.
📌 얼러트
얼러트는 자신이 설정한 차트의 심볼과 Label의 문구의 조합으로 제공되며 예를 들면 다음과 같습니다.
"BINANCE:BTCUSDT.P, Bullish RSI Divergence" Индикатор

Discrete Fourier Transformed Money Flow IndexThe Discrete Fourier Transform Money Flow Index indicator integrates the Money Flow Index (MFI) with Discrete Fourier Transform (credit to author wbburgin - May 26 2023 ) smoothing to offer a refined and smoothed depiction of the MFI's underlying trend. The MFI is calculated using the formula: MFI = 100 - (100 / (1 + MR)), where a high MFI value indicates robust buying pressure (signaling an overbought condition), and a low MFI value indicates substantial selling pressure (signaling an oversold condition).
Why is the DFT and MFI combined?
The aim of this combination between DFT and MFI is to effectively filter out short-term fluctuations and noise, enabling a clearer assessment of the overall trend. This smoothing process enhances the reliability of the MFI by emphasizing dominant and sustained buying or selling pressures. This script executes a full DFT but only uses filtering from one frequency component. The choice to focus on the magnitude at index 0 is significant as it captures the dominant or fundamental frequency in the data. By analyzing this primary cyclic behavior, we can identify recurring patterns and potential turning points more easily. This streamlined approach simplifies interpretation and enhances efficiency by reducing complexity associated with multiple frequency components. Overall, focusing on the dominant frequency and applying it to the MFI provides a concise and actionable assessment of the underlying data.
Note: The FMFI indicator provides both smoothed and non-smoothed versions of the MFI, with the option to toggle the original non-smoothed MFI on or off in the settings.
Application
FMFI functions as a trend-following indicator. Bullish trends are denoted by the color white, while bearish trends are represented by the color purple. Circles plotted on the FMFI indicate regular bull and bear signals. Additionally, red arrows indicate a strong negative trend, while green arrows indicate a strong positive trend. These arrows are calculated based on the presence of regular bull and bear signals within overbought and oversold zones. To enhance its effectiveness, it is recommended to combine this indicator with other complementary technical analysis tools and integrate it into a comprehensive trading strategy. Traders are encouraged to explore a wide range of settings and timeframes to align the indicator with their unique trading preferences and adapt it to the current market conditions. By doing so, traders can optimize the indicator's performance and increase their potential for successful trading outcomes.
Utility
Traders and investors can employ this indicator to enhance their trend-following strategies. The white-colored components of the FMFI can help identify potential buying zones, while the purple-colored components can assist in identifying potential selling points. The red and green arrows can be used to pinpoint moments of strong bull or bear momentum, allowing traders to position themselves advantageously in their trading activities. Please note that future performance of any trading strategy is fundamentally unknowable, and past results do not guarantee future performance. Индикатор

Vorse4**Vorse4 Indicator**
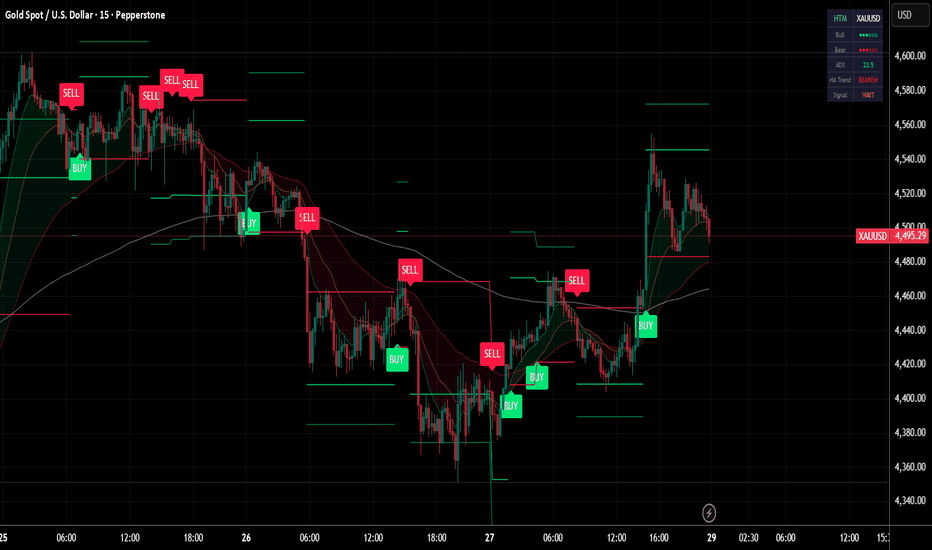
The Vorse4 Indicator is a technical analysis tool that combines Chaikin Oscillator, Intraday Momentum Index (IMI), MACD, and Parabolic SAR indicators. This indicator generates trading signals when all four indicators simultaneously provide buy or sell signals and visually presents these signals on the chart.
**How to Use:**
1. Buy signal: A buy signal is generated when there is a positive crossover in the Chaikin Oscillator, the IMI is above 50, the MACD line crosses the signal line upwards, and the price is above the Parabolic SAR. It is marked with a green arrow below the chart.
2. Sell signal: A sell signal is generated when there is a negative crossover in the Chaikin Oscillator, the IMI is below 50, the MACD line crosses the signal line downwards, and the price is below the Parabolic SAR. It is marked with a red arrow above the chart.
3. Turning zones: Areas with a high probability of transitioning from buy to sell or sell to buy are marked in yellow. These zones are determined by monitoring turning points in the Chaikin Oscillator, MACD, and Intraday Momentum Index.
**How to Apply:**
1. In your TradingView chart, go to the indicators menu and search for the "Vorse4" indicator.
2. Add the indicator to your chart. You will see green and red arrows indicating buy and sell signals, as well as yellow-colored areas representing turning zones on your chart.
3. Observe the buy and sell signals and trade according to your strategy. Analyze the performance of the indicator on historical data to evaluate the reliability of the signals.
**Note:** You can adjust the indicator parameters to balance the frequency and accuracy of buy and sell signals. Each strategy has a different risk-reward balance, so you can try different values to find the one that works best for you. Индикатор

Индикатор

Индикатор

swami_money_flow
Description:
Chaikin Money Flow was an indicator that measuring of the volume-weighted average of accumulation and distribution over a specified period (as cited from Fidelity) developed by Marc Chaikin, aim to identify the changes in buying or selling momentum of an asset that leads to the increase or decrease of asset prices. In the original format, the cross above 0 of money flow depicts a buying pressure, while a cross under 0 means a selling pressure. In this indicator, the money flow was displayed in a swami chart, used for detecting a change not only in one specified period but instead in multiple periods at once. Sequencing from the very below, the indicator capture the shift in money flow in shorter lookback periods, going through the very above the indicator capture the change of money flow in greater lookback periods. The color is set to gradient from red as indicating the negative money flow, while green indicates a positive money flow. A smoothing function was given (from Ehlers smoothing function) to reduce noises.
Money Flow:
cmf = n-day sum of( (((close - low) - (high - close)) / (high - low)) x volume )/ n-day sum of volume
smoothed = (4*cmf + 3*cmf + 2*cmf + cmf )/10
Notes:
the Darker the color indicates the higher the value e.g. dark red means more selling pressure, and vice versa
if the color is a lineup in a one period, indicates a strong signal (both directions)
very below is for a shorter period, and increasing through to the longest (1 - 30 by default)
Other Example
Индикатор