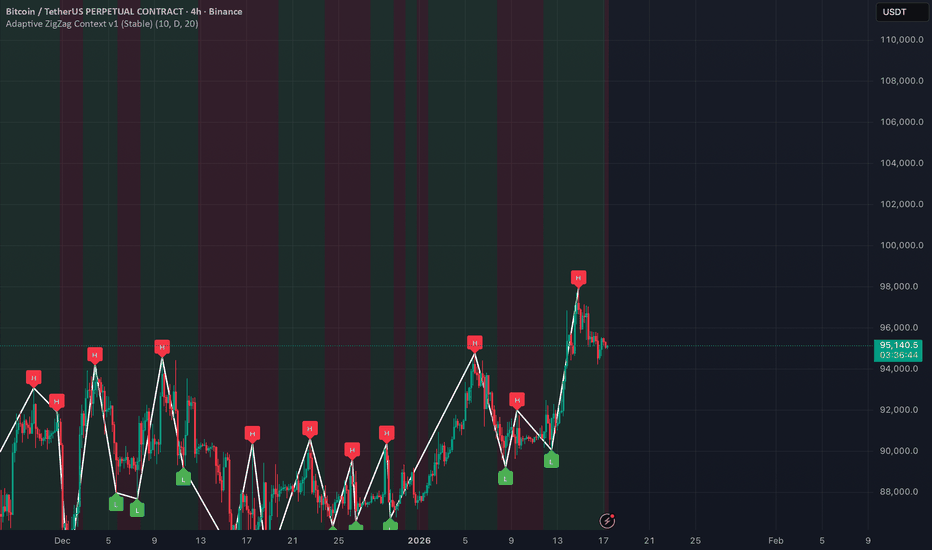
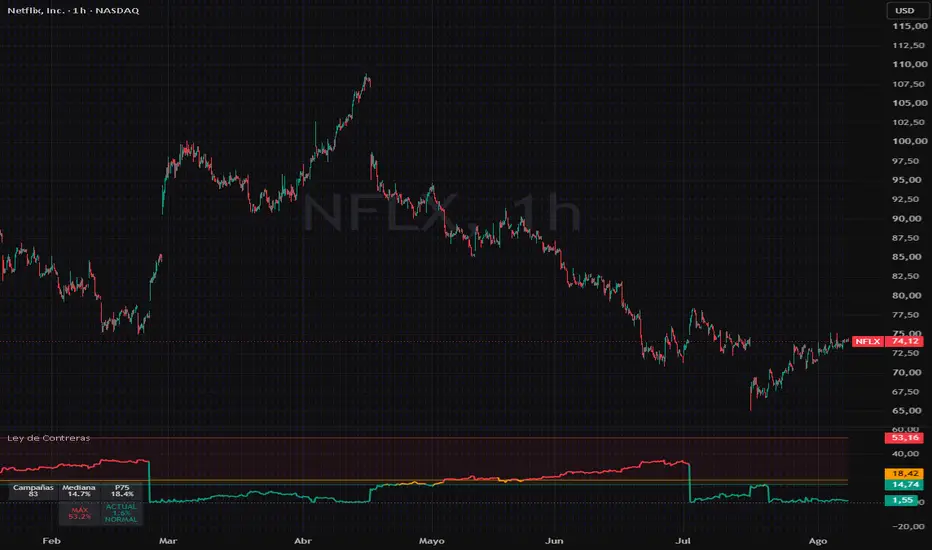
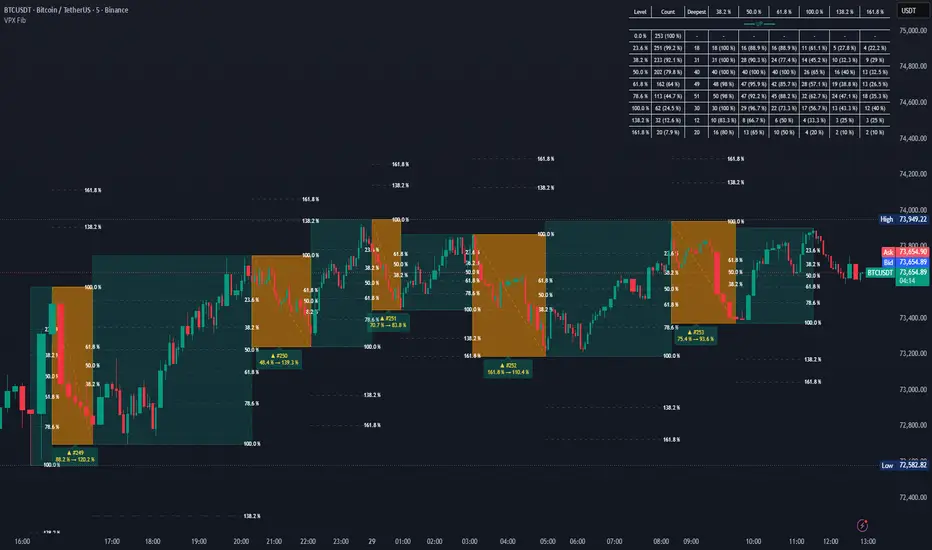
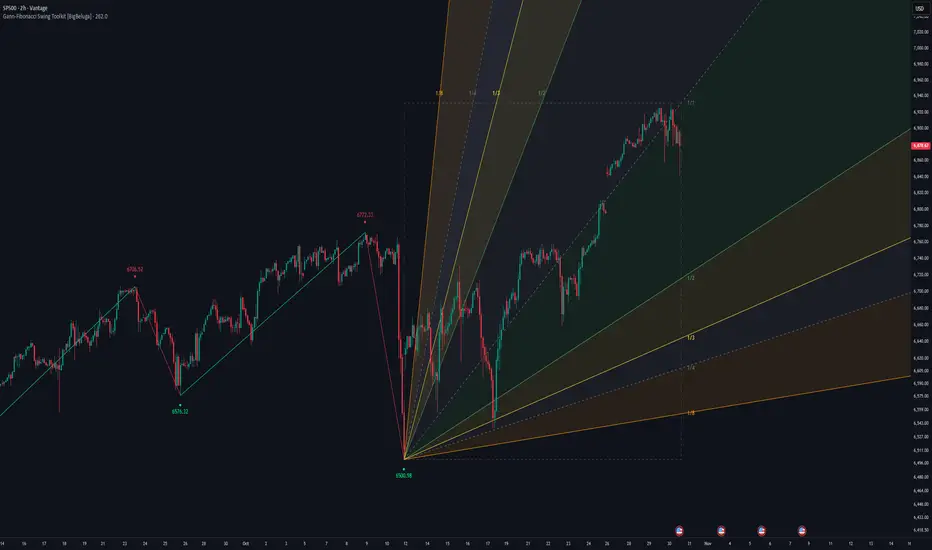
Khabib Takedown Fractal Nest Breakdown ViprasolKhabib Takedown — Fractal Nest Breakdown 🤼
CONCEPT
This tool looks for SELF-SIMILARITY in a decline: a big bearish leg (lower high -> lower low)
with a smaller bearish leg nested inside it that is a scaled copy — same shape, a fraction of
the size. When the small "fractal" completes in the direction of the big one (a break of the
last low), the structure grounds price -> SHORT. It is a fractal-echo measurement, not a plain
lower-low. The nesting ratio between the small leg and the big leg is the core filter.
HOW IT DETECTS
- Swings are found with confirmed pivot highs/lows (left/right bar lookback) and chained into a
lightweight zigzag.
- The tool reads the last four alternating swings (high, low, high, low).
- Big leg = first high minus first low; small leg = second high minus second low.
- A valid nest requires: lower high and lower low (bearish structure); big leg >= (Min big x ATR);
small leg positive; and the nesting ratio (small/big) inside the band .
- The signal fires when price closes below the most recent swing low and the bar closes red.
- ATR (Wilder) scales the minimum big-leg size across instruments and timeframes.
ENTRY / STOP / TARGET
- Entry: SHORT on the close of the confirming (red) bar that breaks the last low.
- Stop: above the second (inner) swing high plus an ATR buffer (default 0.3 x ATR).
- Target: entry minus R multiple x risk (default 2R, where risk = stop distance).
- The script draws the big leg and the nested small leg, plus filled TP and SL zones that extend
to the right until price touches one of them.
NON-REPAINTING
Pivots are only used once fully confirmed (they require the right-side bars), and the signal is
evaluated on bar close (barstate.isconfirmed). Drawings are created on the confirmed bar. The tool
does not repaint completed signals. Live, the forming bar can still change until it closes, as with
any bar-close tool.
FEATURES
- Fractal nesting (scaled self-similar legs), not a plain lower-low break.
- ATR-scaled minimum big-leg requirement and adjustable nesting-ratio band.
- Automatic R-multiple TP and ATR-buffered SL, drawn as zones that extend until hit.
- One-trade-at-a-time option and a minimum-bars-between-signals gap to reduce clustering.
- On-chart status table (open trades) and an alertcondition for automation.
INPUTS OVERVIEW
- Swing pivot left/right bars: swing sensitivity.
- Nesting ratio band (ratLo/ratHi): how close in scale the small leg must be to the big leg.
- Min big leg (x ATR) and ATR length: minimum move and volatility scaling.
- TP R multiple, SL buffer (x ATR), min bars between signals, one-trade-at-a-time.
- Visual colors, label offset, and zone transparency.
HOW TO USE
1. Add to any liquid symbol and timeframe; start with defaults.
2. Tighten the nesting-ratio band for stricter self-similarity, or widen it for more signals.
3. Raise Min big leg (x ATR) to demand larger, cleaner declines before a nest counts.
4. Use the drawn TP/SL zones for context; set an alert on the signal for hands-off monitoring.
5. Combine with your own trend/context read before acting.
LIMITATIONS
- This is a pattern/education tool, not a signal service, and not financial advice.
- Breakdown patterns fail; nesting geometry is a filter, not a guarantee. Losing signals will occur.
- Pivot confirmation adds inherent lag (it needs bars to the right of a swing to confirm).
- Very choppy or illiquid markets can produce misshapen legs and weak signals.
- Requires user discretion, risk management, and position sizing. No performance is implied.
CREDITS
The name is an inspirational sports homage only; it does not imply any endorsement or affiliation.
ATR uses Wilder's average true range. Pivot/zigzag swing detection uses standard public techniques.
The fractal-nest (scaled self-similar leg) geometry, the detection assembly, and the trade/zone
visualization are original Viprasol work.
Original Viprasol work; no third-party Pine code reused.
Индикатор

Ronaldo Bicycle Kick Orbit Break Reversal [ Viprasol ]Ronaldo Bicycle Kick — Orbit Break Reversal (Viprasol)
WHAT IT DOES (the idea)
Most reversal tools watch a single line. This one watches a region. It treats recent price structure as a set of confirmed swing points that "orbit" a structural centre of mass, and it trades the moment price escapes that orbit to the upside. Like a ball coiling around a centre and then leaving orbit — that break is the signal. The name is a sporting homage to a spectacular finish; the tool itself is pure geometry.
HOW IT DETECTS
1. Swings: a lightweight zigzag keeps the last several confirmed pivots. A pivot is only accepted after the required number of bars close to its right, so swings do not move once printed.
2. Orbit geometry: from the last K swings (default 6) it computes the geometric centroid — the mean bar position and mean price. It then measures the average (root-mean-square) distance those swings sit from the centroid price. That distance, scaled by "Orbit radius," becomes the orbit ring. A minimum radius floor (in ATR) filters out flat, meaningless rings.
3. Escape: the setup arms only when the orbit is valid. The signal fires on the first bar that CLOSES above the top of the orbit ring (centroid price + radius) having closed at or below it on the prior bar.
ENTRY / STOP / TARGET
- Entry: the close of the escape bar (long only).
- Stop: the lowest swing price inside the orbit, minus an ATR buffer.
- Target: Entry + R multiple x risk (default 2R), where risk = Entry - Stop.
Each trade draws an entry line plus filled TP and SL zones that extend forward bar by bar until price touches one of them, then freeze.
NON-REPAINTING
Signals are built from confirmed pivots and only evaluated on a confirmed (closed) bar. Nothing is placed on the developing bar, so a printed signal does not disappear or shift on later ticks. The dotted "live orbit" preview is a forward-looking sketch of the current geometry and is not a signal.
KEY FEATURES
- A real orbit ellipse is drawn around the centroid so you can see the ring being broken.
- Extend-until-hit TP/SL zones with a one-trade-at-a-time option.
- Optional hide-new-setup-while-in-trade to reduce clutter.
- Adjustable pivot width, swing count, orbit radius, ATR floor, R multiple, stop buffer, and a minimum-bars-between-signals gap.
INPUTS OVERVIEW
Swing pivot left/right bars; swings used for the orbit; minimum swings for validity; orbit radius multiplier; minimum orbit radius in ATR; ATR length; TP R multiple; SL ATR buffer; signal gap; one-trade toggle; visual colours and label offset.
HOW TO USE
1. Add to any liquid symbol and timeframe; it works on all.
2. Watch for the dotted orbit ring to form around recent structure.
3. Take note when a bar closes above the ring and the GOAL label prints.
4. Use the drawn entry, TP, and SL zones as a visual trade map; adjust the R multiple and stop buffer to your own plan.
5. Raise the pivot width or ATR floor on noisy, low-timeframe charts to demand cleaner structure.
LIMITATIONS (honest)
- This is a pattern and education tool, not a signal service or an autotrading system. It highlights a geometric condition; it does not predict outcomes.
- Long-only by design. It will not flag downside setups.
- In strong one-way trends the orbit ring can be escaped repeatedly; in choppy ranges valid orbits may be sparse. Context and discretion still matter.
- Requiring confirmed pivots means the orbit is defined slightly after a swing forms, which is the cost of non-repainting behaviour.
- Past behaviour of any pattern does not guarantee future results.
CREDITS
Built on public, well-known concepts: Average True Range (J. Welles Wilder) for volatility scaling, and standard pivot/zigzag swing detection. The orbit-centroid geometry and the escape logic are original Viprasol work. The "Bicycle Kick" name is an affectionate sporting homage and does not imply any endorsement or affiliation.
This script is an educational tool and is not financial advice. Trade your own plan and manage risk.
Original Viprasol work; no third-party Pine code reused.
Индикатор

Elliott Impulse Engine [WillyAlgoTrader]📊 Elliott Impulse Engine (EIE) is an overlay indicator that counts a full Elliott cycle — impulse 0-1-2-3-4-5 plus correction A-B-C — completely automatically, using a Change-of-Character (CHoCH) trigger to start each count, a strict state machine to accept every wave point, Fibonacci target boxes to show where the next point is expected, a dashed "ghost" projection of the entire remaining path, and a trailing red invalidation line that tells you the exact price where the current count dies.
The core insight: most Elliott Wave tools either repaint their labels endlessly or force you to draw everything by hand. EIE does neither. It treats every count as a hypothesis : a CHoCH break seeds it, each confirmed pivot advances it one wave at a time, and a single hard price level can kill it. When the hypothesis dies, the chart is wiped clean and the engine waits for the next CHoCH — no stale labels, no silent redrawing of history. You always know three things at a glance: what wave the market is in, where price should go next, and where the idea is wrong.
Works on any symbol and any timeframe. Free and open for everyone.
🧩 WHY THESE COMPONENTS WORK TOGETHER
A ZigZag alone gives you swings but no wave logic. A Fibonacci tool alone gives you levels but no structure. A CHoCH detector alone tells you the trend flipped but not what comes next. And a manual Elliott count gives you structure but demands hours of drawing and constant re-labeling.
EIE chains all of these into one pipeline:
Swing structure engine → CHoCH detection → count seeding (point 0 + point 1) → fib grid on leg 0-1 → target boxes for points 2/3/4 → pivot-based point acceptance with soft-marking → ghost projection of the remaining path → trailing invalidation level → reset with a stated reason
The swing engine finds structural highs and lows. A confirmed close through a swing level against the previous trend is a CHoCH — the only event allowed to start a new count, so counts always begin at genuine structure shifts, not random noise. The moment leg 0-1 is confirmed, the engine builds a Fibonacci grid on that leg and projects the whole expected structure forward as a dashed ghost path. Each subsequent wave point is accepted from a separate, faster pivot stream, checked against its expected fib range, and either labeled clean ("2") or soft-marked ("2~") if it landed outside the range. At every state the engine maintains exactly one critical price — the trailing invalidation level — and if price breaks it, the count is declared dead with an explicit reason (BELOW_0, BELOW_W2, W3_SHORTEST, and so on), the markup is wiped, and the engine returns to scanning.
No single public tool does this loop. The combination turns Elliott counting from a subjective drawing exercise into a rule-driven process you can watch unfold bar by bar.
🔍 WHAT MAKES IT ORIGINAL
1️⃣ CHoCH-seeded counting — every count starts at a real structure break.
The engine tracks swing highs and lows using symmetric pivots (default 10 bars left / 10 bars right). A break is registered only on a confirmed bar close through the swing level. If that break goes against the current internal trend, it is a CHoCH — and only then does the engine arm a new count: point 0 is set to the extreme of the run that preceded the break, and the engine waits for a with-trend pivot beyond the CHoCH level to lock point 1.
Anti-noise guards built into the seeding:
— a warm-up gate (no CHoCH before max(3 × swing length, 50) bars of history),
— an optional cooldown (N bars after any count ends before a new CHoCH may seed),
— a level lock: after an invalidation, the same CHoCH level cannot immediately re-seed a new count (compared with half-a-tick tolerance, so floating-point equality can never leak a duplicate seed).
Why this matters: counts started from random pivots produce random labels. Counts started from structure breaks start where trend logic actually changed.
2️⃣ Non-blocking Fibonacci ranges with soft-marking — geometry informs, price decides.
Each wave point has an expected fib range measured on the 0→1 grid (retracement for 2, negative extension beyond point 1 for 3, 5 and B; point 4 uses its own 2→3 grid; C uses 0→1 again):
— Point 2: 0.5 – 0.705 (retracement of 0→1)
— Point 3: −0.5 – −0.618 (extension beyond point 1)
— Point 4: 0.5 – 0.705 (retracement of leg 2→3)
— Point 5: −0.618 – −1.0
— Point B: −0.5 – −0.618
— Point C: 0.0 – 0.236
The fib level of any price p on the 0→1 grid is computed as L = (p1 − p) / (p1 − p0); on the 2→3 grid as F = (p3 − p) / (p3 − p2). A pivot inside its range is labeled clean ("3"); a pivot outside it is still accepted but soft-marked ("3~") — because in real markets a valid wave frequently overshoots textbook levels. Only the hard invalidation rules can reject a point. Every range is a user input (min/max per point), so you can tighten or widen the geometry to your market.
Why this matters: strict-range engines discard perfectly good structure; free-form engines accept garbage. Soft-marking keeps the count honest while telling you visually which points are textbook and which are stretched.
3️⃣ Ghost projection — the whole remaining path drawn before it happens.
As soon as leg 0-1 is confirmed, EIE draws a dashed projection of every remaining point: 2? 3? 4? 5? A? B? C?. Each ghost point is placed inside its fib range at a position you choose (Middle of the range, Near edge, or Far edge), and spaced horizontally at step = round((b1 − b0) × coefficient) bars — i.e., the time geometry of the projection scales with the actual duration of leg 0-1. Ghost point 5? sits at extension −1.0 plus a configurable offset.
The projection is re-anchored from every newly accepted real point : once point 2 locks, the ghost path redraws starting from the real 2; once point 3 locks, from the real 3, and so on. Point 4's ghost is computed on the 2→3 grid using the best available references (real points when confirmed, ghost estimates before that).
Why this matters: you see the expected shape of the entire move — including the A-B-C correction after the impulse — while the impulse is still in wave 2.
4️⃣ Trailing invalidation level — one red line that answers "where am I wrong?".
At every state the engine maintains exactly one critical level, drawn as a dashed red line with an "INVALID + price" label:
— waiting for 1 / wave 2 in progress: point 0
— wave 3 before point 1 is broken: point 0; after the break: point 2
— wave 4: point 2
— wave 5 before point 3 is broken: point 2; after the break: point 4
— correction A/B/C: point 2
A break of this level resets the hypothesis with a named reason. The check runs every bar, before pivot processing , so a violent bar cannot both break the invalidation level and sneak a new wave point into the count on the same bar. Wick-driven pivots that slip past a close-based check are caught by a second, pivot-level guard (a pivot beyond point 2 / point 4 in the protected phases also triggers the reset). Classic Elliott rules are enforced on top: wave 2 may never retrace below point 0, wave 4 may never enter below point 2, and if wave 3 turns out shortest among 1, 3 and 5 at the moment point 5 is proposed, the count is rejected with reason W3_SHORTEST.
Why this matters: an Elliott count without a falsification level is a story, not a hypothesis. EIE makes the falsification price explicit on every bar.
5️⃣ Two-speed pivot system — stable structure, fast confirmation.
Structure and CHoCH run on the main swing length (default 10/10). Wave points 1-5 and A-C are accepted from a separate, shorter pivot stream (default 5/5, always ≤ swing length — validated at load). This decouples two jobs that a single pivot length cannot do well simultaneously: the long pivots keep the structural skeleton stable, the short pivots confirm wave points with roughly half the lag.
A dedicated backfill scan (up to ~480 bars) closes the pivot-lag gap for point 2: when point 1 locks or repositions, the engine re-scans all bars since point 1 for the true retracement extreme, so the best low/high inside the confirmation window is never missed. If price breaks point 1 before any counter-trend pivot confirmed point 2, the tracked extreme itself is accepted as point 2 and wave 3 is activated immediately.
Why this matters: one pivot length forces a trade-off between stability and speed. Two lengths plus a backfill scan give you both.
6️⃣ Repositioning logic — labels refine forward, never silently rewrite history.
Until the next wave locks, the engine allows controlled repositioning: a higher high repositions point 1 (rebuilding the grid and the point-2 box on the new geometry), a deeper pullback repositions point 2 (only until point 1 is broken — after the break, a deeper pivot is an invalidation, not a reposition), point 3 extends while wave 4 forms, point 4 deepens until point 3 is broken, point 5 extends during the correction, A deepens until B appears, B rises until C appears. Every reposition deletes and redraws only the affected segment and label, and the associated target box and its center line are rebuilt on the fresh grid — no stale geometry is left behind.
Why this matters: this is the honest middle ground between "repaints everything" and "freezes wrong labels forever". The rules for what may move, and until when, are fixed and stated.
7️⃣ OTE target boxes for points 2, 3 and 4 — the next objective is always a zone, not a guess.
When point 1 locks, a yellow box covering the point-2 fib range appears with a dashed center line at the range midpoint. When point 2 locks, the point-3 target box (on the extension side) appears. When point 3 locks, the point-4 box appears on the 2→3 grid. Each box extends forward a configurable number of bars (default 20) and its right edge snaps to the bar where the point actually forms. Box fill transparency adapts to the theme (65 dark / 55 light); the border and center line stay fully opaque.
Why this matters: "wave 4 should come" is vague. "Wave 4 is expected inside this drawn box, centered here" is actionable.
8️⃣ Explicit reset reasons + persistent CHoCH history — the chart tells you why.
Every count ends with a machine reason: FALSE_CHOCH (price broke back through point 0 before point 1 formed), BELOW_0, BELOW_W2, BELOW_W4, W3_SHORTEST, DEEP_C (correction retraced beyond point 2), TIMEOUT (optional: state lasted longer than k × leg 0-1 duration), B_ABOVE_5 (the "correction" broke above point 5 — the impulse is closed as done), or DONE (point C accepted, full cycle complete). On invalidation a ✖ marker with the reason in its tooltip is placed on the bar, and the dashboard keeps showing the last reason.
The active markup is wiped on reset — but CHoCH lines and labels live on a separate persistent layer (FIFO history, up to 100, default 50). When price later closes back through a CHoCH level, that line is clipped to the mitigation bar and turns dotted. So your chart accumulates a clean structural map of every trend change while dead counts disappear.
A special same-bar case is handled explicitly: if a reset and a fresh opposite CHoCH land on the same bar (with cooldown off), the engine wipes first, then seeds the new count on that same bar — the new hypothesis is never lost to ordering.
Why this matters: most auto-counters just vanish or redraw without explanation. EIE always states its reason, and the CHoCH map survives as context.
9️⃣ Anti-repaint discipline — confirmed pivots, close-confirmed breaks, honest Wick mode.
Three independent mechanisms:
— All pivot values are consumed only on confirmed bars: a forming real-time bar can make a pivot flicker, so transient pivot values are masked out and can never trigger an irreversible state transition. Historical bars are unaffected (they are all confirmed).
— In the default Close confirmation mode, invalidation breaks and wave-top breaks are evaluated only on the confirmed bar close — an intrabar excursion of the close cannot fire a reset that "un-happens" seconds later.
— The optional Wick mode reacts to any intrabar touch — faster, and by design irreversible within the bar. This is stated openly so you can choose speed vs. strictness.
Zone-entry events (price entering the point-2 OTE zone, the point-4 box, or tagging the −1.0 target) intentionally use wick extremes — a touch is a touch — and are one-way flags.
🔟 Theme-adaptive visual system with auto-contrast labels.
Theme is Auto-detected from the chart background (or forced Dark/Light). By default, long counts use a theme-adaptive green (dark green on light charts, bright green on dark charts) and short counts use red. If you enable custom colors, label text color is derived from the luminance of your chosen background — luma = 0.299R + 0.587G + 0.114B, threshold 140 — so digits stay readable on any shade you pick. The fib grid uses role-based color inputs (red 0.236, teal 0.705 OTE, blue retracement levels, gray round levels), all editable. Label font size is selectable from Tiny to Huge.
⚡ HOW IT WORKS — CALCULATION FLOW
Step 1 — Structure scan: Symmetric pivots (default 10/10) maintain the latest swing high and swing low; the engine also tracks the running extreme since the last swing (the future point 0).
Step 2 — CHoCH: A confirmed close through a swing level against the internal trend flips the trend and — if the engine is idle, cooled down, and the level is not locked — seeds a count: direction, CHoCH level, point 0.
Step 3 — Point 1: The first fast pivot beyond the CHoCH level becomes point 1. The 0→1 fib grid, the point-2 target box, and the full ghost projection are drawn.
Step 4 — Impulse counting: Fast counter-trend pivots propose points 2 and 4; fast with-trend pivots propose 3 and 5. Each is checked against its fib range (clean or "~"), each unlocks the next state, target boxes appear for the next objective, and the ghost path re-anchors from every real point.
Step 5 — Hard rules per bar: Before any pivot is processed, the trailing invalidation level is checked (Close or Wick mode). Wave 2 below point 0, wave 4 below point 2, a broken point 4 in late wave 5, or a shortest wave 3 all kill the count with a named reason.
Step 6 — Impulse complete: Point 5 accepted → the impulse counter increments and the engine rolls into correction tracking.
Step 7 — Correction A-B-C: A forms on a counter-trend pivot, B on a with-trend pivot (a B at or beyond point 5 closes the whole structure as B_ABOVE_5 instead), C completes the cycle → DONE.
Step 8 — Reset: On any ending — invalidation or completion — the active markup is wiped, the cooldown starts, and the engine returns to scanning. CHoCH history stays.
📖 HOW TO USE
🎯 Quick start (works even if you have never counted a wave):
1. Add the indicator to a clean chart. Nothing to configure — defaults are ready to use.
2. Wait for a CHoCH label. That is the engine saying: "the trend character just changed, I am watching for a new impulse here."
3. When labels 0 and 1 appear, the count is live. The dashed gray path with 2? 3? 4? 5? A? B? C? is the expected roadmap of the entire move.
4. Watch the yellow box — that is where the next wave point is expected. The dashed line inside it is the center of the zone.
5. Keep one eye on the red dashed INVALID line at all times. If price breaks it, the count is over — a ✖ appears, the markup clears, and the engine starts hunting for the next CHoCH. Hover the ✖ to read the exact reason.
👁️ Reading the chart:
— 🟢 Green numbered labels (0, 1, 2, 3, 4, 5) = accepted impulse points of a long count; red labels = a short count. Letters A, B, C = the correction.
— A label with ~ (like "2~") = the point is accepted, but it landed outside its textbook fib range — the count continues, treat it with slightly more caution.
— Solid colored path = confirmed structure. Dashed gray path with "?" labels = the ghost projection of what is still expected.
— 🟡 Yellow boxes = target zones for points 2, 3 and 4, each with a dashed center line.
— Dotted horizontal grid = the Fibonacci grid of leg 0-1 (retracements 0.236…1.0 above, extensions −0.5 / −0.618 / −1.0 below), each level labeled with its ratio and price.
— 🔴 Red dashed line + "INVALID price" = the trailing invalidation level of the current count.
— Dashed horizontal CHoCH lines = historical structure breaks; a line that turns dotted has been mitigated (price closed back through it).
— ✖ = the count was invalidated on this bar (reason in the tooltip).
📊 Dashboard fields:
— State: current phase (Scanning / CHoCH · wait 1 / Wave 2…5 / Corr · A-B-C).
— Direction: Long, Short, or — when idle.
— Invalidation: the current critical price.
— Last Reset: why the previous count ended (reason, DONE, or B_ABOVE_5). Resets on chart reload.
— Impulses: completed 5-wave impulses on the loaded history. Resets on chart reload.
— TF: chart timeframe. Version: engine version.
🔧 Tuning guide:
— Counts appear too rarely: lower Swing Detection Length (structure forms faster, more CHoCH seeds) — or the market is simply ranging without character changes.
— Too many counts die instantly (FALSE_CHOCH / BELOW_0): raise Swing Detection Length, or add a Cooldown of 5-20 bars so the engine skips the chop right after a failed count.
— Points confirm too slowly: lower Point Confirmation (min 1); remember it must stay ≤ Swing Detection Length.
— Too many "~" soft marks: widen the fib ranges for those points — your market may simply run hotter than the defaults.
— Old counts hang around in dead phases: set Timeout k > 0 (e.g. 3.0) — any state lasting longer than k × the duration of leg 0-1 resets automatically.
— Chart feels crowded: toggle off the Fib Grid, OTE Boxes, or the Projection independently; reduce Historical CHoCH; shrink label font size.
⚙️ KEY SETTINGS
⚙️ Main Settings:
— Swing Detection Length (default 10): pivot length for structure and CHoCH. Higher = larger structure, fewer seeds.
— Point Confirmation, bars (default 5): the separate short pivot used to accept wave points. Must be ≤ swing length (validated).
— Breaks: Invalidation Mode (default Close): Close = confirmed bar close beyond the level (non-repainting); Wick = any intrabar touch (instant, irreversible within the bar).
📐 Point Ranges (fib): min/max expectation range per point — Point 2 (0.5–0.705), Point 3 (−0.5…−0.618), Point 4 (0.5–0.705 on the 2→3 grid), Point 5 (−0.618…−1.0), Point B (−0.5…−0.618), Point C (0–0.236). All validated at load (2 and 4 must be inside (0,1); 3, 5, B must be negative; C inside [0,1); no zero-width ranges).
👻 Ghost Projection:
— Show Projection (on), Point Inside Range (Middle / Near / Far), Time Step Coef (default 1.0 × leg 0-1 duration), 5?: Offset From −1.0 (default 0.05).
♻️ Reset:
— Cooldown After Reset, bars (default 0 = off) and Timeout, k × leg 0-1 (default 0 = off; in the wait-for-1 phase the timeout scales on swing length instead, since no leg exists yet).
🎨 Visual Settings: Theme (Auto / Dark / Light), Fib Grid toggle, OTE Boxes toggle, CHoCH layer toggle, Path Width (2), Box Length Forward (20), Historical CHoCH max (50), Label Font Size (Tiny…Huge), Watermark toggle.
📏 Grid Levels: individual on/off for 0.236, 0.382, 0.5, 0.618, 0.705, 0.786, 0.886, 1.0, −0.5, −0.618, −1.0.
🎨 Colors: Use Custom Colors switch (off = theme-adaptive defaults), long/short point label backgrounds (text auto-contrasts), target box color, path and ghost colors, bull/bear CHoCH colors, and role-based fib grid colors.
📊 Dashboard: on/off, position (5 anchors), font size (the version row renders one step smaller).
🔔 ALERTS
Ten alert conditions covering the full lifecycle:
— 🟢 1. CHoCH + projection — CHoCH confirmed, movement projection built
— 🟡 2. Price in W2 OTE — price entered the point-2 zone
— 🟢 3. Point 2 accepted
— 🟢 4. Break of point 1 — wave 3 active
— 🟡 5. Price in W4 box
— 🟢 6. Break of point 3 — wave 5 active
— 🎯 7. Target −1.0 reached
— 🟢 8. Impulse complete — point 5 locked
— 🎯 9. Target C — correction complete, full cycle done
— 🔴 10. Invalidation — hypothesis reset
In addition, the engine fires dynamic alert() messages on every reset and on B_ABOVE_5 completion, including the reason text. In Close mode these announce on confirmed bar close; in Wick mode once per bar.
⚠️ IMPORTANT NOTES
— 🚫 No repainting of confirmed structure. Pivots use equal left/right lookback and their values are consumed only on confirmed bars; CHoCH breaks require a confirmed close; in the default Close mode, invalidation and wave-top breaks are evaluated on confirmed closes only. A pivot is, by nature, confirmed N bars after the actual extreme — the indicator draws from the confirmed bar backward to the true swing point. This is delayed confirmation, not repainting of settled values.
— 📐 Controlled repositioning is part of the design. Until the next wave locks, the latest point may legitimately move to a more extreme pivot (e.g., point 1 to a higher high). The rules for what may move, and until when, are fixed and described above. Wick mode reacts intrabar by design and is irreversible within the bar.
— 📊 The Impulses counter and Last Reset field are computed on loaded chart history and reset when the chart reloads.
— ⚖️ EIE counts one impulse degree at a time from the latest CHoCH. It does not label nested sub-waves, diagonals, or complex W-X-Y corrections — it is a focused impulse + zigzag engine, and the fib ranges reflect one practical interpretation of Elliott guidelines, which you can re-tune.
— 🛠️ This is a wave-counting and projection tool, not an automated trading system. It identifies structure, projects expected zones, and shows the invalidation price — trade decisions remain yours.
— 🌐 Works on all markets (crypto, forex, stocks, indices, commodities) and all timeframes. Индикатор

Leg Anatomy - Measured Retracement and ExtensionEvery trader draws the same three numbers on every chart: 38.2, 50 and 61.8. Those numbers were not derived from this market, this timeframe, or this instrument. They were not derived from any market. They are a convention that spread because it spread.
This script measures the real thing instead.
WHAT IT MEASURES
Price is broken into confirmed swing legs. A running extreme is tracked, and when price closes back from that extreme by more than a configurable multiple of ATR, the extreme is confirmed as a swing and a new leg begins.
Every completed leg is measured as a ratio of the leg immediately before it. A leg that travelled 60 percent of the previous leg records 0.60. A leg that went 140 percent past it records 1.40. That single number, the leg-to-leg ratio, is the entire dataset.
From the last N legs on the chart you have open, the panel reports:
The median leg, expressed as a multiple of the one before it.
The interquartile range, the middle half of the distribution.
The share of legs that were shallow, under 0.62.
The share that were deep, between 0.62 and 1.00.
The share that were extensions, past 1.00.
On some symbols and timeframes the conventional levels sit close to the measured centre. On many they do not, and the gap between what a chart actually does and what the convention assumes is visible in one row of the panel.
THE PROJECTION
The distribution is not left as a table. It is applied forward.
The leg currently forming starts from the last confirmed swing, and the leg before it has a known size. Multiplying that size by the measured median, upper quartile and ninetieth percentile gives three projected endpoints, drawn as a shaded zone in front of price with a dashed median line and a price label.
The panel shows how far the forming leg has travelled as a percentage of its median expectation. Below 100 percent the leg is still inside its normal range. Above it, the leg has already outrun the typical case for this chart, which is information whether you are holding it or fading it.
The zone is not a forecast. It is where the middle of the distribution sits, and roughly half of past legs fell short of it.
THE SKELETON
Confirmed legs are drawn as a thick zigzag across the chart, each one labelled with its own ratio, so the distribution in the panel can be read directly off the price action that produced it. Candles are tinted by the direction of the leg currently forming.
Because swings only confirm on closed bars and a confirmed swing is never revisited, the skeleton behind price is final. Only the leg at the right edge is still forming, and the projection zone updates only when a new leg is confirmed.
SETUPS
When a swing confirms, a new leg begins, and the script produces a complete setup at that close.
The stop sits just beyond the swing that was just confirmed, plus an ATR buffer. That swing is the level the leg depends on. If it goes, the leg reading was wrong.
The three targets are the lower quartile, the median and the upper quartile of the measured distribution, projected from the swing. They are not multiples of risk and they are not conventional ratios. They are the shape of this chart's own legs.
Only one setup is tracked at a time. The panel records whether the first target or the stop was reached first, and prints collecting until the sample is large enough to mean anything. That number measures one mechanical rule and is not a backtest.
SETTINGS
Reversal Threshold is the only structural dial. It decides what counts as a leg. A low value produces many small legs and a distribution dominated by noise. A high value produces few large legs and a distribution with a small sample. The default sits between the two, and changing it changes the entire analysis, which is the point: a leg on a scalping horizon is not a leg on a swing horizon, and the measured distribution should differ between them.
Volatility Length sets the ATR lookback used for the reversal threshold and the stop buffer.
Legs Kept In Sample bounds the history, so the distribution tracks the current regime instead of averaging in a market from years ago.
REPAINTING
Swing confirmation, leg measurement, the distribution, setups and alerts all evaluate on confirmed bars. A confirmed swing is never moved and a drawn leg is never redrawn. The projection zone in front of price is recomputed only when a new leg begins. The script requests no higher timeframe data.
HOW TO READ IT
Start with the three share rows. If a chart shows most of its legs under 0.62, it is a market that retraces shallowly and continuation is the base case. If most legs sit between 0.62 and 1.00, it is a market that gives deep pullbacks and entering early is expensive. A high share above 1.00 is a trending regime where each leg outruns the last.
Then look at the forming leg's progress. A leg at 40 percent of median with a distribution that favours extension is a different situation from a leg at 130 percent in a market that rarely extends.
The ratios printed on the skeleton let you check the panel against your own eyes rather than trusting it.
This is an analysis tool, not financial advice, and not a trading system. A measured distribution describes what happened, not what will. Sample sizes are small by the standards of statistics and regimes change. Use it with your own risk management and position sizing. Индикатор

Fractal ZigZag with Retest & Filters By WiselyWealthIndicator ; Fractal ZigZag with Retest & Filters
Introduction
Welcome to the comprehensive guide for the 'Fractal ZigZag with Retest & Filters' indicator. This custom-built Pine Script indicator is an advanced technical analysis tool designed explicitly for the TradingView platform. At its core, the primary objective of this script is to provide traders with high-probability entry signals by systematically filtering out market noise, avoiding false breakouts, and ensuring alignment with the overarching macroeconomic trend.
Many retail traders fall into the trap of entering positions during sudden, volatile price spikes, only to suffer heavy drawdowns when the market naturally pulls back. This script mitigates that risk by enforcing a strict, rules-based approach: identifying structural shifts, confirming the initial breakout, and mathematically demanding a pullback (or "retest") before issuing a final trading signal. Additionally, it features built-in alert conditions, making it perfectly suited for algorithmic traders who wish to automate their strategies via Webhooks, Telegram bots, or MT5 API integrations.
Technical Mechanism
The mechanical operation of this script is multi-layered, relying on a confluence of structural mapping, trend filtering, and volatility-based retest calculations. Here is a detailed, step-by-step technical breakdown of how the script detects and generates its buy and sell signals:
Mapping Market Structure with Williams Fractals:The foundation of the script relies on identifying key swing highs and swing lows using Williams Fractals. By default, the indicator evaluates a 5-bar lookback and look-forward period to pinpoint these structural pivots. Once a valid upward or downward fractal is identified, the script connects them using a dynamic ZigZag line. This creates an unambiguous visual map of the market's underlying structure, cleanly displaying the sequence of higher highs or lower lows.
Initial Breakout Identification: The indicator actively monitors the current closing price in relation to the most recently confirmed fractal levels. A raw bullish breakout is registered the moment a candle closes definitively above the last established fractal high. Conversely, a raw bearish breakout is noted when the closing price drops below the most recent fractal low. To prevent redundant alerts, the script locks the current trend state upon a successful breakout.
The ATR-Based Retest Engine: This is the most sophisticated aspect of the indicator. When "Enable Retest Mode" is activated, the script refuses to issue an immediate entry signal at the exact moment of the breakout. Instead, it uses the Average True Range (ATR) over a 14-period lookback to measure current market volatility. For a bullish setup, it calculates a "Retest Target" by subtracting a user-defined ATR multiplier (default 1.0) from the breakout close price. It then starts a countdown timer, allowing a maximum number of candles (default 3) for the price to drop back down and touch this target. If the pullback is successful within the time limit, the raw buy signal is triggered. If the time expires without a retest, the setup is safely invalidated.
Macro Trend Filtering: Before finalizing any signal, the script consults a 200-period Exponential Moving Average (EMA). If the trend filter is enabled, a buy signal is entirely suppressed unless the closing price is strictly above the EMA200. Sell signals similarly require the price to remain below the EMA200. Users can also force the script into a "Buy Only" or "Sell Only" mode to align with their long-term directional bias.
How to Use and Best Practices
To extract maximum profitability and accuracy from this script, traders must apply the correct settings and deploy it in appropriate market environments.
Recommended Settings and Configuration:
Conservative Swing Trading: Ensure the EMA200 Trend Filter remains enabled to keep you on the side of institutional momentum. You may also want to increase the Fractal Periods from 5 to 7 or 9. This filters out minor price fluctuations and forces the script to base its breakouts on major structural swing points.
Retest Calibration for Volatility:** The default ATR multiplier is 1.0, and the wait limit is 3 candles. If you are trading on lower timeframes (e.g., 5-minute or 15-minute charts), breakouts can take slightly longer to retest. Consider increasing the "Max Candles to wait" to 5 or 6. For highly volatile assets, increasing the ATR Multiplier to 1.5 can help you secure a deeper, more favorable pullback entry.
Directional Lock: If higher timeframe analysis dictates a strong bull market, use the "Trade Direction" setting to restrict signals to "Buy Only," eliminating counter-trend noise during minor market corrections.
Suitable Markets and Timeframes:
Forex and Indices: This indicator performs exceptionally well on major Forex pairs (EUR/USD, GBP/JPY) and Global Indices (US30, NAS100) on the 1-Hour and 4-Hour timeframes. These assets heavily respect market structure, and liquidity grabs (retests) are highly common after structural breakouts.
Cryptocurrency: Bitcoin and Ethereum on the 15-minute to 1-Hour charts are excellent candidates, provided you adjust the ATR multiplier to account for crypto's volatile, whipsaw movements.
Markets to Avoid: Avoid using this script in heavily consolidated, range-bound, or sideways markets. Breakout and trend-continuation logic inherently struggles during prolonged periods of low volatility, where price chops indiscriminately around the 200 EMA without clear directional follow-through. Индикатор

TL Elliott Wave Pro - Rule Checked 12345 ABC Count + Fibs + FVGTL ELLIOTT WAVE PRO — the complete Elliott Wave rule set in one indicator: the count, the three golden rules, the three guidelines, all four fibonacci tools and the fair value gap that turns a level into a trade.
Elliott Wave is usually taught as a picture and traded as a feeling. This indicator turns it into something you can actually check: it labels the impulse, it tells you which of the three golden rules currently hold, it measures every wave against the fibonacci relationships the theory is built on, and the moment a rule breaks it says so instead of quietly redrawing the count into something that still looks right.
Everything below comes from the classic rule set. Nothing is invented, nothing is hidden.
━━━ ① THE WAVE COUNT ━━━
A ZigZag builds the alternating pivot sequence, and the engine reads the most recent structure the rules allow:
· ①②③④⑤ — the five wave impulse: three impulses with the trend, two corrections against it
· ⒶⒷⒸ — the correction that follows: an impulse down, a correction up, an impulse down
Impulse legs are drawn SOLID, corrective legs DASHED. That is not decoration — it is the definition the whole model rests on: impulsive waves are larger and move with the trend, corrective waves are smaller and move against it. The wave that has not happened yet is projected as a dotted gold line straight to its first fibonacci target.
Finished counts are frozen in faded gold exactly where they were found, so you can scroll back through the chart and study how the reading developed instead of only seeing today's answer.
━━━ ② THE THREE GOLDEN RULES — a hard validity gate ━━━
❶ Wave 3 must be the longest impulse wave, and it can never be the shortest
❷ Wave 2 must not surpass the start of wave 1
❸ Wave 4 cannot overlap with wave 1's price territory
Each rule gets a live ✓ / ✗ in the panel. If one of them breaks the count is not "weaker" — it is invalid, and the indicator behaves accordingly: the setup is cancelled, a COUNT INVALID tag goes on the chart with the reason, an alert fires, and the next confirmed pivot starts a fresh count. Rule 1 has a strict and a relaxed reading, switchable in the settings.
━━━ ③ THE THREE GUIDELINES — a soft quality score ━━━
❶ When wave 3 extends as the longest impulse wave, wave 5 typically approximates the length of wave 1
❷ Wave 2 and wave 4 alternate between a flat and a sharp correction — the indicator classifies each correction by depth and duration and shows you the pair, e.g. S / F
❸ After a five wave impulse advance, ABC corrections commonly end near the prior extreme of wave 4 — that level is projected as the C target
Guidelines are informational by default, because that is what they are. You can require one, two or all three before a signal is allowed to fire.
━━━ ④ THE FOUR FIBONACCI TOOLS, WITH THEIR CORRECT ANCHORS ━━━
Wave 2 retracement — 0 % at the end of wave 1, 100 % at its start
· typical 50.0 % and 61.8 %, plus the 60 % average line
Wave 3 extension of wave 1 — projected from the wave 2 extreme
· typical 161.8 % and 261.8 %
Wave 4 retracement — 0 % at the end of wave 3, 100 % at its start
· typical 23.6 %, 38.2 % and 50.0 %, plus the 30–40 % average band
Wave 5 — two separate targets
· 100 % of wave 1 projected from the wave 4 extreme
· 161.8 % of wave 4, anchored 0 % at the wave 4 extreme and 100 % at the wave 3 extreme
The level the market actually turned at is highlighted in gold, and the panel prints the measured value next to the expected one, so you can see at a glance whether this count is textbook or stretched.
━━━ ⑤ +FVG — the confluence that makes it a trade ━━━
A fibonacci zone on its own is a level. A fair value gap sitting inside that zone is a reason. The indicator scans for unfilled three-candle gaps inside the wave 2 and the wave 4 retracement zone, draws them as a +FVG box, and marks the signal accordingly. You can leave it as a quality tag or make it mandatory.
━━━ ⑥ THE TRADES — always in the direction of the impulse ━━━
Trading in the direction of the impulse waves is what pays, so that is all this indicator signals:
WAVE 3 ENTRY — buy the wave 2 correction in an uptrend, sell it in a downtrend
· stop behind the wave 2 pivot, or at the rule 2 invalidation
· TP1 161.8 % of wave 1, TP2 261.8 % of wave 1
WAVE 5 ENTRY — buy the wave 4 correction, sell it in a downtrend
· stop behind the wave 4 pivot, or at the rule 3 invalidation
· TP1 wave 5 = wave 1, TP2 161.8 % of wave 4
Three trigger models per trade: momentum close out of the zone, zone tap for limit-style entries, or a break of the last minor swing for the latest and safest fill. Minimum reward/risk filter, ATR stop buffer, break even at a chosen R. The counter-trend ABC entry exists but is OFF by default, on purpose.
━━━ WHY EVERY SIGNAL EXPLAINS ITSELF ━━━
Hover any signal pill and you get the full reasoning: the exact count with its prices, which golden rules hold, how deep the correction actually went against the typical values, which guidelines are satisfied, whether a fair value gap was inside the zone, plus entry, stop, both targets, risk in pips, reward in pips and the R multiple.
Every wave label carries its own tooltip — what that wave is, how far it travelled, which rule it has to respect and whether it does. Every fibonacci line explains its anchoring. Setups that were found and then rejected get a NO TRADE tag with the reason, so you learn the filter instead of wondering why nothing fired. There is a HOW TO READ THIS card and an honest BEFORE YOU TRADE THIS card on the chart.
━━━ COCKPIT PANEL ━━━
Live count stage, symbol, chart timeframe, ZigZag settings and the size of wave 1 · the three golden rules with ✓ / ✗ / pending · the three guidelines with the flat-sharp alternation pair · every wave measured against its expected fibonacci value · a five step setup checklist that fills in as the trade builds · the open position with stop and target · a large status line · a rough win / loss / break-even tracker and the last signal timestamp.
━━━ ALERTS AND AUTOMATION ━━━
Every event fires a clean JSON payload ready for a webhook: entry, stop, both targets, the direction of the count, the measured wave 2 retracement, the wave 3 extension, the wave 4 retracement, which rules held, whether an FVG was present, the R multiple, symbol, exchange, timeframe, volume and an optional account field. Events: ENTRY, TP1, SL, BE, INVALID, IMPULSE_COMPLETE. Six plain-language alertconditions are included as well for anybody who just wants a notification.
━━━ SETTINGS WORTH KNOWING ━━━
· ZigZag pivot strength and a minimum swing size in ATR — this pair decides the degree of the count and therefore everything else
· Every fibonacci percentage is editable
· Rule 1 strict or relaxed, rules 2 and 3 on or off, kill-on-invalidation on or off
· FVG optional or mandatory, minimum gap size in ATR
· Full TL chart theme: navy background, mint / red candles, corrective legs dimmed — or switch it off and keep your own
· Panel, animated 3D logo and the right-hand extension of the lines are all configurable
Tip: if the candles cover the panel, right click the indicator → Visual order → Bring to front. That is a TradingView layer setting, not something Pine can control.
━━━ HONEST NOTES ━━━
Elliott Wave is not a standalone technique, and its subjective nature has put a lot of traders off it. Two competent analysts label the same chart differently. This indicator picks ONE reading — the most recent one the three golden rules allow — and tells you the moment that reading dies. It does not pretend the ambiguity is gone.
The count re-reads itself on every new pivot. A label that moves is not a bug; it is the engine refusing to defend a count the market has stopped supporting.
The ZigZag pivot strength decides everything. Too small and you count noise, too large and you only see the count after the move is over. Change it and watch the whole picture change — that is the honest lesson of Elliott Wave, and no indicator can take it away from you.
The percentages are averages, not laws. Corrections come in slightly smaller and slightly larger than the textbook numbers all the time.
The win / loss counter in the panel is a rough on-chart tracker. It assumes a fill at the marked price and resolves target before stop inside the same bar. It is not a backtest and it is not a performance claim.
This indicator is a study tool. It is not financial advice.
━━━ CREDIT ━━━
The rule set is classic Elliott Wave Theory as it is taught publicly. The wave engine, the rule and guideline checks, the fibonacci anchoring, the FVG confluence, the panel and the design are original work.
Open source — read it, change it, learn from it.
Индикатор

Wave Structure PRO v2 [Viprasol]Wave Structure PRO v2 is an automated Elliott Wave structure engine. It builds a ZigZag from confirmed pivots, searches for a valid 1-2-3-4-5 impulse and the following A-B-C correction, validates every candidate against Elliott's three hard rules, and scores how closely each wave matches its ideal Fibonacci proportion. On top of the count it draws the Elliott base channel, Wave 3 / Wave 5 Fibonacci targets, the next-wave retrace zone, and the exact price level where the count becomes invalid.
This is a structure assistant, not a prediction oracle. Elliott counting is inherently ambiguous, and this engine recounts as new pivots confirm. Everything it shows is derived from confirmed swing points, and it tells you honestly when no valid count exists.
HOW IT WORKS
ZigZag Pivot Engine:
Swing highs and lows are detected with a symmetric pivot window (default 8 bars left and right). A pivot only enters the structure after it is confirmed, and consecutive same-direction extremes are merged so the ZigZag always alternates high-low-high-low. The engine keeps the most recent 32 pivots as its working structure.
Sliding-Window Count Search:
The engine scans across the entire pivot structure for the most recent valid count — it does not require the pattern to end exactly at the newest pivot. A completed impulse whose correction is still developing stays on the chart and is marked "prior" in the panel, so a single awkward swing at the right edge does not wipe the analysis. At each candidate position a full 9-pivot impulse + A-B-C structure is preferred over a 6-pivot impulse alone.
Hard-Rule Validation:
Every candidate impulse must pass Elliott's three non-negotiable rules before it is accepted:
1. Wave 2 never retraces more than 100% of Wave 1
2. Wave 3 is never the shortest among Waves 1, 3, and 5
3. Wave 4 never enters the price territory of Wave 1
The A-B-C correction is additionally validated for direction and structure (B stays below the impulse extreme, C extends beyond A).
Fibonacci Quality Score:
Each wave is measured against its textbook ideal — Wave 2 near 0.5-0.618 of Wave 1, Wave 3 extending 1.618+ of Wave 1, Wave 4 near 0.382 of Wave 3, Wave 5 near equality with Wave 1. The four fits combine into a 0-100 "textbook fit" score. Extended fifth waves are scored against the alternative ideal of 0.618 x (Wave 1 + Wave 3), so a legitimately extended fifth is recognized instead of being punished, and the panel flags it as "extended 5th".
Invalidation Level:
For every accepted count the engine draws the price at which the structure stops being valid — a correction that retraces 100% of the impulse start invalidates the count. The exact level is shown on the chart, in the panel, and in the data window, giving you an objective line in the sand instead of a subjective opinion.
Alternation Check:
Waves 2 and 4 are compared as retracements of Wave 1 — when their depths differ meaningfully the panel confirms the alternation guideline is present, and shows an explicit "absent" flag when it is not.
KEY FEATURES
- Automatic 1-5 impulse and A-B-C correction detection with wave labels on the chart
- Sliding-window search — finds the most recent valid count anywhere in the structure, marked "prior" when its final pivot is not the newest swing
- Elliott's 3 hard rules enforced on every count — invalid structures are never labeled
- 0-100 Fibonacci quality score with per-wave ratio annotations at each pivot
- Extended fifth wave recognition with alternative 0.618 x (W1+W3) scoring path
- On-chart invalidation level with price label
- Elliott base channel (2-4 trendline with parallel through Wave 3)
- Wave 3 and Wave 5 Fibonacci extension targets with configurable multiples
- Next-wave retrace target zone (0.382-0.618 of the full impulse)
- Analysis panel: count state, quality, all four wave ratios, alternation, rule status, invalidation price
- Data-window outputs (quality, direction, stage, invalidation) usable by strategies and screeners via input.source
- Transition-based alerts that fire on state changes, not on every pivot refresh
HOW TO USE
Setup:
1. Add to any chart — works on all markets and timeframes
2. Use a standard candlestick chart (not Heikin Ashi)
3. Tune "Swing Sensitivity" to the wave degree you trade: higher values = larger-degree waves, lower values = smaller subdivisions
4. Defaults (sensitivity 8) suit 1H-4H charts on liquid instruments
Reading the Chart:
- Numbered labels 1-5 mark the impulse pivots; A-B-C labels mark the correction (orange)
- Small ratio numbers at pivots 2, 3, 4, 5 show each wave's Fibonacci proportion
- Dotted / dashed blue lines = Wave 3 and Wave 5 extension targets
- Cyan channel = Elliott base channel projected forward
- Purple box = expected retrace zone for the next corrective wave
- Red line = invalidation level; if price crosses it, the count is wrong
- Panel header: up/down arrow shows count direction; "prior" means the count completed before the newest swing
Reading the Panel:
- Quality 70+ = clean textbook structure; below 50 = forced fit, treat with caution
- "NO COUNT" genuinely means no valid structure exists right now — the engine never shows leftover metrics from a dead count
- The Invalidation row gives the exact price that voids the current count
SETTINGS
ZigZag: Swing sensitivity (pivot bars left/right), ZigZag visibility and color.
Waves: Wave label toggles for 1-5 and A-B-C, bullish/bearish/corrective colors, label size.
Fibonacci & Quality: Ratio annotations toggle, target visibility, Wave 3 and Wave 5 extension multiples, target color.
Channel & Target Zone: Base channel toggle and color, retrace zone toggle and color.
Invalidation: Level visibility and color.
Analysis Panel: Show/hide, position.
Alerts: Quality threshold for the high-quality alert, dynamic alert() messages toggle.
ALERTS
1. Count found — a new valid wave count appeared (fires once per count, not on every pivot extension)
2. Count invalidated — the active count stopped being valid
3. 1-5 + A-B-C complete — the correction finished, full cycle in place
4. High-quality count — a new count scored above your quality threshold
With "Dynamic alert() Messages" enabled, alert() notifications include the symbol, timeframe, direction, quality score, and invalidation price. Create the alert with condition "Any alert() function call".
LIMITATIONS & DISCLAIMER
- Elliott Wave counting is subjective by nature; this engine applies one rigorous, rule-based interpretation and recounts as new pivots confirm
- Pivots confirm with a delay equal to the swing sensitivity — labels appear after the swing completes, never in real time at the extreme
- The count can change when a developing swing extends; the transition alerts are designed around this, firing on genuine state changes only
- Wave degree is determined by your sensitivity setting; the engine does not track multiple degrees simultaneously
- Quality scoring measures Fibonacci proportion fit, not probability of continuation
- This indicator is for educational and analytical purposes only — it is not financial advice. Always use proper risk management.
ORIGINALITY
All code is original Viprasol work. Elliott Wave theory itself is public knowledge (R.N. Elliott); no third-party script was reused. v2 supersedes Wave Structure PRO with a stale-state fix, sliding-window count search, invalidation levels, extended-fifth scoring, data-window outputs, and transition-based alerts. Индикатор

Wave Sniper# Wave Sniper — Elliott Wave Flat & Confluence Detector
**by SRUS**
Wave Sniper is an advanced Elliott Wave overlay that automatically detects **flat corrections**, **3-wave pullbacks**, and **multi-timeframe wave structure** — then scores each setup for quality and confluence before marking it on your chart.
Built for traders who want clean wave-based entries without manually counting every pivot across timeframes.
---
## What It Detects
### Flat Corrections (A–B–C)
- **Regular Flat** — B retraces ~90–100% of A, C completes near A
- **Expanded Flat** — B exceeds A (up to 138.2%), C extends 123.6–161.8% of A
- **Running Flat** — B exceeds A, C fails to reach A (truncated C)
Each flat is validated with Fibonacci ratios, optional B-wave close validation, RSI momentum divergence, and volume confirmation at the C pivot.
### 3-Wave Pullbacks
- **Continuation** — three-wave pullback in the direction of the prevailing trend
- **Reversal** — three-wave structure signaling a potential turn
### 5-Wave Retest
After a flat completes, Wave Sniper tracks whether price forms a valid 5-wave extension and flags **retest opportunities** at the prior correction zone.
### Multi-Timeframe Wave Engine (15m · 1H · 4H · Daily)
Independent pivot engines run on four higher timeframes, each maintaining its own wave count state:
`WAVE_1` through `WAVE_5`, `WAVE_A/B/C`, impulse complete, correction complete.
---
## Signal System
### Triangle Markers
Confirmed setups print a **small triangle** at the C pivot:
- ▲ Green/Purple = Long bias
- ▼ Red = Short bias
Triangle color and line weight reflect the **confluence tier** — not just pattern type.
### Confluence Tiers (HTF Bonus)
| Tier | HTF Bonus | Visual |
|------|-----------|--------|
| CASCADE | 100+ | Boldest lines + chart flash |
| TRIPLE | 70–99 | Strong color, width 3 |
| WAVE | 40–69 | Medium color, width 2 |
| Single | Below 40 | Gray tint, width 1 |
**Base pattern score (0–100)** rates Fib accuracy, momentum, volume, and B-wave validation.
**HTF bonus (0–130)** adds points when chart and higher timeframes align on wave direction, impulse structure, RSI divergence, and volume behavior.
Full scoring breakdown is shown in the **info panel** (top right).
---
## Key Features
**Wave 4 Watch System**
- Detects when price enters the 23.6–38.2% Fib retrace zone of HTF Wave 3
- Confirms with RSI behavior, volume contraction, and a completing 3-wave structure
- Draws W4 MIN / W4 MAX levels and `W4 WATCH` / `W4 ✅ LOAD W5` labels
**HTF Fib Zones**
- Auto-draws Wave 4 expected retrace boxes per active timeframe
- Projects W5 targets: MIN, STANDARD, 161.8%, 261.8%
**⚡ Prime Zone**
When an HTF Wave 4 Fib zone overlaps a confirmed flat correction zone on your chart timeframe, a bright **PRIME ZONE** box highlights the overlap — highest-probability confluence area.
**Auto-Invalidation**
Patterns that break structure fade to gray and are removed from active tracking.
**Adaptive Pivots**
Pivot strength auto-adjusts to ATR and timeframe so detection stays consistent across instruments and chart periods.
**Focus Mode**
Toggle to show flats only and reduce chart clutter.
**Lookback Filter**
Auto / 1 Day / 1 Week / 1 Month / All — control how far back patterns are drawn.
---
## Info Panel
Live readout includes:
- Daily · 4H · 1H · 15m wave states
- HTF Bias (Long/Short)
- Prime Zone status
- Current chart wave state
---
## Alerts
Built-in alert conditions:
- ⚡ Wave 4 Approaching
- ✅ Wave 4 Confirmed — W5 Loading
- 🔥 Cascade Signal — All TFs Aligned
- ⚡ Prime Zone Active
- 🔁 Wave Count Invalidated (per TF)
- 🎯 Wave 5 Target Hit (MIN / 161.8%)
- Flat detected (Regular / Expanded / Running)
- 3-Wave Continuation / Reversal
- 5-Wave retest confirmed
- B-wave confirmed — watching for C
---
## Recommended Settings
| Use Case | Suggestion |
|----------|------------|
| Scalping (1m–5m) | Enable 15m + 1H layers, Min Score 65, Min HTF Bonus 40 |
| Swing (15m–1H) | All HTF layers on, Min Score 60, Min HTF Bonus 30 |
| Position (4H–D) | Daily + 4H layers, Wave Degree = Intermediate |
| Clean chart | Focus Mode ON, Max Visible = 3 |
---
## How to Read a Setup
1. **Triangle appears** at C pivot → flat or pullback confirmed
2. Check **info panel** for HTF alignment and tier
3. Watch for **W4 zone** or **Prime Zone** for entry refinement
4. Use **W5 projection lines** for targets
5. Set alerts for CASCADE or Prime Zone for hands-free monitoring
---
## Disclaimer
Wave Sniper is a **technical analysis tool**, not financial advice. Elliott Wave counting is interpretive — always confirm with your own analysis, risk management, and market context. Past pattern performance does not guarantee Индикатор

Campaign Map - Contreras Law Version en espanol mas abajo. · English version first, Spanish below.
─────────────────────────────────
CAMPAIGN MAP — CONTRERAS' LAW
WHAT IT MEASURES
This indicator builds the historical distribution of a symbol's
campaign corrections (peak→trough declines confirmed by reversal) and
places the CURRENT correction inside that map: is it normal breathing,
a deep pullback, or statistically unusual territory?
THE OBSERVATION BEHIND IT
Contreras' Law (Jacinto Contreras, June 2026): in US large-cap
technology stocks, the typical depth of campaign corrections converges
to a structural constant (~14-15% median at campaign scale),
regardless of the symbol. What differentiates each stock is not its
median but its historical maximum tail (observed: from ~25% to ~53%
depending on the symbol, across ~11 years of hourly data on 9 names).
Operational takeaway: MONITOR WITH THE MEDIAN, SIZE WITH THE TAIL.
HOW IT WORKS
· A reversal-threshold zigzag detects campaign peaks and troughs.
· Only COMPLETED corrections (confirmed by reversal) enter the
statistics: median, 75th percentile, and historical maximum.
· The main line plots the depth of the ongoing correction, colored by
zone: normal (teal), deep (orange), unusual (red).
· Summary table with the symbol's map and current status.
· Two alerts: median cross and P75 cross.
HOW TO USE IT
· Below the median: normal breathing; the pullback alone carries no
trend-change information.
· Between median and P75: deep but normal correction.
· Above P75: statistically unusual territory. The correct reading is
NOT "it must bounce now" — it is: look for exhaustion evidence
(divergences, capitulation) and demand confirmation.
· The historical maximum (the tail) is the worst-case reference for
position sizing and campaign stops.
INPUTS
· Reversal (%): rally confirming the end of a bearish campaign.
8% = campaign scale (default). 3% = swing scale.
· Minimum depth (%): smaller corrections are excluded from the map.
10% campaign / 5% swing.
LIMITATIONS (read before use)
· Statistics do NOT repaint (completed corrections only), but the
ONGOING correction is provisional by nature: its campaign peak may
extend until the reversal confirms.
· The median convergence was observed in US large-cap tech on the
hourly timeframe; it may not hold in other sectors, assets or
timeframes. Verify it on your symbol before relying on it.
· Enough campaigns (>8-10) are required for the map to be
statistically meaningful; the indicator shows "calibrating…" until
then.
· This is a MEASUREMENT and context tool. It does not generate buy or
sell signals and guarantees no outcome. Not financial advice.
─────────────────────────────────
VERSIÓN EN ESPAÑOL
MAPA DE CAMPAÑAS — LEY DE CONTRERAS
QUÉ MIDE
Este indicador construye la distribución histórica de las correcciones
de campaña de un valor (caídas máximo→mínimo confirmadas por reversión)
y sitúa la corrección actual dentro de ese mapa: ¿es una respiración
normal, una corrección profunda o territorio inusual?
LA OBSERVACIÓN QUE LO ORIGINA
Ley de Contreras (Jacinto Contreras, junio de 2026): en valores
tecnológicos estadounidenses de alta capitalización, la profundidad
típica de las correcciones de campaña converge en una constante
estructural (~14-15% de mediana, escala campaña), independiente del
símbolo. Lo que diferencia a cada valor no es su mediana, sino su cola
máxima histórica (observado: desde ~25% hasta ~53% según el símbolo,
sobre ~11 años de datos horarios en 9 valores).
Moraleja operativa: VIGILAR CON LA MEDIANA, DIMENSIONAR CON LA COLA.
CÓMO FUNCIONA
· Un zigzag por umbral de reversión detecta picos y valles de campaña.
· Solo las correcciones COMPLETADAS (confirmadas por reversión) entran
en la estadística: mediana, percentil 75 y máximo histórico.
· La línea principal muestra la profundidad de la corrección en curso,
coloreada según la zona: normal (verde), profunda (naranja),
inusual (rojo).
· Tabla resumen con el mapa del símbolo y el estado actual.
· Dos alertas: cruce de la mediana y cruce del P75.
CÓMO USARLO
· Por debajo de la mediana: respiración normal; el retroceso no es,
por sí solo, información de cambio de tendencia.
· Entre mediana y P75: corrección profunda pero dentro de lo normal.
· Por encima del P75: territorio estadísticamente inusual. La lectura
correcta no es "ya tiene que rebotar", sino: buscar señales de
agotamiento (divergencias, capitulación) y exigir confirmación.
· El máximo histórico (la cola) es la referencia de peor caso para
dimensionar posición y stops de campaña.
PARÁMETROS
· Reversión (%): rally que confirma el fin de una campaña bajista.
8% = escala campaña (por defecto). 3% = escala swing.
· Profundidad mínima (%): correcciones menores no entran al mapa.
10% campaña / 5% swing.
LIMITACIONES (léelas antes de usar)
· Las estadísticas NO repintan (solo correcciones completadas), pero
la corrección EN CURSO es provisional por naturaleza: su máximo de
campaña puede extenderse hasta que la reversión confirme.
· La convergencia de medianas está observada en tecnológicas USA de
alta capitalización en marco horario; en otros sectores, activos o
marcos puede no cumplirse. Compruébalo en tu símbolo antes de usarlo.
· Se necesitan suficientes campañas (>8-10) para que el mapa tenga
valor estadístico; el indicador muestra "calibrando…" mientras tanto.
· Es una herramienta de MEDICIÓN y contexto. No genera señales de
compra/venta ni garantiza resultado alguno. No es asesoramiento
financiero. Индикатор

Self-Validating Elliott Wave EngineSELF-VALIDATING ELLIOTT WAVE ENGINE
A probabilistic Elliott Wave framework that does three things most wave tools do not: it weighs SEVERAL competing counts at once instead of asserting one, it CALIBRATES its own confidence against what actually happened on the instrument you are viewing, and it tells you honestly when no count is trustworthy. It is decision-support and context - not a signal generator, and never a claim of certainty.
WHY THESE PARTS BELONG TOGETHER (one engine, not a bundle)
Elliott Wave analysis is unavoidably ambiguous: the same swings can support an impulse, a zigzag, a flat or a triangle, and practitioners disagree constantly. A tool that draws one count and hides that ambiguity is misleading. This script is built as a single pipeline whose stages exist specifically to manage that ambiguity, and removing any one stage breaks it:
1. Structure - an alternating swing (ZigZag) series is built from confirmed pivots, and each pivot is tagged with momentum (RSI) and relative volume. This is the raw evidence every wave rule is tested against; without a clean swing series there is nothing to count.
2. Multi-count pattern engine - from that swing series the script forms several competing labelled hypotheses at once (impulse forming wave 3/4/5 or complete, zigzag, flat, contracting triangle). Because Elliott is ambiguous, evaluating alternatives is the whole point, not an add-on.
3. Scoring - each hypothesis is graded on Fibonacci fit, proportion and the alternation guideline (waves 2 and 4 should differ in form), and "wave energy" (does wave 3 thrust hardest, in trend direction, on rising volume?). These are combined deliberately: Fibonacci ratios alone mislabel corrections as impulses; momentum alone is directionless noise; only together do they discriminate real structure.
4. Regime context - a trend/range/compression read (from ADX and ATR) tilts the priors, because impulses are more likely in trends and corrections in ranges. It changes the odds, it does not override the structure.
5. Market-structure confirmation - an independent break-of-structure / change-of-character check raises or lowers the chosen count, so the wave read must agree with raw price action to score well.
6. Calibrated forecast - the forward zone is built from THIS chart's own distribution of historical retracement depths, not fixed ratios pulled from a textbook, so it reflects how the specific instrument actually behaves.
7. Outcome calibration - every forward call (target + invalidation + confidence) is logged and later checked: did price reach target before invalidation? Outcomes are bucketed by confidence, so the confidence number on screen can be mapped to a MEASURED hit-rate. This is the stage that makes the tool self-validating, and it is impossible without all the stages above feeding it.
So the components are not stacked for convenience - they form one loop: build competing hypotheses, score them on structure and momentum, tilt by regime, confirm against price structure, forecast from the instrument's own history, then grade that forecast against reality and report the measured reliability. That is why this is one indicator rather than seven separate overlays.
HOW IT WORKS ON THE CHART
- Wave labels and connecting lines draw the primary (highest-scoring) count's structure.
- A dashed projection line and a shaded forecast zone mark where the primary count expects price to go, with the zone width calibrated from the chart's own retrace history.
- A dashboard reports: the primary count with its probability share, its position and stage, the two best alternative counts, the raw confidence, the measured calibrated hit-rate once enough cases have resolved, the regime, the market-structure state (and whether it confirms or warns), the hard-rule pass/fail, wave energy, an opportunity read (confidence shaped by reward-to-risk and structure), and the target / invalidation levels.
HOW TO USE IT
- Read the ambiguity, not a single answer. The secondary and tertiary counts and their probabilities tell you how clear or murky the structure currently is.
- Trust "Calibrated" over "Confidence". Confidence is the raw structural score; the calibrated figure is the measured success rate for that confidence level on resolved cases - the honest number.
- Respect "stand aside". When confidence is below your threshold the panel says so instead of forcing a count. That is a feature.
- Use target and invalidation as context for your own plan. Invalidation is the level that would break the primary count; the forecast zone is where it expects to resolve. The script places no orders.
- Combine with your own method. The market-structure and regime rows are there so the wave read can be cross-checked against plain price action.
SETTINGS OVERVIEW
- Structure: swing sensitivity (pivot legs), max swings stored, and pivot source - wicks (high/low) or bodies (close), so it suits how you read a given market.
- Scoring weights: Fibonacci fit, proportion/look, wave-3 momentum.
- Context: ADX length and trend threshold.
- Forecast: inner/outer percentiles of the retrace distribution, minimum swings to calibrate, minimum resolved cases before the calibrated hit-rate is trusted.
- Display: minimum confidence for a "clean" count, label/zone/panel toggles, bull/bear colours.
- Alerts: new wave, count flip, invalidation breach, forecast-zone entry (via "Any alert() function call").
Pivot source is selectable and volume is used only when a symbol reports it, so the engine runs on futures, equities, forex, crypto and indices on any timeframe.
ORIGINALITY
Most Elliott tools draw a single count and stop. This one runs a bounded multi-count search, scores each hypothesis on structure plus momentum plus volume, tilts by regime and confirms against market structure, forecasts from the instrument's own retrace distribution, and - uniquely - measures its own realised hit-rate per confidence level so the number on screen is grounded in outcomes rather than asserted. It quantifies and reports its own reliability.
REPAINT NOTICE AND LIMITATIONS (honest)
- Swing detection uses confirmed pivots, which finalise a fixed number of bars after they form. The most recent leg is therefore always provisional and can change. This is inherent to Elliott structure detection and is disclosed deliberately, not hidden.
- Counts are probabilistic hypotheses, not predictions. Two analysts - and this engine on two settings - can read the same chart differently.
- Calibration is a long-run estimate over resolved cases on this chart; early on, and after a regime change, it needs samples before it means anything, and past hit-rate is not a future guarantee.
- This is context and decision-support. It is not a trading system and issues no orders.
DISCLAIMER
This script is for research and education only. It is not financial advice, not a recommendation, and not a solicitation to trade. It places no orders and guarantees no outcome. Markets carry risk; test any tool on your own data and timeframe and make your own decisions.
Индикатор

ShareScope Weiss Wave approximation v1ShareScope Weis Wave Approximation v1
Overview
This indicator is an attempt to reproduce the behaviour of the Weis Wave implementation available in ShareScope using TradingView Pine Script.
The objective is not to recreate every interpretation of David H. Weis's work, but rather to approximate the wave-construction and cumulative volume behaviour observed in ShareScope's Volume Weis Wave indicator.
Methodology
The indicator organises market volume into directional price waves using a percentage-based ZigZag reversal threshold.
A wave remains active while price continues moving in the current direction. When price reverses by the specified percentage amount, the current wave is completed and a new wave begins. Volume is accumulated throughout the life of each wave and displayed as a cumulative histogram.
Available options include:
• ZigZag Value (%) – percentage reversal required to start a new wave.
• Use High/Low – uses candle extremes rather than closing prices when determining wave reversals.
• Symmetric Calculation – applies proportional reversal mathematics so that up and down reversals are geometrically symmetrical.
The calculation updates dynamically as new price data arrives and completed waves become fixed only after the reversal threshold has been reached.
What This Indicator Is Not
Please note - This is not an ATR-based Weis Wave model.
Some modern Weis Wave implementations use Average True Range (ATR), volatility measurements, adaptive thresholds or other dynamic methods to determine wave reversals. This indicator does not use ATR, volatility bands, adaptive filters, moving averages or volume-based reversal logic.
Wave changes are driven solely by the selected percentage reversal threshold, consistent with the behaviour described for ShareScope's Weis Wave implementation.
Notes
David H. Weis never published a single definitive formula for constructing Weis Waves and various software platforms implement the concept differently. As a result, indicators carrying the "Weis Wave" name may produce substantially different results depending on the wave-construction methodology used.
This script focuses specifically on approximating ShareScope's percentage-based wave model rather than ATR-based, volatility-based or proprietary alternatives.
For research and comparison purposes, several exportable data series are included:
• Wave Direction
• New Wave Trigger
• Active Wave Volume
• ZigZag Value
• Current Swing Extreme
These outputs can be accessed through TradingView's Data Window and CSV export facilities.
Индикатор

Elliott Structure Pro RC [Gabremoku]Elliott Structure Pro RC is a market structure and wave-mapping overlay designed to detect candidate Elliott impulse patterns using pivot logic, ZigZag structure, validation rules, invalidation levels, and projected Fibonacci targets.
This script does not claim to produce definitive Elliott Wave counts. Instead, it scans recent pivot structure and highlights the most coherent bullish or bearish candidate sequence based on alternating swing logic, structural progression, and optional Elliott validation filters. That framing is important because Elliott Wave interpretation is inherently subjective, while the classic impulse model still relies on a few widely accepted structural rules.
What it shows
🔺 ZigZag market structure — the script builds a cleaned pivot path from swing highs and lows, filtering out smaller fluctuations to make structure easier to read. ZigZag-style logic is commonly used to reduce chart noise and highlight meaningful turning points.
🏷️ HH / HL / LH / LL tags — every pivot can be classified into higher high, higher low, lower high, or lower low structure, helping the user read trend progression directly from price swings.
🌊 Candidate Elliott 1–5 sequence — the script scans recent pivots and searches for the best bullish or bearish 5-wave impulse candidate.
❌ Invalidation tracking — once a candidate is found, the script projects an invalidation level and can flag when the structure has been broken.
🔤 Optional ABC correction — after a 5-wave sequence, the indicator can also look for a basic A-B-C corrective continuation.
📏 Fibonacci projections — projected target levels for Wave 3 and Wave 5 are plotted using configurable Fibonacci multipliers. Fibonacci extensions are commonly used in Elliott analysis to estimate probable Wave 3 and Wave 5 zones.
🪧 Dashboard — shows state, mode, pivot count, direction, validation strictness, ABC status, broken structure state, and target visibility.
Core logic
The script begins with pivot highs and pivot lows, then compresses them into a cleaner alternating sequence. From there, it builds a structural map and scans the most recent pivots to find a valid 6-point sequence that can represent a 5-wave bullish or bearish impulse candidate.
In practical terms, it combines:
market structure
ZigZag logic
Elliott candidate matching
rule-based validation
invalidation and target projection
That makes it useful as a structure-reading tool first, and an Elliott helper second.
Validation model
The script offers two operating styles:
Semplificato
Avanzato
In simplified mode, the indicator focuses more on structural coherence and swing progression. In advanced mode, it can apply stricter Elliott-style validation rules such as:
Wave 3 not shortest
Wave 4 no overlap with Wave 1 territory
invalid candidate marking when rules are not respected
Those rules align with widely cited core Elliott impulse rules. In standard impulse structures, Wave 3 may not be the shortest of Waves 1, 3, and 5, and Wave 4 should not overlap Wave 1 territory except in special formations such as certain diagonals.
Fibonacci targets
The indicator also projects two practical target references:
Wave 3 target
Wave 5 target
In Elliott analysis, Wave 3 is often projected using Fibonacci expansion of Wave 1, with 1.618 being one of the most common reference ratios, while Wave 5 is often estimated from prior impulse relationships or partial trend expansion logic.
Your script uses configurable multipliers, which is a good choice because different markets and timeframes can produce different expansion behaviors.
How to use
A practical workflow is:
Let the script identify the active pivot structure.
Check whether the chart is printing HH/HL or LH/LL logic.
Watch for a highlighted bullish or bearish 1–5 candidate.
Use the invalidation level to judge whether the count remains structurally valid.
Use projected Fib targets as reference zones, not guaranteed endpoints.
If enabled, monitor whether a simple ABC correction starts forming after the impulse.
This is best used as a decision-support overlay, especially for traders who already read market structure and want an automated way to visualize possible wave candidates.
Features
✅ Pivot-based market structure engine
✅ ZigZag overlay with configurable sensitivity
✅ HH / HL / LH / LL classification
✅ Candidate bullish and bearish Elliott impulse detection
✅ Simplified or advanced scan mode
✅ Optional strict Elliott validation
✅ Wave 3 not shortest filter
✅ Wave 4 overlap validation
✅ Broken-structure detection
✅ Invalidation level plotting
✅ Optional ABC correction detection
✅ Fibonacci Wave 3 / Wave 5 projections
✅ Dashboard and optional bar coloring
✅ Gradient-based swing visualization
Notes
This indicator is designed to identify candidate Elliott structures, not to replace discretionary wave analysis. Elliott interpretation is partly rule-based and partly interpretative, so projected counts and targets should always be confirmed with broader market context, price action, and risk management.
Author: Gabremoku
Pine Script v6 Индикатор
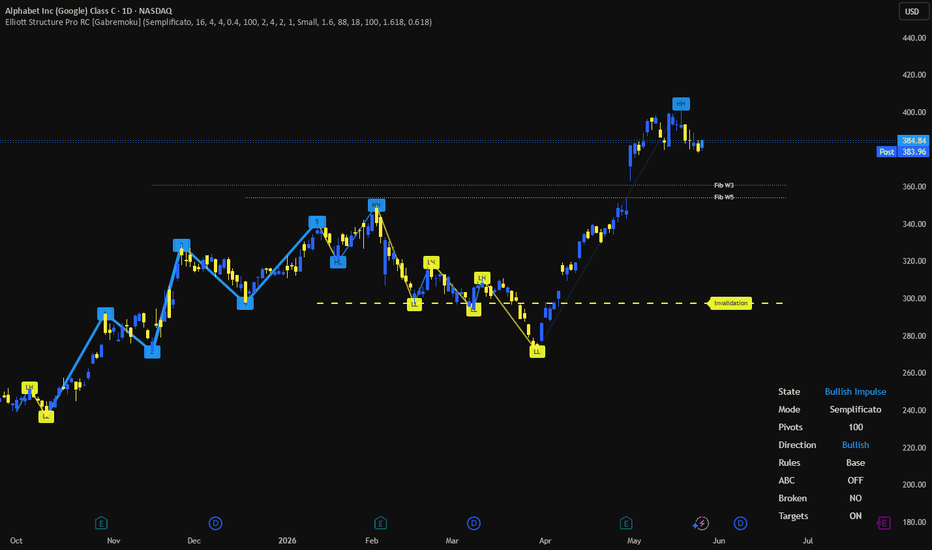
Fibonacci Retracement Statistics by VolProfexFIBONACCI RETRACEMENT STATISTICS BY VOLPROFEX
=============================================
DESCRIPTION
-----------
Fibonacci Retracement Statistics is an analysis tool that
automatically detects price swings, tracks retracements within each trend,
and calculates how often price retraces to various Fibonacci levels. The
indicator labels every completed swing with its swing number and deepest
fib level reached (e.g. "▲ #12 78.6%"), and displays a statistics table
showing the count and percentage of swings reaching each level.
All visual elements (trend boxes, fib lines, retracement boxes, labels, and
the statistics table) are drawn only on the last chart bar, keeping the
indicator performant during real-time scrolling. Retracement labels update
in real time so you always see the current value for the active swing.
HOW IT WORKS
------------
1. SWING DETECTION (ATR-Deviation ZigZag)
A volatility-adaptive ZigZag engine finds pivot highs and lows. A pivot
is confirmed when price moves against the current leg by at least
ATR(period) × deviation multiplier. A minimum swing size filter discards
insignificant wiggles. A spike filter rejects reversals triggered by
bars with extreme wick-to-body ratios.
2. HIGHER-TIMEFRAME (HTF) CONTEXT (optional)
When enabled, the indicator loads data from a higher timeframe (default: 1h)
and runs the same ZigZag engine on it. Completed HTF swings are drawn as
translucent boxes on the chart. Local swings are filtered to only count
when their direction matches the HTF swing they fall inside. This removes
counter-trend noise within the larger structure.
A separate gate ("Exclude Retracements outside HTF swing") further filters
retracement contributions: only retracements where both the trend leg and
the counter-trend leg fall inside the same completed HTF box are counted
in statistics and drawn on the chart.
3. TREND & RETRACEMENT TRACKING
Alternating pivot types (high → low → high → ...) create directional
trends. For each unfinalised trend, the indicator tracks the extreme
retracement price bar by bar. When the trend completes, the retracement
percentage is calculated using the actual counter-trend leg. This value is
then compared against each enabled Fibonacci level.
4. FIBONACCI LEVEL COUNTING
A cumulative counting system tallies how many trends have retraced to
each enabled level. Levels available include: 23.6%, 38.2%, 50.0%, 61.8%,
78.6%, 88.6%, 100.0%, 127.2%, 138.2%, 150.0%, 161.8%, plus up to 5
custom levels (0–500%). The statistics table is split into UP and DOWN
sections, each with its own Level / Count / Percent columns.
5. INTRADAY TIME WINDOW (optional)
On intraday charts, you can set a session window (e.g. 09:30–16:00) to
restrict which swings are analysed. Choose between "Pivot Confirmed Inside"
(the confirming bar's timestamp must fall in the window) or "Full Cycle
Inside" (both the pivot start and confirmation must fall in the window).
A visual box overlay can be enabled to highlight the active window.
6. SPIKE FILTER
Optionally discard ZigZag reversals triggered by bars where the upper or
lower wick exceeds the body by a user-defined ratio. This helps avoid
false pivot signals from sudden, low-liquidity spikes.
SETTINGS REFERENCE (defaults optimised for BTCUSDT, 5m chart, 1h HTF)
---------------------------------------------------------------------
── SWING ENGINE ──
- ATR Period: 14
Period for ATR calculations. Shared by local ZigZag and HTF swing detection.
- ZigZag Deviation Multiplier (ATR ×): 3.0
Pivot confirmed when price reverses by ATR × this value.
- Min Swing Size (ATR multiple): 0.8
Legs smaller than ATR × this are discarded. Set 0 to disable.
── HTF CONTEXT ──
- Use Higher Timeframe Swing Context: ON
When enabled, local swings are counted only when their direction matches the
current HTF swing bias.
- HTF Timeframe: 60
Higher timeframe for context. Must be higher than the chart timeframe.
- HTF Swing Deviation (ATR ×): 3.5
ATR multiplier for HTF pivot reversals.
- HTF Min Swing Size (ATR ×): 1.5
Minimum leg size for HTF swings. Set 0 to disable.
- Exclude Retracements outside HTF swing: ON
When enabled, only retracements fully contained within a completed HTF swing
box contribute to statistics and visual output.
- Show HTF Swings: ON
Draws HTF major swing boxes on the chart (Blue = upswing, Red = downswing).
- HTF Bull Color / HTF Bear Color: Blue (50% transp) / Red (50% transp)
── FIBONACCI LEVELS ──
- Levels enabled by default: 23.6%, 38.2%, 50.0%, 61.8%, 78.6%, 100.0%,
138.2%, 161.8%
- 5 custom level slots, each 0.0–500.0%. Set to 0.0 to disable. Default: all 0.0
── FILTERS ──
- Trend Direction: Both
Options: Both / Uptrends Only / Downtrends Only
- Use Intraday Time Window: OFF
When ON, applies a daily clock window on intraday charts.
- Window Session: 0930-1600
- Window Mode: Pivot Confirmed Inside
Options: Pivot Confirmed Inside / Full Cycle Inside
- Window Timezone: Exchange (uses the symbol's exchange timezone)
- Show Time Window Box: OFF
Visual box highlighting the active intraday window.
- Enable Spike Filter: ON
Discard reversals triggered by spike bars.
- Max Wick-to-Body Ratio: 4.0
Threshold for spike detection (wick ≥ this × body).
── DISPLAY ──
- Show Trend Boxes: ON (Border Width: 1)
Bullish: Teal / Bearish: Maroon
- Show Fib Lines: ON (Width: 1, Style: Dashed, Color: Gray at 60% transp)
- Show Fib Labels: ON (Position: Right, Vertical: Center, Size: Small, Color: White)
- Show Retracement Boxes: ON (Color: Orange at 40% transp)
- Show Retracement Labels: ON (Position: Center, Vertical: Below, Size: Small, Color: Yellow)
- Max Trends Drawn: 50 (1–500)
── TABLE ──
- Table Position: Top Right
- Font Size: Small
VISUAL OUTPUT
-------------
1. Trend Boxes: Translucent coloured boxes spanning each completed swing leg.
2. Fib Lines & Labels: Dashed (or solid/dotted) lines at each Fibonacci level
with optional percentage labels on every completed swing.
3. Retracement Boxes: Overlay boxes on the counter-trend leg with a connecting
diagonal line, colour-coded by trend direction.
4. Retracement Labels: Labels on each retracement showing:
- Arrow direction (▲ = uptrend, ▼ = downtrend)
- Filtered swing number
- Deepest Fibonacci level reached
5. HTF Swing Boxes: Larger translucent boxes showing higher-timeframe swing
structure (blue = up, red = down).
6. Statistics Table: A table in one of four corners displaying:
- Level | Count | Percent for uptrends (teal header)
- Level | Count | Percent for downtrends (maroon header) Индикатор

Cody Zig ZagCody Zig Zag Indicator - Complete Explanation
This is a Zig Zag indicator that replicates the MetaTrader 4 (MT4) version, which works differently than TradingView's built-in Zig Zag. Here's what it does:
🎯 What is a Zig Zag Indicator?
It filters out minor price movements to show only significant swing highs and swing lows, helping you identify trends and chart patterns (head & shoulders, double tops/bottoms, etc.).
⚙️ User Settings (Inputs)
Setting Default What It Does
Depth 6 Lookback period to find local highs/lows
Deviation 5 Minimum price change (in ticks) to form a new swing point
Backstep 2 Minimum bars between swing points
Line Thickness 2 Zig Zag line width
Bull Color Lime Color for upward moves
Bear Color Red Color for downward moves
Repaint Levels true If ON, lines/labels adjust real-time; if OFF, they lock on close
🔍 How It Works (The "Bake" Section)
Step 1: Find Potential Pivot Points
p_lw = Most recent low within Depth bars
p_hg = Most recent high within Depth bars
Checks if price moved enough (Deviation * tick size) to qualify
Step 2: Determine Direction
down = Boolean (true = bearish/downward leg, false = bullish/upward leg)
Tracks whether we're connecting a high→low (down) or low→high (up)
Step 3: Draw Zig Zag Lines
Connects alternating swing highs and swing lows
Labels each point as:
HH = Higher High
LH = Lower High
LL = Lower Low
HL = Higher Low
🏷️ Labels Explained
When price makes a new swing point, you'll see:
HH (Higher High) - Bullish continuation signal
LH (Lower High) - Bearish reversal signal
LL (Lower Low) - Bearish continuation signal
HL (Higher Low) - Bullish reversal signal
📊 Visual Features
Colored Zig Zag lines: Green for up-legs, Red for down-legs
Background color: Green during bullish legs, Red during bearish legs (90% transparent)
Labels: Tiny triangles pointing up/down with text
⚠️ Repaint Behavior (Important!)
Repaint = ON (default) Repaint = OFF
Lines/labels update in real-time Locks on bar close
Can "repaint" history More reliable for backtesting
Good for real-time trading No historical repainting
Warning: Zig Zag indicators naturally repaint because they need future bars to confirm pivot points. The repaint option controls HOW they repaint.
🚨 Alerts
This script triggers alerts when:
Direction Changed - Zig Zag switches from up to down or down to up
Bullish Direction - Switches from down to up
Bearish Direction - Switches from up to down
📈 How to Use
Identify Trend: Upward Zig Zag = Uptrend; Downward = Downtrend
Find Patterns: Look for HH/HL patterns (bullish) or LH/LL patterns (bearish)
Divergence: Compare Zig Zag swings with oscillator indicators
Support/Resistance: Swing points act as natural S/R levels
⚡ Quick Summary
This indicator draws a line connecting significant price swings, ignoring small noise. It's great for:
Visualizing trend structure
Identifying chart patterns
Finding entry/exit levels
Spotting trend reversals Индикатор

Cody Zig Zag Cody Zig Zag – MT4-Style Zig Zag for TradingView
The ZigZag indicator that actually works like the classic MT4 version!
🔍 Overview
Cody Zig Zag is a powerful, fully customizable ZigZag indicator that replicates the exact behavior of the popular MetaTrader 4 (MT4) ZigZag. Unlike TradingView's built-in ZigZag, this version behaves identically to what MT4 traders know and love – making it perfect for Elliott Wave traders, support/resistance hunters, and breakout specialists.
⚙️ Input Parameters (Just like MT4!)
Parameter Default Description
Depth 12 Minimum number of bars between swing points
Deviation 5 Minimum price movement (in ticks) to form a new swing
Backstep 2 Minimum bars between swing points of the same type
Line Thickness 2 Visual weight of the ZigZag line
Bull Color Lime Color for upward swings
Bear Color Red Color for downward swings
Repaint Levels True Enables real-time repainting (MT4 style)
🎯 Key Features
✅ TRUE MT4 BEHAVIOR – Exact replication of MetaTrader 4's classic ZigZag algorithm
✅ INTELLIGENT LABELS – Automatically identifies HH (Higher High), LH (Lower High), LL (Lower Low), and HL (Higher Low)
✅ REAL-TIME UPDATES – Optional repainting mode for live market analysis
✅ DIRECTION BACKGROUND – Visual market direction indicator (Green = Bullish, Red = Bearish)
✅ ALERT CONDITIONS – Get notified when the ZigZag direction changes
💡 How to Use
For Beginners:
Just add the indicator to your chart – the default settings (12,5,2) work perfectly for most timeframes!
For Advanced Traders:
Lower Depth (5-8) → More swings, more detail (scalping/1min charts)
Higher Depth (12-20) → Cleaner swings, fewer signals (swing trading/4H+ charts)
Adjust Deviation → Control minimum swing size based on volatility
🎨 Visual Guide
Lime Line = Price moving UP
Red Line = Price moving DOWN
HH Label = Higher High (uptrend continuation)
LH Label = Lower High (potential reversal down)
LL Label = Lower Low (downtrend continuation)
HL Label = Higher Low (potential reversal up)
📊 Best For
📌 Elliott Wave Counting – Perfect for identifying wave structure
📌 Support & Resistance – Automatically marks swing highs/lows
📌 Breakout Trading – Visualize clear break levels
📌 Divergence Trading – Spot hidden/regular divergences with RSI/MACD
📌 Harmonic Patterns – Identify XABCD patterns easily
⏰ Alert Conditions
Direction Changed – Triggered whenever the ZigZag changes direction
Bullish Direction – When price starts moving up
Bearish Direction – When price starts moving down
🔧 Troubleshooting
Q: Why does the indicator "repaint"?
A: That's how MT4 ZigZag works! Repainting shows the most accurate real-time swing points. Turn OFF "Repaint Levels" if you prefer traditional non-repainting behavior.
Q: What timeframes work best?
A: Works on ALL timeframes! Lower Depth values (5-8) for lower timeframes, higher Depth (12-20) for higher timeframes.
Q: Can I use this for automated strategies?
A: Yes! The alert conditions can trigger tradingview alerts for manual or webhook-based trading.
🙏 Credits
Original MT4 ZigZag logic ported to Pine Script™ v6 by lucemanb
Renamed and optimized as Cody Zig Zag
📝 Keywords
ZigZag MT4 Elliott Wave Swing High Swing Low Support Resistance Divergence Breakout Harmonic Patterns Price Action Trend Reversal Higher High Lower Low Technical Analysis TradingView Indicator Free Indicator
⭐ Support & Feedback
If you find this indicator useful:
Like & Follow for more tools
Leave a review with your suggestions
Share with your trading community
Happy Trading! 🚀
Disclaimer: This indicator is for educational and analytical purposes. Past performance does not guarantee future results. Always practice proper risk management. Индикатор

AG Pro Structure Labels [AGPro Series]AG Pro HH HL LH LL Structure Labels
Overview / What it does
AG Pro HH HL LH LL Structure Labels is a clean market-structure reader built to simplify price action without turning the chart into a wall of signals. Its core purpose is straightforward: identify confirmed swing highs and swing lows, classify them as HH, HL, LH, or LL, and connect those points in a visually readable structure path so traders can understand the current sequence of price development at a glance.
Many market structure tools try to do too much at once. They mix structure, signals, zones, pattern scoring, and trade suggestions into a single publication, which can make the chart heavier and the analytical purpose less clear. This script takes the opposite route. It focuses on one job only: making confirmed swing structure easier to read, follow, and interpret in real time as the chart evolves.
That design choice is what gives this script its value. Instead of asking the user to interpret disconnected highs and lows manually, the script builds a visible structure chain from confirmed pivots and labels each important step. The result is a chart that remains visually disciplined while still communicating trend continuation, structural weakening, and flow transitions in a simple and repeatable format.
This script is especially useful for traders who want structure clarity before they bring in any other layer of analysis. It can be used as a standalone structure map, or as a first-pass chart-cleaning tool before applying other concepts such as support and resistance, trend continuation logic, pullback analysis, breakout validation, or discretionary execution rules.
Unique Edge
The unique edge of this script is not that it attempts to predict where price will go next. Its strength is that it organizes confirmed structure in a way that is visually clean, logically consistent, and immediately usable on live charts.
Unlike many AG Pro scripts that are built around event detection, confluence scoring, price-zone visualization, setup quality filtering, or breakout logic, this publication is intentionally narrower and more focused. It is not a BOS/CHoCH event detector. It is not a liquidity-sweep model. It is not an order-block or fair-value-gap engine. It is not a breakout-quality, retest-quality, or pattern-quality scorer. It is also not a fixed reference-level tool such as a prior-day or prior-week high/low mapper. This script is a structure readability tool first and foremost.
That distinction matters.
Previous AG Pro releases often revolve around a specific trading event: a sweep, a break, a retest, a zone reaction, a continuation pattern, or a multi-factor confluence state. This script does not begin from an event. It begins from the swing chain itself. It asks a simpler question: what is the current sequence of confirmed highs and lows, and what does that sequence imply about market flow right now?
Because of that, the script fills a different role in the broader AG Pro library. It is closer to a structural map than a setup engine. It helps answer whether the chart is still printing constructive highs and lows, whether the sequence has started to weaken, or whether the structure is now leaning in the opposite direction. That makes it useful both on its own and as a foundation layer beneath other tools.
Another important differentiator is presentation discipline. The structure path provides continuity between pivots, while the label set communicates classification without unnecessary chart clutter. The compact floating HUD reinforces the current flow state without dominating screen space. Together, these choices make the script visually premium while keeping the chart readable.
Methodology
The script uses a confirmed pivot framework. Swing highs and swing lows are identified using left and right lookback parameters selected by the user. Because pivots require confirmation, labels appear only after the structure point is confirmed by the specified number of bars. This helps reduce noise and keeps the structure map grounded in confirmed rather than speculative swing points.
Once a new pivot high is confirmed, it is compared with the prior confirmed pivot high. If it exceeds the previous confirmed high, it is classified as HH. If it does not, it is classified as LH. The same logic applies on the low side: if a confirmed pivot low is above or equal to the previous confirmed pivot low, it is classified as HL; if it is lower, it is classified as LL.
The script also includes an ATR-based structure filter. This filter is designed to suppress micro-swings that are too small relative to current volatility, which helps maintain visual cleanliness on choppier charts. Instead of drawing every minor fluctuation, the script attempts to keep attention on swings that are more structurally meaningful for the selected sensitivity.
A structure path, shown as a clean zigzag line, connects the confirmed pivots that pass the filter. This gives the user an immediate visual map of the sequence rather than a collection of isolated labels. In practice, this is one of the most useful parts of the script because it turns the market’s swing progression into a readable path.
The floating HUD summarizes the current market-flow bias in a minimalist format. It is not intended to act as a trade signal. Its job is to provide a quick structural read so the user can see whether the recent chain is leaning bullish, bearish, or transitional according to the internal swing logic.
Signals & Alerts
This script is not designed as a one-click entry engine. Its alerts are structural, not predictive.
The publication includes alerts for newly confirmed HH, HL, LH, and LL prints, which can help users monitor structure development without staring at the chart continuously. It also includes alerts for structure-flow transitions when the internal trend state turns bullish or bearish.
These alerts are best understood as workflow alerts. They tell the user that structure has progressed into a new confirmed condition. They do not guarantee continuation, reversal, breakout success, or trade profitability. Their purpose is to improve awareness of structural change, not to replace independent analysis.
Key Inputs
Pivot sensitivity is controlled through left and right lookback values. Higher values usually produce fewer but more mature structure points, while lower values usually produce a faster and denser structure map.
The ATR filter can be enabled to reduce insignificant swings. This can be particularly helpful on lower timeframes or during periods of uneven, noisy price movement.
Users can also control whether the structure path is drawn and can adjust the visual typography for labels and HUD elements. These inputs allow the script to stay visually flexible across different chart styles and screen densities.
How this script differs from other AG Pro scripts
This distinction is central to the publication.
Many AG Pro scripts are built to evaluate the quality of a setup. They may score breakouts, retests, continuation patterns, reversal candles, pressure conditions, or confluence states. Others are built around zones and reactions, such as supply-demand mapping, premium-discount logic, fair value gaps, order blocks, or support-resistance behavior. Others focus on structural events such as BOS/CHoCH changes, liquidity sweeps, inducement traps, or session-specific reactions.
This script does none of those things.
It does not measure the quality of a signal.
It does not score a setup.
It does not project targets.
It does not identify fixed daily or weekly reference levels.
It does not try to map every institutional concept on the chart.
It does not attempt to be an all-in-one decision engine.
Instead, it provides a cleaner foundation: confirmed HH, HL, LH, and LL sequencing with a filtered structural path and a compact market-flow summary.
That is precisely why it is different from the previous AG Pro script as well. If the previous release was anchored to fixed price levels, event detection, or context-specific reactions, this script is anchored to swing continuity. If another AG Pro script answers where price reacted, where a sweep occurred, whether a breakout was strong, or whether a setup deserves a quality score, this one answers a more basic but highly important question: what is the confirmed structure chain doing right now?
In that sense, this script is less about trading events and more about structural readability.
Limitations & Transparency
This script uses confirmed pivots, which means it is not attempting to label unconfirmed structure in advance. As a result, there is an intentional delay equal to the confirmation logic chosen by the user. That delay is not a flaw; it is part of the design tradeoff required to avoid premature structure labels.
Like any pivot-based structure tool, output will vary depending on sensitivity settings, timeframe, market volatility, and symbol behavior. A lower sensitivity may reveal more swing detail but can also make the map denser. A higher sensitivity may create a cleaner structure path but may respond more slowly to local shifts.
The ATR filter is a visual-cleanliness tool, not a universal truth engine. It can help reduce noise, but different traders may prefer different levels of structural compression depending on how aggressively or conservatively they define meaningful swings.
This script should also not be interpreted as a complete trading plan. It does not include position sizing, stop placement, target selection, execution logic, or market-specific risk rules. Users should combine it with their own framework, testing process, and judgment.
Risk Disclosure
This script is for analytical and educational use. It is not financial advice, investment advice, or a recommendation to buy or sell any instrument.
Market structure is an interpretive framework, not a guarantee of future price behavior. A bullish sequence can fail, a bearish sequence can reverse, and a clean structural print can still occur inside a broader context that changes the meaning of the move.
Always use independent judgment, apply appropriate risk management, and evaluate the script in the context of your own market, timeframe, and process.
Summary
AG Pro HH HL LH LL Structure Labels is built for traders who value structural clarity over indicator overload. Its role in the AG Pro catalog is distinct: it is not an event hunter, not a zone engine, and not a quality scorer. It is a clean structure reader designed to make confirmed swing progression easier to see, easier to follow, and easier to integrate into a disciplined chart workflow.
If your goal is to understand whether price is still producing constructive highs and lows, whether that chain is weakening, or whether the flow has shifted into a different structural condition, this script is designed for exactly that task.
Индикатор
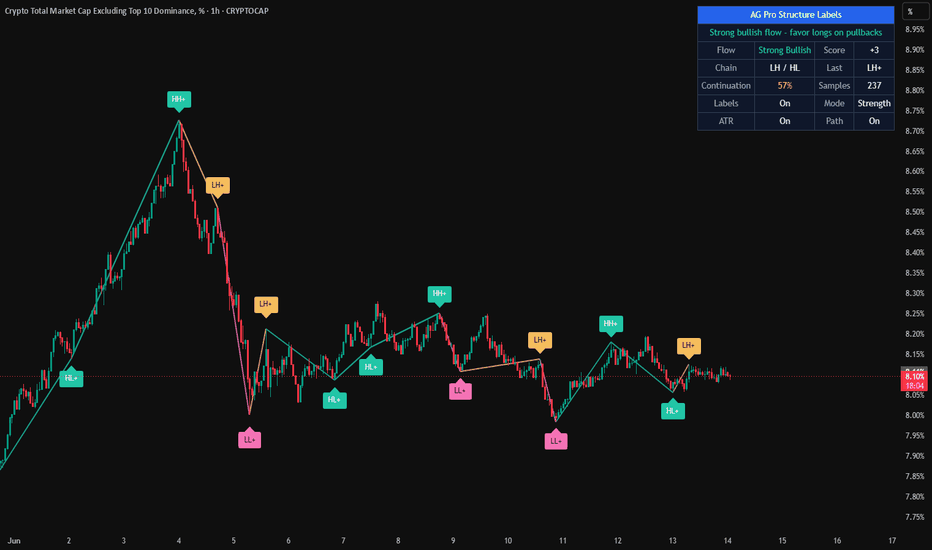
SMC EMA CROSS ZIG ZAG# Mega Trend Suite – SMC + EMA (Lightweight Edition)
**A professional Smart Money Concepts (SMC) toolkit combined with classic EMA crossovers and VWAP.**
No Heikin Ashi, no MA Cross EMA – just clean price action, order flow, and trend confirmation.
---
## 🔍 Overview
This indicator bundles the most essential tools for **institutional-style analysis**:
- ✅ **SMC Structure** (internal & swing BOS/CHoCH)
- ✅ **Order Blocks** (bullish/bearish, with box or candle highlight)
- ✅ **Fair Value Gaps (FVG)** with auto threshold & multi‑timeframe support
- ✅ **Premium / Discount Zones** + Equilibrium line
- ✅ **Multi‑Timeframe High/Low levels** (Daily / Weekly / Monthly)
- ✅ **ZigZag** (main & internal) with HH/HL/LH/LL labels
- ✅ **VWAP** – anchored to the session
- ✅ **Two EMA sets** (9/21 & 20/50) with cross signals
- ✅ **Compact Dashboard** (SMC bias & current timeframe)
- ✅ **Full alert system** for all SMC events and EMA crosses
---
## 🧠 Key Features Explained
### 1. Smart Money Concepts (SMC)
| Component | What it does |
|-----------|---------------|
| **Swing Structure** | Detects Break of Structure (BOS) and Change of Character (CHoCH) on a higher‑length pivot (default 50). Shows labels “BOS” or “CHoCH” when price crosses a swing high/low. |
| **Internal Structure** | Same as swing, but uses a shorter length (default 10) to catch micro‑structure changes. Optional confluence filter (body vs. wick). |
| **Order Blocks (OB)** | Stores the extreme bar (parsed by volatility filter) after a valid BOS/CHoCH. Displays as zone boxes or candle highlights. Mitigation detection (close / high/low). |
| **Fair Value Gaps (FVG)** | Detects 3‑bar imbalances on a chosen timeframe (or current). Uses auto‑threshold based on historical bar delta. Extendable boxes. |
| **Premium / Discount Zones** | Calculates the range between the highest swing high and lowest swing low. Shades the upper 50% (premium) and lower 50% (discount) with an equilibrium line in the middle. |
| **MTF High/Low Levels** | Plots previous period’s high/low for Daily, Weekly, Monthly. Line style (solid/dashed/dotted) and color customizable. |
| **ZigZag** | Classic pivot‑based ZigZag with HH/HL/LH/LL labels. Separate internal ZigZag available for finer swings. |
### 2. VWAP
- Standard Volume Weighted Average Price.
- Useful for intraday bias – price above VWAP = bullish tilt.
### 3. EMA Sets
Two independent EMA pairs:
- **Set 1:** 9 & 21 (fast)
- **Set 2:** 20 & 50 (slower)
Each set plots its own lines and generates up/down triangles on crossover / crossunder. Colours, widths, and signal colours are fully adjustable.
---
## ⚙️ Input Parameters (Grouped)
### 🔧 Master Controls
- `Enable SMC Module` – turn all SMC features on/off.
### 📊 SMC – General
- `Mode` – Historical (keeps all drawings) / Present (refreshes each bar).
- `Style` – Colored / Monochrome.
### 📊 SMC – Structure & Order Blocks
- Internal / Swing lengths, label sizes, BOS/CHoCH filter (All / BOS only / CHoCH only).
- OB display mode (Both / Zone Box / Candle Highlight).
- OB mitigation source (Close / High/Low).
- OB filter (ATR / Cumulative Mean Range).
### 📊 SMC – Fair Value Gaps
- Auto threshold on/off, custom timeframe, extend bars.
### 📊 SMC – MTF High/Low Levels
- Show Daily / Weekly / Monthly – each with independent line style & colour.
### 📊 SMC – Premium / Discount Zones
- Toggle zones, custom colours for premium, equilibrium, discount.
### 📊 ZigZag Swing Lines
- Main ZigZag depth/deviation/backstep, colours, width, style, labels.
- Optional internal ZigZag with separate settings.
### 📈 VWAP & EMA Sets
- VWAP on/off, colour, width.
- Two EMA sets: each with fast/slow lengths, colours, line width, cross signal colours.
### 📊 Dashboard
- Position (Top‑Left/Right, Bottom‑Left/Right), font size.
### 🎨 Colors
- Global bull / bear / neutral colours (used in dashboard).
---
## 🖥️ Dashboard
A small table shows at a glance:
- **SMC Bias** – Bullish / Bearish / Neutral (based on swing trend).
- **Current Timeframe** – e.g., “60” for 1h, “D” for daily.
The dashboard adapts to dark/light chart background.
---
## 🚨 Alerts (30+ conditions)
All alerts are available from the TradingView alert dialog:
| Category | Alerts |
|----------|--------|
| **Internal Structure** | Bull/Bear BOS, Bull/Bear CHoCH |
| **Swing Structure** | Bull/Bear BOS, Bull/Bear CHoCH |
| **Order Blocks** | Bull/Bear Internal OB mitigated, Bull/Bear Swing OB mitigated |
| **Fair Value Gaps** | Bull FVG formed, Bear FVG formed |
| **EMA Crosses** | EMA Set 1/2 Bull Cross, Bear Cross |
---
## 🧩 How to Use
1. **Add the indicator** to any chart (any symbol, any timeframe).
2. **Keep default settings** for a clean SMC + EMA experience.
3. **For scalping / intraday:**
- Enable Internal Structure (length 5–10).
- Use VWAP as bias filter.
- Watch for FVGs on 1m–15m.
4. **For swing trading:**
- Focus on Swing Structure (length 50+).
- Use Premium/Discount zones for entries (buy in discount, sell in premium).
- Confirm with EMA Set 2 (20/50) cross.
5. **Order Blocks:**
- When price returns to a bullish OB zone, look for buying opportunities.
- When a bearish OB gets mitigated, expect continuation down.
---
## 💡 Tips
- **Monochrome style** is perfect for grayscale / minimalistic setups.
- **Present mode** keeps drawings only on the current visible bars – useful for low‑resource usage.
- **FVG auto‑threshold** works best on higher timeframes (1h+). For lower timeframes, you may turn it off and use manual threshold via the `barDelta` calculation (already built‑in).
- The **ZigZag** does not repaint – it uses confirmed pivots.
---
## 📜 Credits & Version
- **Original concept:** Mega Trend Suite (SMC + HAMA + MA Cross EMA)
- **This edition:** Removed HAMA, MA Cross EMA, and Heikin Ashi Smoothed – keeping only SMC, VWAP, and EMA sets.
- **Version:** 1.0 (Pine Script v6)
---
## ❗ Notes
- This indicator is **not a financial advice** – always use proper risk management.
- Maximum drawings (labels, lines, boxes) are set to 500 each – enough for several months of data.
- Multi‑timeframe levels (Daily/Weekly/Monthly) work correctly only if the chart has enough historical data.
---
**Happy trading!**
*Mega Trend Suite – SMC + EMA* Индикатор

ABCD Harmonic Projection [WillyAlgoTrader]📐 ABCD Harmonic Projection is an overlay indicator that automatically detects ABCD harmonic patterns from ZigZag pivots, validates them against Fibonacci ratio constraints (BC/AB retracement + CD/AB extension), scores each pattern with a 4-factor quality engine (0–100), projects the D-point completion zone, and draws Target and Stop zones with Fibonacci extension and retracement levels — with full TP/SL outcome tracking and separate bull/bear win rate statistics.
The ABCD pattern is one of the foundational harmonic structures: four alternating swing points (A→B→C→D) where the BC leg retraces a Fibonacci portion of the AB leg, and the CD leg extends from C toward a projected D-point that is a Fibonacci ratio of the AB leg. When price reaches the D-point, the pattern completes — and a reversal or continuation move is expected. This indicator automates the entire detection-to-target workflow: find the swings, measure the ratios, validate the geometry, project the target, and track the outcome.
🧩 WHY THESE COMPONENTS WORK TOGETHER
Manually identifying ABCD patterns requires eyeballing four pivot points, measuring two Fibonacci ratios, estimating the D-point projection, and drawing the target zone — across multiple instruments and timeframes. Most traders miss patterns or miscalculate ratios.
This indicator chains each step into an automated pipeline:
ZigZag pivot detection → 4-point ABCD extraction → BC/AB ratio validation → CD/AB extension calculation → D-point projection → 4-factor quality scoring → Target Zone + Stop Zone placement → Fibonacci extension/retracement overlay → TP/SL outcome tracking → Win rate statistics
The ZigZag engine ensures only confirmed alternating swings are used (no noise pivots). The ratio validation filters patterns to only those within Fibonacci-valid ranges. The quality scoring ranks patterns by how close they are to ideal geometry. The D-point projection gives a specific price target — not a vague area. And the Target/Stop zones provide precise trade management levels anchored to the pattern's own geometry.
🔍 WHAT MAKES IT ORIGINAL
1️⃣ ZigZag pivot engine with direction management.
The indicator uses a directional ZigZag that enforces strict alternation: after a swing high, only a swing low is accepted (and vice versa). If price makes a higher high during an existing up-leg, the previous swing high is updated in place (not duplicated). This prevents the common problem of multiple consecutive highs being treated as separate pivots.
Pivots are detected using ta.pivothigh/ta.pivotlow with configurable lookback (default 8 bars). The ZigZag stores prices, bar indices, and directions in parallel arrays — providing the last 200 pivots for pattern scanning.
2️⃣ Fibonacci-validated ABCD pattern detection.
When a new pivot is confirmed and at least 4 pivots exist, the indicator extracts the most recent A, B, C points and validates:
— BC/AB retracement ratio : must be between minBcAbRatio (default 0.382) and maxBcAbRatio (default 0.886). Classic ABCD ratios are 0.382, 0.500, 0.618, 0.786, and 0.886. Patterns outside this range are rejected.
— ATR minimum swing filter : the AB leg must be at least 1× ATR in size — filtering out noise patterns during low-volatility bars.
— Minimum leg depth : AB must span at least 3 bars — ensuring the pattern has temporal structure, not just a single spike.
Pattern direction: if B > A → bullish ABCD (D projected above C). If B < A → bearish ABCD (D projected below C).
The D-point is projected from C using the average of the configurable CD/AB ratio range: projectedD = C + direction × |AB| × avgCdAbRatio.
3️⃣ 4-factor pattern quality scoring (0–100).
Each detected pattern receives a quality score from four dimensions:
— 📐 Fibonacci precision (45 pts) : how close BC/AB is to the nearest standard Fibonacci level (0.382, 0.500, 0.618, 0.786, 0.886, 1.000, 1.272, 1.618). Exact Fib ratio = full points. 0.05 away = partial. 0.18+ away = zero. This is the most heavily weighted factor because Fibonacci alignment is the core of harmonic pattern validity.
— ⏱️ Time symmetry (25 pts) : the ratio of estimated CD bars to AB bars. Perfect symmetry (CD bars = AB bars) = 25 points. Asymmetric patterns (one leg much longer) score lower.
— ⚖️ Price symmetry (20 pts) : BC retracement depth relative to 0.618 — deeper retests (closer to 0.618) score higher. Very shallow pullbacks (e.g., 0.236) receive fewer points.
— 📏 Leg maturity (10 pts) : AB leg length in bars — patterns with 8+ bars get full points, 5+ get 7, 3+ get 3. Single-bar spikes score zero.
Patterns below the Min Pattern Score threshold (default 40) are not displayed.
4️⃣ Fibonacci extension levels projected from C.
Four AB extension levels are drawn from point C in the direction of the pattern:
— 0.786 × |AB| — shallow completion
— 1.000 × |AB| — classic equal-leg ABCD
— 1.272 × |AB| — extended completion
— 1.618 × |AB| — maximum extension
The 1.0 level is drawn thicker (2px, less transparency) as it represents the ideal equal-leg completion. Each level includes a price label. Additionally, the measured BC/AB retracement ratio is displayed at the midpoint of the BC leg for reference.
5️⃣ Fibonacci retracement levels within C→D (partial TP targets).
For active patterns, three retracement levels are drawn between C and the projected D:
— 0.382 of CD range — first partial profit target
— 0.500 of CD range — mid-target
— 0.618 of CD range — aggressive partial take
These provide natural exit levels before the full D-point is reached — useful for scaling out of positions progressively.
6️⃣ Target Zone + Stop Zone with geometric sizing.
On each pattern:
— TARGET ZONE : a band around the projected D-point, sized at 10% of the CD range. For bullish patterns: the zone sits just below D. For bearish: just above D. This is where the pattern completion trade expects to reach profit.
— STOP ZONE : a band around point C, also sized at 10% of CD range. For bullish patterns: below C. For bearish: above C. If price returns past C, the pattern structure is broken.
Both zones extend rightward until price touches the target zone (tracked by touch bar), or the pattern resolves (TP/SL hit). Zones use distinct colors: green for target, red for stop.
7️⃣ TP/SL outcome tracking with separate bull/bear statistics.
Each active pattern monitors:
— TP hit : price reaches the projected D-point (high ≥ D for bull, low ≤ D for bear)
— SL hit : price returns past C against the pattern direction (low ≤ C for bull, high ≥ C for bear)
— Simultaneous TP+SL on the same bar → resolved as loss (conservative)
On TP hit: R:R is calculated as |entry to TP| / |entry to SL| and accumulated. The dashboard shows separate bull and bear win rates with average R:R on wins.
8️⃣ Active-only display mode.
When "Show Active Only" is enabled (default), completed patterns (TP or SL already hit) are hidden — only the current live pattern remains on the chart. When disabled, up to maxPatterns historical patterns are shown for context. This prevents chart clutter while maintaining full statistical tracking.
9️⃣ One-active-pattern constraint.
The indicator only allows one active pattern at a time. When an active pattern exists (status = 0), no new patterns are detected. This prevents overlapping projections and conflicting zones. A new pattern can only be detected after the current one resolves (TP or SL).
⚙️ HOW IT WORKS — CALCULATION FLOW
Step 1 — ZigZag: Directional pivot detection with alternation enforcement. Higher highs update existing swing (no duplicate). Lower lows same. Pivots stored in parallel arrays.
Step 2 — Pattern extraction: On each new confirmed pivot: extract A (3rd-to-last), B (2nd-to-last), C (latest). Compute AB length, BC length, BC/AB ratio.
Step 3 — Validation: BC/AB within Fibonacci range? AB ≥ ATR? AB ≥ 3 bars? No active pattern already?
Step 4 — Scoring: 4 factors: Fibonacci precision (45), time symmetry (25), price symmetry (20), leg maturity (10). Score ≥ minScore → pattern accepted.
Step 5 — Projection: D = C + direction × |AB| × avgCdAbRatio. Bars capped at maxBarsProjection.
Step 6 — Drawing: On barstate.islast: delete-and-redraw all visible patterns. AB and BC legs as solid lines. CD projection as dotted. A/B/C/D labels. Score label. Target/Stop zones as boxes. Fib extension and retracement levels as dashed lines with price labels.
Step 7 — Evaluation: Each bar: check all active patterns for TP/SL hits. Update status, accumulate win/loss stats, record R:R.
📖 HOW TO USE
🎯 Quick start:
1. Add the indicator — ABCD patterns appear automatically as colored leg lines with A/B/C/D labels
2. Yellow dotted line from C = projected path to D
3. Green "TARGET ZONE" box = where price should reach (take profit)
4. Red "STOP ZONE" box = where the pattern is invalidated (stop loss)
5. Blue dashed lines = Fibonacci extension levels (0.786, 1.0, 1.272, 1.618)
6. Blue dotted lines = partial TP targets (0.382, 0.5, 0.618 of CD)
7. "Long"/"Short" label = confirmed entry signal
👁️ Reading the chart:
— 🟢 Green legs + labels = bullish ABCD (D above C, expecting up-move)
— 🔴 Red legs + labels = bearish ABCD (D below C, expecting down-move)
— 🟡 Dotted projection line = expected path C → D
— 🟢 "TARGET ZONE" box = profit target area around projected D
— 🔴 "STOP ZONE" box = invalidation area around C
— 🔵 Dashed lines = Fib extension levels from C (0.786/1.0/1.272/1.618 of AB)
— 🔵 Dotted lines = CD retracement levels (partial TPs: 0.382/0.5/0.618)
— Score label (e.g., "72%") = pattern quality
📊 Dashboard fields:
— Patterns: active / total count
— Last Signal: direction + status (Active/TP ✓/SL ✗) + score
— Bull W/L: wins/losses and win rate for bullish patterns
— Bear W/L: wins/losses and win rate for bearish patterns
— Avg R:R: average reward-to-risk on winning bull/bear trades
— ATR: current value for reference
— Timeframe, version
🔧 Tuning guide:
— Too many patterns: increase ZigZag Length (12–21), increase Min Score (60+), enable ATR filter
— Too few patterns: decrease ZigZag Length (5–8), decrease Min Score (30), widen BC/AB ratio range
— Patterns too small: increase ATR filter or ZigZag Length
— Want only perfect geometry: narrow BC/AB to 0.500–0.786, set CD/AB to 0.9–1.1, Min Score 70+
— Extended patterns: set Max CD/AB to 1.618 or higher
⚙️ KEY SETTINGS REFERENCE
⚙️ Main:
— ZigZag Length (default 8): pivot detection lookback
— Pivot Sources : configurable high/low sources
📐 Pattern:
— Min/Max BC/AB Ratio (default 0.382/0.886): Fibonacci retracement range
— Min/Max CD/AB Ratio (default 0.786/1.618): extension range for D projection
— Min Pattern Score (default 40): quality threshold
— ATR Filter (default On): minimum swing size
— Max Patterns (default 3): display limit
— Active Only (default On): hide completed patterns
🎨 Visual:
— Buy/Sell signals, D projection, Fib levels, TP/SL zones, A/B/C/D labels, score (all toggleable)
— Auto / Dark / Light theme
🔧 Advanced:
— Max Bars for D Projection (default 200): limits distant projections
🔔 Alerts
— 🟢 LONG ABCD / 🔴 SHORT ABCD — entry, TP, SL, score, pattern type
All support plain text and JSON webhook format. Bar-close confirmed.
⚠️ IMPORTANT NOTES
— 🚫 No repainting. All signals require barstate.isconfirmed and newPivot (confirmed ZigZag pivot). Patterns are detected after the pivot bar closes. Drawings are rendered on barstate.islast using delete-and-redraw — previous bar's pattern state is final.
— 📐 The ZigZag enforces strict alternation : high → low → high → low. If price makes a higher high during an existing up-swing, the previous high is updated in place — no duplicate pivots are created. This is essential for correct A/B/C/D extraction.
— ⚖️ Only one active pattern is allowed at a time. New patterns are blocked until the current one resolves (TP or SL). This prevents conflicting signals and overlapping zones.
— 📊 The quality score is heavily weighted toward Fibonacci precision (45 out of 100 points). A pattern with BC/AB exactly at 0.618 scores much higher than one at 0.450. This reflects the harmonic principle that Fibonacci alignment is the primary measure of pattern validity.
— 🔒 Simultaneous TP+SL on the same bar is resolved as a loss (conservative) . This prevents ambiguous outcomes from inflating win rates.
— 📏 The D-point projection uses the average of the min/max CD/AB ratio range — not the exact 1.0 (equal legs). With default settings (0.786–1.618), the projected D is at 1.202× AB from C — between classic and extended. Adjust the CD/AB range to target specific completion types.
— 🛠️ This is a harmonic pattern detection and projection tool , not an automated trading bot. It identifies ABCD geometry, projects D-point targets, and provides structured trade zones — trade decisions remain yours.
— 🌐 Works on all markets and timeframes. Индикатор

Zigzag Sequence DetectorOVERVIEW
This indicator is a dynamic pattern recognition tool built strictly on market structure mechanics. It detects custom sequences of Zigzag-based pivot points in real-time. It was developed to automate the tedious process of visually tracking structural shifts and to provide a programmatic foundation for sequence-based trading. It falls into the category of Price Action and Market Structure analysis.
MAIN CONCEPT
If we consider the market as a massive text, this script can be seen as a 'scanning tool' that finds the exact sentence we are looking for it. You write a sentence consisting of the words 'HH, HL, LL, and LH', and this indicator highlights exactly where that sequence occurs in the text.
ZIGZAG & PIVOTS
The core of this tool relies on the ZigZag algorithm, which filters out market noise by only drawing lines when the price reverses by a defined threshold. It reveals the skeletal framework of price action. At the peaks and troughs of these lines lie the pivot points: Higher High (HH), Lower Low (LL), Higher Low (HL), and Lower High (LH). In trading literature, these pivots are the fundamental building blocks of Dow Theory. Tracking these points provides a raw, unfiltered narrative of whether buyers or sellers are in control.
There are many ZigZag alternatives on TradingView that can produce effective results. However, the open-source model developed by @DevLucem provides, in my opinion, the most suitable structure to work on. The original version was based on percentage deviation; I made a minor addition for Mintick-based calculation and update it to version 6 of Pine Script. Special thanks to for his inspiring work.
MECHANICS
• The internal logic uses `chart.point` objects to cleanly track price and time coordinates. As the direction shifts, these objects are copied to maintain independent references.
• `f_calc_dev()`: Dynamically calculates the deviation threshold based on the user's selection (Mintick or Percent).
• `f_parse_sequence()`: Takes the raw string input, strips whitespaces, and splits it into a clean array for processing.
• `f_check_sequence()`: Isolates the most recent elements of the historical pivot array and evaluates them against the user's target sequence array element by element.
• The `trade_direction` state machine uses a unique integer-based accumulation system rather than a simple binary (1 or -1) toggle. It increments (+1, +2) for consecutive Long signals and decrements (-1, -2) for consecutive Shorts. This makes the script highly adaptable for developers building pyramiding strategies or dynamic position sizing models.
HOW TO USE
• Load the indicator on your chart and set your noise-filtering parameters via `Depth`, `Deviation Mode`, `Deviation Value`, and `Backstep`.
• In the settings, input your desired market structures for Entries and Exits using comma-separated values (e.g., "HH,HL,LH").
• You can define Long Entry, Long Exit, Short Entry and Short Exit conditions independently.
• You can also toggle the visual outputs on or off and set the colors in the indicator settings.
THE ALTERNATING PIVOT RULE (Important Note on Sequence Building)
• By the inherent geometric laws of the ZigZag algorithm, market structure must strictly alternate between a peak (High) and a trough (Low). It is structurally impossible for two consecutive peaks or two consecutive troughs to form. Therefore, when building your custom patterns, a High-type pivot must always be followed by a Low-type pivot, and vice versa.
• Invalid Sequences: "HH, HH", "HH, LH", "LH, HH", "LH, LH", "LL, LL", "LL, HL", "HL, LL", "HL, HL". (The engine will accept these inputs, but the condition will never occur on the chart, meaning no signals will ever trigger.)
• Always ensure your custom text sequences obey this strict alternating logic before expecting valid signals.
OUTPUTS
• The script plots ZigZag lines and annotates each confirmed pivot directly on the chart.
• Upon detecting a target sequence, it displays Entry or Exit signals on the triggering bar.
• It continuously feeds raw data (such as the exact `trade_direction` integer and active signal states) into the Data Window for quantitative tracking.
• It allows for setting automated Tradingview alerts based entry and exit signals.
DISCLAIMER
• The default signal sequences are provided for demonstration purposes only; it is the user's responsibility to define meaningful patterns.
• This indicator is not a standalone trading strategy or a predictive tool.
• It mathematically identifies what has already happened based on rigid pivot definitions.
• If the `Last Leg (Repaint)` option is enabled, it evaluates the developing market structure in real-time. This means signals on the current bar can appear and vanish if the price reverses before the pivot is locked in. Индикатор

Gann-Fibonacci Swing Toolkit [BigBeluga]🔵 OVERVIEW
Gann–Fibonacci Swing Toolkit is an advanced swing-based projection tool that combines classic Gann geometry with Fibonacci ratios.
The indicator automatically detects market swings, anchors them to the most recent structure, and dynamically plots either Gann Fans or Gann Boxes to visualize price–time relationships, trend angles, retracement zones, and expansion targets.
This toolkit is designed to help traders understand not only where price may react, but also how fast it should move relative to time.
🔵 HISTORICAL BACKGROUND
The foundation of this toolkit comes from two of the most influential schools of market geometry:
W.D. Gann (early 1900s) introduced the idea that markets move according to geometric and mathematical laws, where price and time must stay in balance . His work emphasized angles (such as 1×1, 1×2, 1×3) that define how much price should advance or decline per unit of time.
Fibonacci ratios , derived from the Fibonacci sequence and popularized in trading decades later, describe natural proportional relationships observed across markets, especially during corrections and expansions.
Modern technical analysis merges these ideas by applying Fibonacci ratios to Gann’s price–time framework, creating tools that measure both distance (price) and duration (time) .
The Gann–Fibonacci Swing Toolkit follows this combined philosophy by grounding all projections in real swing structure rather than static or manually drawn anchors.
🔵 CORE CONCEPT
Swing-Based Anchoring — All calculations start from confirmed swing highs and lows detected via a rolling highest/lowest lookback.
Directional Context — The tool automatically determines bullish or bearish structure and adapts all projections accordingly.
Price–Time Geometry — Gann logic is applied by projecting price movement relative to elapsed bars, not just price distance.
🔵 KEY FEATURES
SWING DETECTION LOGIC
A swing high is confirmed when price forms a local maximum and then fails to extend higher.
A swing low is confirmed when price forms a local minimum and then fails to extend lower.
The most recent completed swing becomes the anchor point for all Gann and Fibonacci calculations.
Optional ZigZag lines visually connect completed swings for structural clarity.
GANN FAN MODE
When Fibonacci Type = Fan , the indicator plots dynamic Gann fan angles from the swing anchor.
Fan Ratios — Each fan line represents a 1/x (1/1, 1/2, 1/3, etc.), defining how much price should move per unit of time.
Trend-Aware Projection
- Bullish fans project upward from swing lows.
- Bearish fans project downward from swing highs.
Fan Fill Zones — Optional shaded regions between fan levels highlight price compression and expansion areas.
GANN BOX (FIBONACCI BOX) MODE
When Fibonacci Type = Box , the indicator builds a Gann Box using Fibonacci retracement and time ratios.
Horizontal Levels — Fibonacci price retracement levels (0.236, 0.382, 0.5, 0.618, 0.786) are projected from the swing range.
Vertical Levels — Fibonacci time divisions are applied across the swing duration to estimate timing of reactions.
Inverse Mode — Flips retracement logic to project inverted expansions instead of standard pullbacks.
OTE Zone — Optional Optimal Trade Entry zone highlights the premium/discount retracement area.
Dual-Axis Structure — Combines price and time into a single geometric framework instead of treating them separately.
MAIN FRAME LOGIC
A dynamic frame is drawn between the swing anchor and current bar, scaled by trend slope.
The frame visually represents the dominant trend channel derived from swing geometry.
VISUAL ELEMENTS
Swing anchor labels mark the exact price and bar index used for calculations.
Color-coded bullish and bearish swings improve structural readability.
Labels on fan and box levels display their exact Fibonacci ratios.
🔵 HOW TO USE
Use Gann Fans to trade dynamic trend support and resistance that evolves with time.
Use Gann Boxes to identify high-probability retracement zones and timing windows.
Combine fan angles with horizontal box levels for confluence-based entries.
Disable ZigZag if you want a cleaner chart focused only on projections.
🔵 CONCLUSION
Gann–Fibonacci Swing Toolkit is a geometry-driven market structure tool that goes beyond static Fibonacci levels.
By uniting Gann’s price–time balance with Fibonacci proportionality and anchoring everything to real swing structure, the indicator provides a deeper framework for understanding trend behavior, corrective depth, and future reaction zones — all derived directly from price action itself. Индикатор

Price Simplification [LuxAlgo]The Price Simplification indicator provides a streamlined representation of price action by reducing complex market movements into essential trend segments using the Ramer-Douglas-Peucker (RDP) algorithm.
This indicator calculates its output based on a fixed window of historical data. Consequently, the line segments are displayed retrospectively and are subject to repainting as new bars develop and the calculation window shifts.
🔶 USAGE
The indicator is designed to help traders identify the core structure of price movement by filtering out "noise"—small fluctuations that do not significantly impact the overall trend. By simplifying the price into a series of connected segments, it becomes easier to visualize support/resistance levels, trend slopes, and market geometry.
Users can adjust the level of simplification to suit their needs:
A lower ATR Multiplier will result in a line that follows price closely, capturing more minor swings.
A higher ATR Multiplier will produce a more aggressive simplification, highlighting only the most significant market turns.
🔹 Extension Line
The script includes an "Extend Last Segment" feature. When enabled, it projects the trajectory of the final simplified segment into the future using a dashed line. This projection begins one bar after the most recent data point, providing a visual guide for the current price momentum without overlapping the historical simplification.
🔶 DETAILS
The core logic of this tool relies on the Ramer-Douglas-Peucker (RDP) algorithm, a classic algorithm used in computer graphics and cartography to reduce the number of points in a curve.
The algorithm works through an iterative process:
It starts with a line segment connecting the first and last points of the lookback window.
It identifies the point between these two ends that is furthest from the segment (perpendicular distance).
If this maximum distance is greater than a specified threshold, that point is kept as a "key point," and the algorithm splits the segment into two parts, repeating the process for each.
If no point is further than the threshold, all intermediate points are discarded, and the segment remains a straight line.
To ensure the simplification remains consistent across different assets and timeframes, the script normalizes price coordinates using the Average True Range (ATR) . This means the threshold for keeping a point is relative to the current market volatility rather than a fixed price value.
🔶 SETTINGS
Window Size : The number of recent bars used to apply the RDP algorithm to.
ATR Multiplier : The sensitivity of the simplification. Higher values lead to fewer segments and a simpler line.
ATR Length : The period used to calculate the ATR for price normalization.
Line Color : The color of the simplified polyline.
Line Width : The thickness of the polyline and extension.
Extend Last Segment : When enabled, projects the slope of the final segment forward as a dashed line starting one bar after the last point.
Индикатор

Auto Fibonacci Lines Depending on ZigZag %In the world of technical analysis, few tools are as powerful—or as misused—as Fibonacci Retracements. The Auto Fibonacci Lines Depending on ZigZag % is not just an indicator; it is a complete, automated trading system designed to eliminate subjectivity and bring institutional-grade precision to your charts.
This script automates the identification of significant market structures using a ZigZag algorithm. Once a market swing is mathematically confirmed (based on your deviation settings), it instantly projects a complete suite of Retracement and Extension levels. This allows you to stop guessing where to draw your lines and start focusing on price action.
🧠 The Logic Behind the Indicator
Understanding how your tools work is the first step to trusting them. This script operates on a three-step logic loop:
ZigZag Identification:
The script continuously monitors price action relative to the last known pivot point. It uses a user-defined Deviation % to filter out market noise. A new "Leg" is only confirmed when price reverses by this specific percentage. This ensures that the Fibonacci lines are only drawn on significant market moves, not random chop.
Automated Anchor Points:
Once a downward trend is confirmed (e.g., price drops 30% from the top), the script automatically anchors the Fibonacci tool to the Swing High (Start) and the Swing Low (End). It does this without you needing to click or drag anything.
Dynamic Cleanup:
Markets evolve. A key feature of this script is its self-cleaning mechanism. As soon as a new trend leg is confirmed, the script automatically deletes the old, invalidated Fibonacci lines and draws a fresh set for the new structure. This keeps your chart clean and focused on the now.
🎓 How to Trade This System
This indicator is color-coded to simplify your decision-making process. It moves beyond standard "rainbow" charts by categorizing price levels into three distinct actionable zones.
1. The "Reload Zone" (White Lines: 0.618 - 0.786) ⚪
Role: High-Probability Support / Entry
In institutional trading, the 0.618 (Golden Ratio) to 0.786 region is often where algorithms step in to defend a trend.
Why it works : This is the "discount" area where smart money re-accumulates positions before the next leg up.
2. The "Decision Wall" (Blue Lines: 1.382 - 1.5) 🔵
Role: Strong Resistance / Trend Check
This is a unique feature of this suite. The 1.382 and 1.5 levels often act as a "ceiling" for weak breakouts.
Strategy : If you entered in the White Zone, the Blue Zone is your first major hurdle. If price stalls here, consider securing partial profits.
Warning : A rejection from the Blue Lines often leads to a double-top formation. However, a clean break above the Blue Lines usually signals a parabolic move is beginning.
3. The "Extension Zone" (Yellow, Red, Purple > 1.618) 🟡🔴
Role : Take Profit / Exhaustion
Levels above 1.5 (starting with the 1.618 Golden Extension) are statistical extremes.
Strategy : These are Strict Take Profit levels. Do not FOMO (Fear Of Missing Out) into new long positions here. The probability of a reversal increases drastically as price climbs through these levels (2.618, 3.618, 4.618).
📐 The Mathematical Edge: Logarithmic vs. Linear
One of the most critical features of this script is the ability to toggle between Logarithmic and Linear calculations.
Why use Logarithmic?
If you are trading Crypto (Bitcoin, Altcoins) or high-growth Tech Stocks, linear Fibonacci levels are mathematically incorrect over large moves. A 50% drop from $100 is different than a 50% drop from $10.
This script calculates the percentage difference (Log Scale), ensuring your targets are accurate even during 100%+ parabolic runs.
Why use Linear?
For mature markets like Forex (EURUSD) or Indices (SPX500) where volatility is lower, Linear scaling is the industry standard.
🛠️ Configuration & Best Practices
Deviation % : This is the heartbeat of the indicator.
Swing Trading : Set to 20-30%. This filters out noise and only draws Fibs on major macro moves.
Scalping : Set to 3-5%. This will catch smaller intraday waves.
Text Place : Keeps your chart clean by pushing labels to the right, ensuring they don't overlap with the current price action.
👤 Who Is This Indicator For?
The Disciplined Trader : Who wants to remove emotional bias from their charting.
The Crypto Investor : Who needs accurate Logarithmic targets for long-term holding.
The Confluence Trader : Who combines these automated levels with Order Blocks, RSI, or Volume to find the perfect entry.
⚠️ RISK DISCLAIMER & TERMS OF USE
For Educational Purposes Only:
This script and the strategies described herein are provided strictly for educational and informational purposes. They do not constitute financial, investment, or trading advice. The "Auto Fibonacci Lines" indicator is a tool for technical analysis and should not be used as the sole basis for any trading decision.
No Guarantees:
Past performance of any trading system or methodology is not necessarily indicative of future results. Financial markets are inherently volatile, and trading involves a high level of risk. You could lose some or all of your capital.
User Responsibility:
By using this script, you acknowledge that you are solely responsible for your own trading decisions and risk management. The author assumes no liability for any losses or damages resulting from the use of this tool or the information provided. Always consult with a qualified financial advisor before making investment decisions. Индикатор
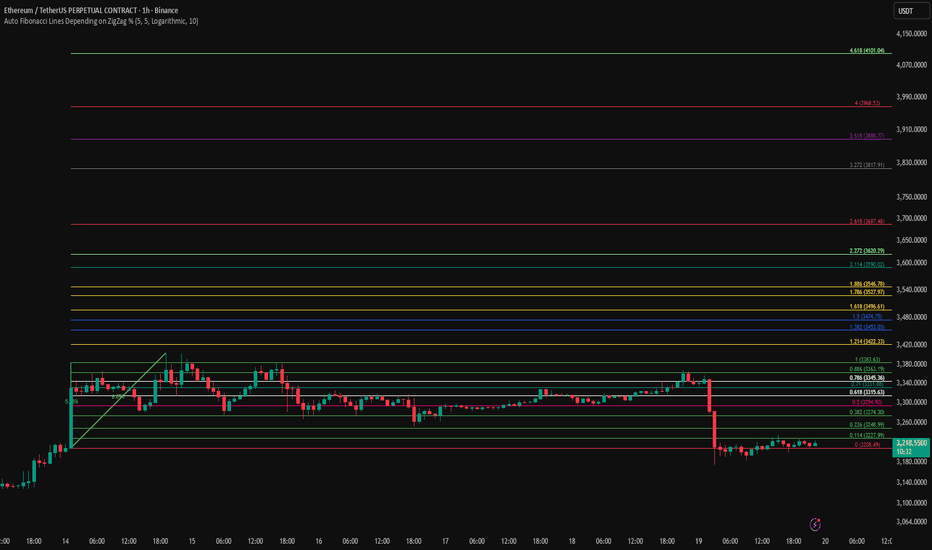
Индикатор