Индикатор
Индикатор

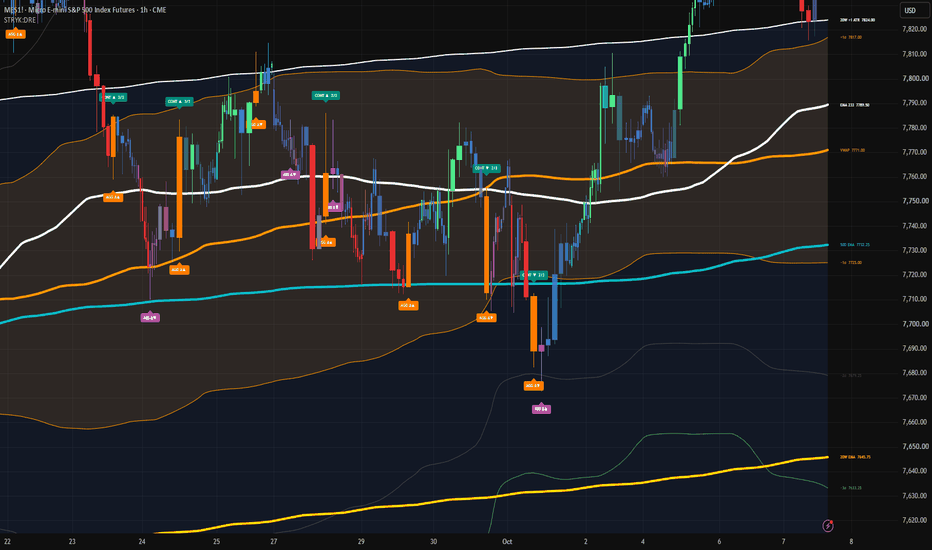
Dinamik EMA PRO MAXDinamik EMA PRO MAX shows only the exponential moving averages that are closest to price, instead of filling the chart with every length at once. It keeps a chosen number of EMAs above price and a chosen number below it, so the nearest dynamic support and resistance levels stay readable on any symbol and timeframe.
WHAT MAKES IT DIFFERENT
A standard moving average script plots a fixed list of lines. This script calculates 12 lengths (34, 50, 55, 89, 100, 144, 200, 233, 377, 500, 610, 1000) fro Индикатор

Индикатор

Стратегия
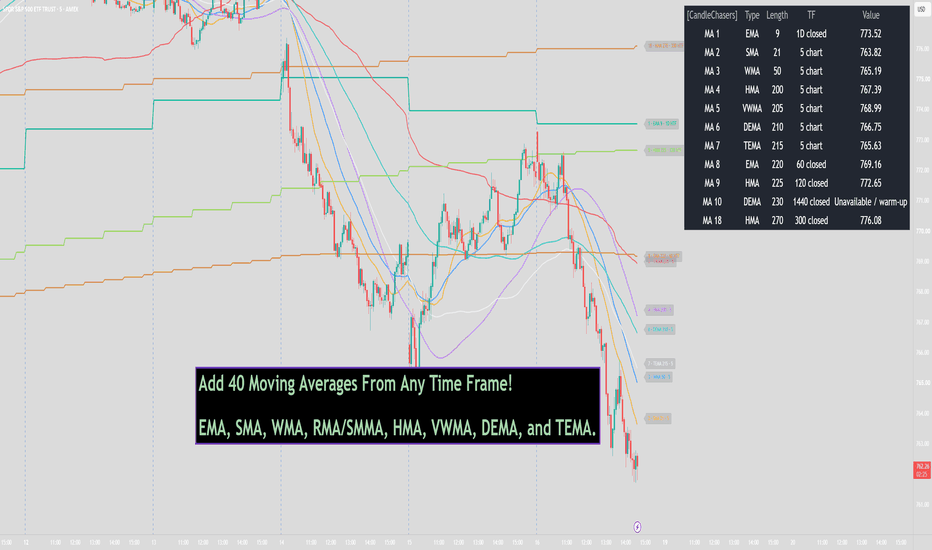
Add 40 Moving Averages From Any Time Frame [CandleChasers]Add 40 Moving Averages From Any Time Frame
One workspace for comparing up to 40 moving averages with independent types, lengths, and timeframes. The purpose is flexible comparison and clear identification without stacking many separate indicator instances.
Each numbered slot has its own enable switch, average type, length from 1 to 2000, and timeframe. Per-line color and thickness are adjustable under Settings → Style. A shared source selector offers Close, Open, High, Low, HL2, HLC3, or OH Индикатор
Индикатор

Индикатор
Индикатор
Индикатор
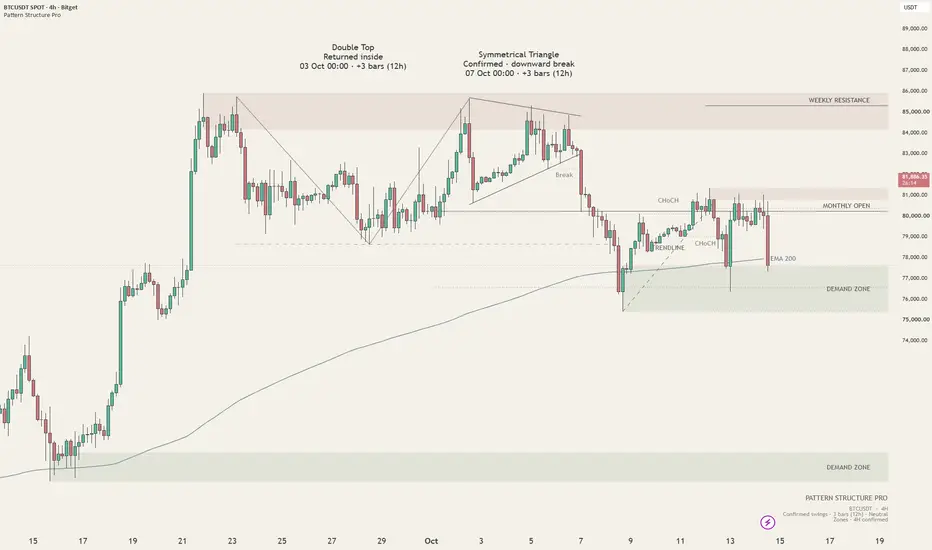
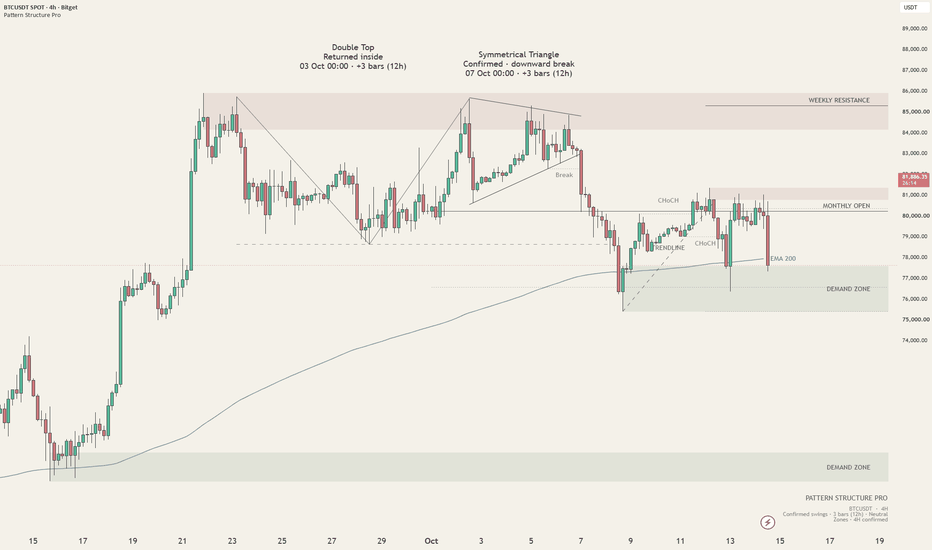
Pattern Structure ProPattern Structure Pro is an open-source chart overlay for patterns, market structure and price context.
It displays tops/bottoms, head-and-shoulders formations, triangles, wedges, flags, pennants, channels and rectangles. Additional layers include swing labels, BOS/CHoCH, a swing trendline, supply/demand zones, weekly/monthly reference levels and optional EMA 200. Up to three selected patterns are shown.
The engine compares pivot sequences and fitted boundaries using ATR-based tolerances. Patt Индикатор
Стратегия
Индикатор

Стратегия

Индикатор
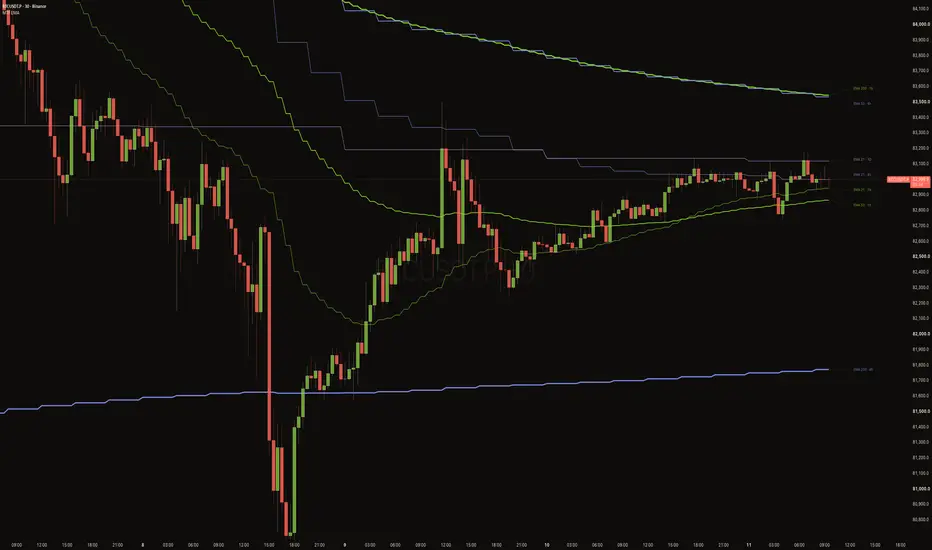
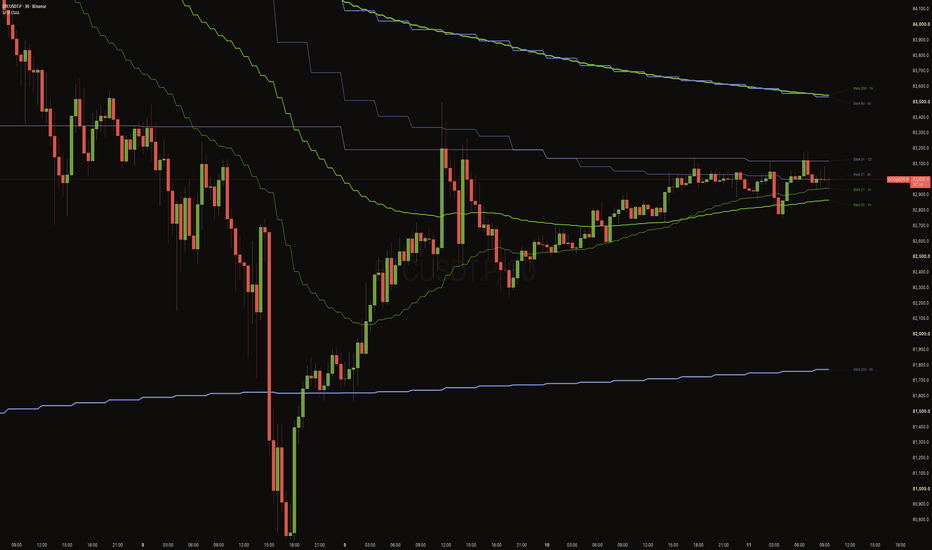
Multi Time Frame EMA 21 / 50 / 200Title:
Multi Time Frame EMA 21 / 50 / 200
Description:
Multi Time Frame EMA 21 / 50 / 200 draws the 21, 50 and 200 EMAs from up to 12 timeframes on one chart, with one indicator. Each line ends in a small note, such as "EMA 200 · 4h", so you can always tell which timeframe and EMA a line belongs to.
HOW IT WORKS
• Timeframes: Chart, 1m, 3m, 5m, 15m, 30m, 1h, 4h, 8h, 1D, 3D and 1W.
• For each timeframe the script calculates the three EMAs on that timeframe's own candles and draws them on your c Индикатор
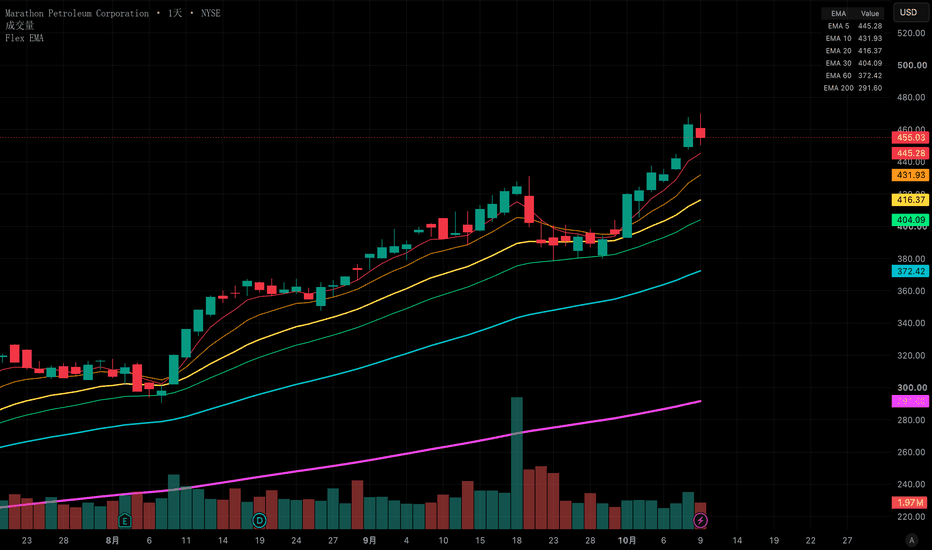
Flex EMA Ribbon 10 Customizable LinesFlex EMA Ribbon — 10 Customizable Lines is a flexible trend indicator that displays up to 10 exponential moving averages (EMAs) directly on the price chart.
The default periods are 5, 10, 20, 30, 50, 60, 100, 120, 200, and 250. Each period can be changed independently, and each line can be shown or hidden using its “Show” checkbox. Calculations automatically follow the chart timeframe: daily charts use daily EMAs, weekly charts use weekly EMAs, and the same applies to monthly, yearly, and intrad Индикатор
Индикатор
Индикатор
Индикатор
Индикатор
Индикатор
Индикатор
Индикатор