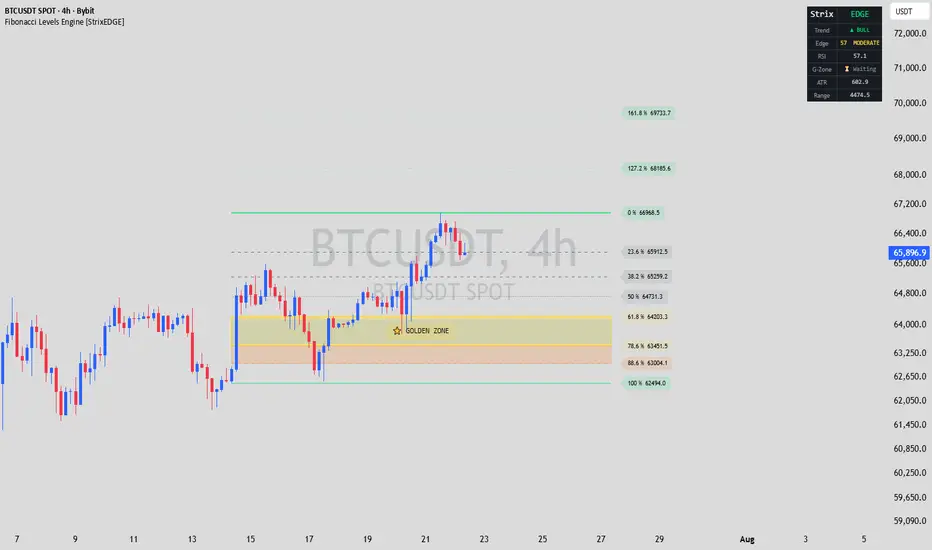
BB Fill + Visible-Range Fib Retracement# BB Fill + Visible-Range Fib Retracement
A 2-in-1 Pine Script indicator that bundles a **Bollinger Bands volatility fill** and a **visible-range Fibonacci retracement** into a single script. If your TradingView plan limits the number of indicators you can have on a chart at once, this lets you get both tools for the price of one indicator slot.
## Bollinger Bands (grey fill)
Standard Bollinger Bands math is used under the hood:
- **Basis** = Simple Moving Average (SMA) of the source over the chosen length.
- **Upper band** = Basis + (StdDev of source over the length × multiplier).
- **Lower band** = Basis − (StdDev of source over the length × multiplier).
Unlike a typical BB indicator, the basis, upper, and lower lines are **not drawn**. Only the shaded area between the upper and lower bands is visible, giving a quick, uncluttered read on volatility/price range without adding extra lines to your chart.
**Inputs:**
- **BB Length** (default `20`) — number of bars used for the moving average and standard deviation.
- **BB Source** (default `close`) — price series the calculation is based on.
- **BB StdDev Multiplier** (default `2.0`) — how many standard deviations the bands extend from the basis.
- **BB Fill Color** (default grey) — color of the shaded band.
- **BB Fill Transparency %** (default `85`) — how transparent the shading is (higher = more transparent/subtle).
## Visible-Range Fibonacci Retracement
This tool automatically scans the bars **currently visible on your screen** to find the highest high and the lowest low, then draws the standard Fibonacci retracement levels between them:
`0, 0.236, 0.382, 0.5, 0.618, 0.786, 1`
The retracement direction is auto-detected: if the low occurred before the high in the visible range, it's treated as an uptrend (levels retrace down from the high); otherwise it's treated as a downtrend (levels retrace up from the low). Each level is drawn as a horizontal line spanning the visible range, with an optional price label at the right edge showing the level ratio and its price.
**Inputs:**
- **Show Fib Retracement** — toggles the fib lines on/off.
- **Show Fib Price Labels** — toggles the price labels next to each fib line on/off.
**Important behavior to understand:** the lines update to reflect the highest high/lowest low of whatever range you're viewing when you scroll or zoom the chart, but Pine Script only allows a script to redraw on the arrival of new bar/tick data or when the chart is reloaded — not on every scroll/zoom gesture by itself. In practice this means the levels catch up shortly after you stop interacting with the chart (or on the next price update), rather than tracking your viewport in real time. Because of this, the tool is a **discretionary visual aid** meant for manual chart reading, not a deterministic signal — it should not be used as input to automated strategies or backtests, since its output depends on your current viewport rather than a fixed, reproducible calculation.
## How to use
- Use the grey BB fill as quick visual context for current volatility — a wide band suggests an expansive/volatile market, a narrow band suggests consolidation.
- Use the fib levels as an on-the-fly support/resistance reference for whatever swing high/low is currently in view — zoom or scroll to the price range you care about, let the chart refresh, and read the levels as potential reaction zones.
- Combine both: watch for price reacting near a fib level while inside or near the BB shaded zone for added confluence.
## Settings summary
| Input | Default | Description |
|---|---|---|
| BB Length | 20 | Number of bars for the SMA basis and standard deviation. |
| BB Source | close | Price series used for the Bollinger Bands calculation. |
| BB StdDev Multiplier | 2.0 | Multiplier applied to standard deviation to set band width. |
| BB Fill Color | grey | Color of the shaded area between the bands. |
| BB Fill Transparency (%) | 85 | Transparency of the BB shading. |
| Show Fib Retracement | true | Toggles drawing of the fib retracement lines. |
| Show Fib Price Labels | true | Toggles price labels next to each fib line. |
## Limitations
- The fib retracement only redraws when new bar/tick data arrives or the chart reloads — it does not update live as you scroll or zoom, due to a Pine Script platform limitation.
- Not intended for automated strategy logic or backtesting: the visible-range calculation is viewport-dependent and not deterministic across runs.
- The script keeps an internal history array of bar times/highs/lows that grows as the chart's loaded history grows, which can add a small amount of memory/processing overhead on very long chart histories.
---
Last updated (UTC): 2026-09-13 08:41:01 UTC
Индикатор

Market Maker BoxMarket Maker Box draws the last completed candle’s high and low as a live trading box, then colors that box for the candle that is forming now.
The idea is simple: market structure from the previous candle becomes the range you scalp this candle. Green means the forming candle is leaning up. Purple means it is leaning down. No color means chop — stand down.
Built for 5m and 15m charts so price prints inside the box, not beside it.
The boxes
Turn on the timeframes you want. They all run the same engine.
4H — on by default. Prior 4-hour high/low over the current 4-hour window.
Daily — prior day high/low over today.
9-day — prior 9-day high/low over the current 9-day window.
When a window closes, that box dies and a new one starts from the candle that just completed. The box grows with printed bars and stops a few candles past price so the live bar is readable.
How to read it
Color Meaning Destination
Neon green
Forming candle leaning bullish
Upper half — median to high
Neon purple
Forming candle leaning bearish
Lower half — low to median
Orange / TF tint
Chop. No call.
No shade
The shaded half is where price is predicted to go on that candle, not where you blindly click.
Labels show the level and how far price is from it, in percent.
Optional fibs (0.236 / 0.382 / 0.618 / 0.786) draw on every box you have turned on.
The lean
Trend first. A dip does not flip a green box purple.
EMA stack and slope on that box timeframe
The two candles before the box
A higher-timeframe completed body (daily helps 4H, 9-day helps daily)
Live candle can confirm the trend
Live candle cannot reverse the color unless a sweep-and-reclaim prints late in the window
ADX chop gate — no color in a dead tape
Color must hold a few chart bars before it paints
Stack the boxes. A green 4H inside a green daily is the clean scalp. Mixed colors means wait.
How to use it
Green box, price in the lower quarter → look long toward the median, then the high
Purple box, price in the upper quarter → look short toward the median, then the low
Price already in the destination half → you are late; wait for a pullback or the next box
Narrow grey box → range is too thin; fees eat the trade
Box-timeframe closes outside the range → the box is dead. That is continuation, not a fade
The box is the map. Your entry is still a reclaim, a rejection, or a limit at the level.
Defaults that stay clean
4H box on. Daily and 9-day off. Median on. Extra fibs off. Destination shade on. Break stamps off.
Add daily and 9-day when you want higher-timeframe context. Leave them off when you only want the session range.
Alerts
Off by default. Optional:
Price taps the box high or low
Confirmed 4H lean flips to bull or bear
What this is not
Not a signal bot. Not a guarantee the forming candle closes that color. Not financial advice.
The box tells you where you are and which way this window is leaning. You still pick the trigger and the size.
Pine v6 · © SRUS · Education and research only. Индикатор

Supertrend + Fibonacci OTE Grid & Bands [BigBeluga]🔵 OVERVIEW
The Supertrend + Fibonacci OTE Grid & Bands is an advanced technical analysis indicator designed by BigBeluga to combine trend-following Supertrend mechanics with dynamic Fibonacci retracement grids and volatility-based channel bands directly on the chart. Traditional Supertrend systems rely solely on stop lines, often missing optimal retracement zones (OTE) during trend pullbacks. To solve this limitation, this script integrates dual operating modes—anchored OTE grids that project Fibonacci levels across active trend swings, and continuous Fibonacci channel bands scaled by Average True Range (ATR).
The indicator visualizes trend direction, dynamic stop losses, shaded OTE zones, and proximity-highlighted grid levels. The core calculations track trend swings using customizable ATR lookbacks, compute proportional Fibonacci levels (0.0 to 1.0), and dynamically adjust line widths and colors when price approaches specific thresholds. Custom color palettes, bar/candle color toggles, and label configurations allow traders to fine-tune visual settings across various timeframes and asset classes.
🔵 HOW IT WORKS
The system operates through an integrated architecture where each component dynamically influences chart behavior:
1 — Supertrend Trend & Swing Engine
Stop Loss Line & Fills: Computes volatility-scaled Supertrend lines using ATR parameters, plotting colored stop-loss streams with gradient area fills.
Trend Extreme Tracking: Automatically tracks trend highs and lows upon trend direction flips to anchor structural Fibonacci calculations.
2 — Dual Fibonacci Modes (OTE Grid & Bands)
OTE Grid Mode: Projects an anchored Fibonacci retracement grid (0.0, 0.236, 0.382, 0.500, 0.618, 0.705, 0.786, 1.000) across the active trend swing, complete with a shaded Optimal Trade Entry (OTE) zone between the 0.618 and 0.786 levels.
Fibonacci Bands Mode: Plots continuous, ATR-scaled channel bands extending outward from the Supertrend line using proportional ratio offsets.
3 — Proximity Highlight & Styling Engine
Price Proximity Detection: Measures distance between price and individual grid levels using ATR multipliers to dynamically highlight active levels with distinct colors and thicker line widths.
Visual Customization: Supports bar and custom candle coloring by trend, adjustable line styles (Solid, Dotted, Dashed), and dynamic right-edge price labels.
🔵 HOW TO USE
Apart from serving as a comprehensive trend and retracement mapping tool, the indicator can be applied in several ways:
Follow Trend Momentum: Stay aligned with prevailing market direction by monitoring the Supertrend line color and trend-colored candles/bars.
Identify OTE Retracement Zones: In OTE Grid mode, monitor the shaded zone between the 0.618 and 0.786 Fibonacci levels for potential trend continuation entries during pullbacks.
Track Key Level Interactions: Watch for automatic color highlights and width changes on grid levels as price approaches critical Fibonacci thresholds.
🔵 SETTINGS
The indicator includes several customizable configuration groups to tailor calculations and visual styling to your trading style:
General Settings: Select between OTE Grid and Fibonacci Bands modes, toggle right-edge price/ratio labels, choose grid line styles (Solid, Dotted, Dashed), adjust grid highlight distance thresholds via ATR multipliers, and enable dimming for non-OTE levels.
Supertrend Parameters: Configure the ATR Period and Multiplier to adjust the sensitivity and distance of the core stop-loss line.
Fibonacci Bands Parameters: Define the ATR period and outer band multiplier specifically used when operating in Fibonacci Bands mode.
Main Styling & Colors: Set bullish and active price highlight colors, and toggle bar/candle coloring based on the active trend direction.
Fibonacci Level Settings: Enable or disable individual Fibonacci ratios (0.000, 0.236, 0.382, 0.500, 0.618, 0.705, 0.786, 1.000) and customize their individual display colors.
🔵 NOTES
Why this implementation is unique:
It merges classic Supertrend stop mechanics with both anchored OTE grids and continuous Fibonacci channel bands.
Features dynamic price proximity highlighting and custom linefill engines optimized for Pine Script version 6.
Provides extensive modular inputs for styling, level visibility, and operational mode switching.
Индикатор

JFX Structure FibJFX Structure Fib
ENGLISH
JFX Structure Fib is a multi-timeframe market-structure and automatic Fibonacci retracement framework designed for discretionary traders. It does not generate BUY/SELL signals or manage trades. Its purpose is to organize higher-timeframe directional context, confirmed chart-timeframe structure breaks, and retracement levels into one clean workflow.
HOW IT WORKS
1. Adaptive bias timeframe
By default, the script automatically assigns a higher bias timeframe according to the active chart timeframe. Examples include M5 -> H1 and M15 -> H4. A Custom mode is also available for users who prefer a different higher-timeframe relationship.
2. Confirmed higher-timeframe bias
The bias engine reads confirmed higher-timeframe structure. An optional Structure + EMA mode can require both structural direction and EMA alignment. The higher-timeframe values are based on completed higher-timeframe bars to reduce discrepancies between historical and realtime behavior.
3. Valid chart-timeframe BOS
The script displays only BOS events that meet its structural rules. A valid BOS requires a confirmed close through a confirmed swing that has not already been counted as broken, alignment with the active higher-timeframe bias, and a valid opposite structural swing after the broken swing to serve as the impulse origin.
4. BOS-origin impulse tracking
After a valid BOS, the script tracks the continuing impulse rather than fixing the Fibonacci endpoint immediately. The impulse extreme remains dynamic until price produces the configured confirmed retracement. This reduces arbitrary Fibonacci anchoring while an impulse is still extending.
5. Automatic Fibonacci lock
When the retracement threshold is confirmed, the impulse is locked and the script plots four configurable Fibonacci retracement levels. Defaults are 0.618, 0.705, 0.790, and 0.886. The chart displays ratio values only, without prices.
6. Fibonacci history
Completed or superseded Fibonacci structures can be retained as bounded historical references. Users can choose how many recent Fibonacci structures remain visible. Historical levels are visually muted so the active structure remains easy to identify.
7. Compact dashboard
The dashboard summarizes the chart-to-bias timeframe mapping, confirmed higher-timeframe bias, current structural direction, Fibonacci state, and retained Fibonacci history.
HOW TO USE IT
- Apply the indicator to the timeframe on which you want to analyze structure.
- Leave Bias timeframe mode on Auto for the default multi-timeframe mapping, or select Custom if your framework uses a different higher timeframe.
- A bullish or bearish BOS is displayed only when the script's validity conditions are satisfied.
- After the post-BOS impulse retraces by the configured lock threshold, the Fibonacci structure becomes fixed and its retracement levels are displayed.
- Use the Fibonacci levels as location/context within your own trading plan. The script intentionally does not define entries, stop losses, take profits, or expected performance.
KEY SETTINGS
- Bias timeframe mode: Auto or Custom.
- Bias method: Structure or Structure + EMA.
- Bias and chart-structure pivot sensitivity.
- Use newest valid BOS: allows a newer valid BOS to supersede the current structure.
- Structure invalidation: close or wick beyond the impulse origin.
- Fibonacci lock retracement.
- Four customizable Fibonacci ratios.
- Optional minimum impulse size measured in ATR.
- Fibonacci history count.
- Optional bias/chart swing reference levels.
- BOS, Fibonacci, dashboard, and alert visibility controls.
ORIGINALITY AND PROTECTED-SOURCE RATIONALE
BOS, market structure, and Fibonacci retracement are established concepts and are not claimed as original inventions. The original contribution of this script is the specific workflow and implementation that connects adaptive higher-timeframe bias, valid BOS filtering, post-break structural-origin selection, dynamic impulse tracking, confirmed retracement locking, bounded Fibonacci lifecycle/history, and a chart-focused visual state model. The source is protected to preserve this implementation while allowing the community to use the indicator freely.
LIMITATIONS
- Confirmed pivots require right-side bars before a swing is known. This means structure detection intentionally has confirmation delay.
- The higher-timeframe bias uses completed higher-timeframe information, so it will react more slowly than an indicator using an unfinished higher-timeframe candle.
- The automatic timeframe mapping is a practical default, not a universal rule. Different instruments or trading plans may require Custom mode.
- BOS validity depends on the selected pivot sensitivities. Very low settings can identify more minor structure; higher settings can identify fewer but broader swings.
- Fibonacci levels describe retracement location only. They do not establish that price will reverse from a level.
- The script does not calculate trade entries, stop losses, take profits, win rate, profit factor, or profitability.
- A newer valid BOS can replace the active structure when that option is enabled.
- Market behavior varies by instrument, timeframe, volatility regime, session, data feed, and execution environment.
Use the indicator as an analytical framework and validate its behavior on the instruments and timeframes relevant to your own process before relying on it for live decisions.
BAHASA INDONESIA
JFX Structure Fib adalah framework market structure multi-timeframe dan automatic Fibonacci retracement untuk discretionary trader. Indikator ini tidak memberikan sinyal BUY/SELL dan tidak mengatur posisi trading. Tujuannya adalah menyusun higher-timeframe bias, valid chart-timeframe BOS, dan retracement Fibonacci dalam satu workflow yang bersih dan mudah dibaca.
CARA KERJA
1. Adaptive bias timeframe
Secara default indikator memilih bias timeframe yang lebih tinggi berdasarkan timeframe chart aktif. Contohnya M5 -> H1 dan M15 -> H4. Mode Custom tetap tersedia jika pengguna ingin menggunakan hubungan timeframe yang berbeda.
2. Confirmed higher-timeframe bias
Bias membaca structure dari higher timeframe yang sudah confirmed. Mode Structure + EMA dapat digunakan untuk meminta alignment tambahan dari EMA. Data higher timeframe berasal dari candle yang sudah selesai agar perilaku historical dan realtime lebih konsisten.
3. Valid chart-timeframe BOS
Indikator hanya menampilkan BOS yang memenuhi aturan structure. BOS harus terjadi melalui confirmed close pada confirmed swing yang belum pernah dihitung sebagai broken, searah dengan higher-timeframe bias, serta memiliki opposite structural swing yang valid setelah swing yang di-break untuk menjadi origin impulse.
4. BOS-origin impulse tracking
Setelah valid BOS, indikator tetap mengikuti extreme impulse selama impulse masih berkembang. Endpoint Fibonacci belum langsung dikunci. Extreme baru dikunci setelah terjadi confirmed retracement sesuai threshold yang dipilih.
5. Automatic Fibonacci lock
Setelah retracement threshold terkonfirmasi, Fibonacci dikunci dan empat retracement level ditampilkan. Default: 0.618, 0.705, 0.790, dan 0.886. Chart hanya menampilkan angka ratio Fibonacci tanpa harga.
6. Fibonacci history
Fibonacci yang telah selesai atau digantikan dapat disimpan sebagai historical reference. Jumlah history dapat diatur oleh pengguna dan tampilannya dibuat lebih redup daripada Fibonacci aktif.
7. Compact dashboard
Dashboard menampilkan mapping chart timeframe ke bias timeframe, confirmed HTF bias, current structure, status Fibonacci, dan jumlah history yang sedang disimpan.
PENGGUNAAN
- Pasang indikator pada timeframe yang ingin digunakan untuk membaca structure.
- Gunakan Auto untuk mapping timeframe default, atau Custom jika menggunakan framework multi-timeframe sendiri.
- BOS bullish/bearish hanya muncul jika seluruh aturan validasinya terpenuhi.
- Setelah impulse pasca-BOS mengalami retracement sesuai threshold, Fibonacci dikunci dan level retracement ditampilkan.
- Gunakan Fibonacci sebagai area location/context dalam trading plan Anda sendiri. Indikator sengaja tidak menentukan entry, stop loss, take profit, atau ekspektasi hasil trading.
ORIGINALITAS DAN ALASAN SOURCE DILINDUNGI
BOS, market structure, dan Fibonacci retracement merupakan konsep yang sudah umum dan tidak diklaim sebagai penemuan baru. Nilai original script ini terletak pada workflow dan implementasinya: adaptive HTF bias, valid BOS filtering, pemilihan structural origin setelah break, dynamic impulse tracking, confirmed retracement lock, bounded Fibonacci history, serta visual state yang dibangun menjadi satu framework. Source dilindungi untuk menjaga implementasi tersebut sementara indikator tetap dapat digunakan gratis oleh komunitas.
KETERBATASAN
- Confirmed pivot membutuhkan sejumlah candle di sisi kanan sehingga swing diketahui dengan delay yang disengaja.
- Bias HTF menggunakan candle HTF yang sudah selesai sehingga lebih lambat dibandingkan metode yang membaca unfinished HTF candle.
- Auto timeframe mapping adalah default praktis dan bukan aturan universal.
- Sensitivitas BOS tergantung pada pivot settings yang digunakan.
- Fibonacci hanya menunjukkan lokasi retracement dan tidak menjamin reversal.
- Indikator tidak menghitung entry, SL, TP, win rate, Profit Factor, atau profitabilitas.
- Valid BOS yang lebih baru dapat menggantikan active structure jika opsi tersebut diaktifkan.
- Hasil visual dan perilaku structure dapat berbeda menurut instrument, timeframe, volatility regime, session, dan data feed.
Gunakan indikator sebagai analytical framework dan lakukan validasi pada instrument serta timeframe yang sesuai dengan proses trading Anda sebelum menggunakannya dalam keputusan live.
Индикатор

Fibonacci Cloud | Multi-Timeframe Fibonacci ScannerFibonacci Cloud stacks three independent retracement grids (short, medium, and long lookback windows) on top of each other and watches for the moments when price sits near multiple levels from multiple grids at once.
The idea is simple: a fib level that only shows up on one lookback length is easy to dismiss as coincidence, but a zone where the short-term 0.618 lines up with the medium-term 0.5 and the long-term 0.382 is a lot harder to ignore. The script counts how many of the fifteen tracked levels price is currently touching (within a configurable tolerance band) and only considers a trade when that confluence count clears your threshold.
From there, two optional filters can sharpen the signal further: an EMA trend filter (only take longs above the trend line, shorts below it) and an RSI momentum filter (skip longs when momentum is deeply negative, skip shorts when it's deeply positive). Both are off/loose by default so the confluence logic itself stays the star of the show — tighten them if you want fewer, higher-conviction trades.
Features
Three-lookback Fibonacci confluence engine (15 levels tracked simultaneously)
Adjustable confluence tolerance and minimum-overlap threshold
Optional EMA trend filter with clean directional fill
Optional RSI momentum filter (confirmation-style, not fade-style)
Long-only / short-only / both trade direction control
Fixed % stop-loss with configurable R:R take-profit
Minimal two-tone visual design — trend fill, soft confluence background tint, triangle entry markers
Built-in alert conditions for both long and short signals
Tips
Start loose (Min Confluent Levels = 1, wide tolerance) to see how many setups the confluence engine finds on your instrument, then tighten gradually rather than starting strict and wondering why trade count is low.
The three lookback lengths (default 20/50/100) are tunable — pairing a short scalping lookback with a much longer swing lookback tends to produce more meaningful confluence zones than three lookbacks bunched close together.
Try disabling the trend filter entirely on ranging instruments and re-enabling it on trending ones — this single toggle changes the strategy's character more than almost any other input.
Backtest the R:R and stop % together rather than in isolation; a looser confluence threshold usually pairs better with a tighter R:R target.
Warnings
This is a mean-reversion/confluence-zone tool, not a breakout system — it will underperform in strongly trending, low-pullback conditions.
Backtest results are historical and do not guarantee future performance. Past performance shown in the strategy tester does not account for slippage, liquidity gaps, or execution differences on your specific broker/exchange.
The looser default settings favor trade frequency over precision — verify the win rate and expectancy for your instrument and timeframe before trading it live.
This script is provided for research and educational purposes only and is not financial advice.
Стратегия

Fibonacci Gravity Clusters [GBB]Fib Gravity Clusters — Fibonacci confluence as a heatmap
The problem with Fibonacci retracements was never the ratios but the correct swing selection. Two traders, same chart, different anchor points, completely different levels and both will find "confirmation" for theirs. I wanted to take that choice away from myself.
So this script runs six ZigZag lines in parallel (pivot lengths 3, 8, 21, 55, 144, 377 by default, but they're configurable), keeps the last 13 legs of each, projects the usual retracement ratios from every single confirmed leg, and adds it all up into a density field on the price axis. Where lots of independent swings project into the same area, the chart glows. Where they don't, nothing.
THE BOOKKEEPING
Legs smaller than 0.5 ATR get thrown out because they're noise. Every surviving leg projects the enabled ratios (0.236 / 0.382 / 0.5 / 0.618 / 0.786, plus 0.886 if you want it). Each projected level drops heat into fine price bins, a quarter ATR tall, smeared with a small Gaussian kernel so neighboring projections merge into zones instead of producing a picket fence.
Not every projection counts the same:
- bigger swings contribute more (leg size in ATR, raised to a configurable exponent, capped at 8 so one monster leg can't drown everything else)
- old legs fade out with a half-life, default 144 bars. This matters more than it sounds — without decay the chart slowly fills up with structure the market stopped caring about weeks ago
- optional golden pocket mode adds 0.65 and gives the 0.618–0.65 area a 1.618x weight, if that's your thing
The field gets normalized, gamma-corrected and painted. Four palettes (Thermal, Ember, Ice, Mono) are selectable. The top 5 local peaks get a line and a label with the exact price and a hit count, so you can see how many raw projections actually built that zone. A ×14 zone and a ×3 zone are not the same thing even if they look similar in color.
There's also an optional HTF layer: the same field computed on Daily/Weekly/Monthly (auto-mapped from your chart TF, or fixed) and rendered behind the intraday one, dimmed, in its own palette. Built from closed HTF bars only. When an intraday hot band sits inside an HTF hot band, that's the most interesting picture this tool produces.
NON-REPAINTING
Everything is built from confirmed pivots. A level shows up once its pivot confirms which is N bars after the extreme, that's the nature of pivots and after that it doesn't move and doesn't disappear. HTF layer is lookahead_off, closed bars only. Alerts fire on bar close.
One exception: the Live Leg overlay. It projects ratios from the swing that's still forming. Dashed, labeled "forming", off by default, and it repaints by definition because the leg isn't finished. I left it in because it's occasionally useful context on fast timeframes. It is not a signal. If you turn it on and then complain about repainting, that one's on you.
ALERTS
Three of them: close enters a hot band, close enters an HTF hot band, and a new core zone forming in the top 5. Plus an optional visual flash on the touched band.
Индикатор

Optimal Trade Entry (OTE) Zone Plotter [algotim]Optimal Trade Entry (OTE) Zone Plotter locates the 62%-79% institutional retracement zone of a confirmed impulsive swing and keeps only the single most relevant zone per direction on the chart, fading it through disclosed mitigation states as price interacts with it.
Problem Statement
The Optimal Trade Entry concept, retracing into the 62%-79% region of an impulsive leg before continuation, is a well-known Fibonacci convention, but most public implementations simply plot every Fibonacci level on every swing they detect. This produces charts covered in overlapping retracement boxes, most of which come from insignificant swings that carry no real weight, and gives no visual indication of which zones are still fresh, already tested, or fully invalidated.
This indicator addresses that gap by filtering which swings are allowed to generate a zone in the first place, by showing only the current zone per direction at full strength, and by changing each zone's appearance as price actually interacts with it.
Methodology
Swing highs and lows are identified with ta.pivothigh/ta.pivotlow using a user-defined Pivot Length, so every swing referenced by the script is a confirmed pivot, evaluated only after barstate.isconfirmed is true.
Consecutive pivots of the same type extend a running swing extreme; a leg is only registered when the pivot type alternates (a low following a high, or a high following a low). Each candidate leg must then clear three disclosed checks before it is allowed to create a zone: the leg's price range must reach a minimum multiple of ATR, the swing candle's own body-to-range ratio must reach a minimum threshold, and, if the Break of Structure filter is enabled, the new swing must exceed the prior swing of the same type. Legs that fail any check produce no zone, no label, and no alert.
A qualifying leg generates one OTE zone: the shaded region between the 62% and 79% retracement of that leg, with the 70.5% level drawn as a two-layer glowing midline inside it. Only one bullish and one bearish zone are ever active at a time. When a new qualifying leg forms, the previous zone of that direction is frozen in place and, if enabled, kept as a single low-opacity historical reference rather than removed outright or left overlapping the new zone.
Each active zone tracks its own mitigation state on every confirmed bar: Fresh (untouched), Touched (price has wicked into the 62%-79% region), Mitigated (a confirmed close through the 79% boundary), or Invalidated (a confirmed close back through the leg's own origin point). State can only advance forward, and the zone's fill opacity and border color update automatically at each transition, so the chart communicates a zone's condition without any additional label or panel.
Signal Workflow
Step 1 — a confirmed swing pivot alternates direction, registering a candidate leg from the prior opposite pivot to the new one.
Step 2 — the leg is checked against the Minimum Swing Size, Body Ratio, and optional Break of Structure filters; legs that fail are discarded with no chart output.
Step 3 — a qualifying leg creates a new active OTE zone (62%-79%) with its 70.5% midline, and the previous zone of the same direction is frozen and faded.
Step 4 — the active zone's state advances from Fresh to Touched as price wicks into the zone on a confirmed bar.
Step 5 — the zone advances to Mitigated on a confirmed close through the 79% boundary, or to Invalidated on a confirmed close back through the leg's origin, at which point it is greyed out.
Step 6 — each transition and each zone entry/exit can trigger its own alert, gated by the corresponding toggle in the Alerts group.
Why This Indicator Is Different
Most public OTE/Fibonacci scripts draw a zone for every detected swing regardless of its significance, leaving multiple overlapping retracement boxes on the chart at once.
This script applies a disclosed three-part quality filter (ATR-relative swing size, swing candle body ratio, optional break-of-structure confirmation) before a swing is even allowed to generate a zone.
Only one zone per direction is ever shown at full strength; the prior zone automatically fades to a quiet historical reference the moment a new qualifying swing appears, keeping the chart focused on the current opportunity.
Zone fill opacity and border color are driven entirely by a four-state mitigation engine (Fresh/Touched/Mitigated/Invalidated) computed from confirmed price action against the zone's own boundaries, so the visual state of a zone is informative rather than purely decorative.
The 70.5% equilibrium level is rendered as a two-layer glow line rather than a plain dashed line, giving the zone's mid-point a distinct, non-generic appearance.
Inputs
Swing Detection
Pivot Length
ATR Length
OTE Quality Filter
Minimum Swing Size (x ATR)
Minimum Swing Candle Body Ratio
Require Break of Structure
OTE Zone
Show Bullish OTE Zones
Show Bearish OTE Zones
Zone Extension (bars)
Show Institutional Midline (70.5%)
Fade Previous Zone on New Swing
Visual Settings
Bullish/Bearish Zone Colour
Bullish/Bearish Midline Colour
Label Size
Alerts
Alert: New OTE Zone Created
Alert: Price Entered OTE Zone
Alert: Price Left OTE Zone
Alert: OTE Zone Mitigated
Alert: OTE Zone Invalidated
Alerts
Alerts are available for:
New Bullish/Bearish OTE Zone Created
Price Entered Bullish/Bearish OTE Zone
Price Left Bullish/Bearish OTE Zone
Bullish/Bearish OTE Zone Mitigated
Bullish/Bearish OTE Zone Invalidated
Practical Usage
Treat an active, Fresh OTE zone in the direction of the prevailing structure as a region to watch for a retracement entry, not a standalone entry signal by itself.
Use the Break of Structure filter on trending instruments to restrict zones to swings that genuinely extended structure, and disable it on ranging instruments where internal swings may still be meaningful.
Raise the Minimum Swing Size and Body Ratio filters on lower timeframes or noisy instruments to reduce the number of zones generated.
Watch the zone's fill opacity as a quick visual read of its condition: a bold zone has not been tested, a lighter fill has already been touched or mitigated, and a greyed zone has been invalidated and should generally be disregarded.
Combine the Entered/Exited alerts with your own confirmation criteria (candlestick behavior, lower-timeframe structure, etc.) rather than treating zone entry alone as a trigger.
Limitations
Swing pivots require bars to form on both sides before they confirm, so every zone is inherently placed a Pivot Length number of bars after the actual swing extreme occurred.
The quality filter reduces the number of zones shown but does not evaluate or predict the outcome of any individual retracement.
Only one active zone per direction is displayed at a time; if you want to review multiple historical zones simultaneously, enable "Fade Previous Zone on New Swing" and note that only the single most recent prior zone is retained, not a full history.
As with any retracement-based tool, results will vary across instruments, timeframes, and market regimes.
Notes
This indicator is a zone-location tool intended to highlight the current, quality-filtered Optimal Trade Entry region and its mitigation state through a disclosed, rule-based process.
All swing confirmations, zone creation, mitigation-state transitions, and invalidations are evaluated on confirmed bar closes only, so no element of the script repaints once drawn.
The output is intended to support retracement-based analysis and is not a standalone buy or sell recommendation. Индикатор

Fibonacci Retracement Depth & Retest Grid - Swing High LowOVERVIEW
Fibonacci Retracement Depth & Retest Grid - Swing High Low is an open-source chart overlay for measuring retracement depth inside an automatically selected price leg.
The script combines an automatic right-confirmed swing engine, a bounded local-range fallback, optional manual-origin control, rolling-range analysis, configurable Fibonacci ratios, distinct touch-episode tracking, fixed-horizon response measurements, larger-range ratio proximity, factual alerts, and a compact context readout.
It is a descriptive research tool. It does not generate entries, exits, targets, stops, position sizes, probability estimates, win rates, or performance claims. It does not use artificial intelligence, machine learning, external datasets, or third-party libraries.
CORE FIBONACCI CALCULATION
For an active origin and terminal, each level is calculated as:
level = terminal + (origin - terminal) * ratio
The terminal anchor is 0%, and the origin anchor is 100%.
Current retracement depth is calculated as:
depth = (reference price - terminal) / (origin - terminal)
This produces the same interpretation for upward and downward legs:
- 0% means price is at the terminal anchor.
- 100% means price is at the origin anchor.
- A value below 0% means price has moved beyond the terminal.
- A value above 100% means price has moved beyond the origin.
The current-depth cursor displays the actual calculated value. Its chart position is bounded between the two anchors so that an extreme value does not distort the visible layout.
ANCHOR ENGINES
The script provides three anchor engines.
1. Automatic swing
Automatic swing is the default.
The engine detects pivot highs and lows from either wicks or closing prices. A pivot is accepted only after the configured number of right-side bars has closed. Accepted pivots must alternate between high and low.
A new opposite-side pivot must satisfy:
- Minimum spacing in chart bars.
- A non-zero price distance.
- An optional minimum leg size expressed in ATR.
A later pivot of the same type can revise the active terminal only when it is more extreme by at least the configured minimum-tick threshold. This reduces small live revisions and visual flicker.
When a complete confirmed pivot pair is not yet available, the script uses a bounded local high-low range so the chart does not remain blank. The default local window is 120 finalized bars. The fallback is replaced automatically when a valid confirmed swing pair becomes available.
2. Manual origin
Manual origin is an explicit optional mode.
The user selects a paired time-and-price point as the structural origin. The script then searches after that point for the most extreme valid terminal in the selected direction.
Direction can be:
- Auto from point
- Up leg
- Down leg
The origin price can snap to the selected bar or preserve the exact selected price. By default, the terminal uses closed bars only to reduce intrabar movement of the complete Fibonacci structure.
Manual origin does not silently fall back to an automatic structure. If the selected point or terminal is invalid, no manual grid is displayed until the point or settings are corrected.
3. Rolling range
Rolling range uses the highest and lowest selected source values inside a fixed lookback. The chronological order of the two extremes determines whether the leg is upward or downward.
A minimum span in bars is required between the extremes. The anchors can change as the lookback advances, so current-structure statistics reset whenever the active pair changes.
CONFIRMATION AND HISTORICAL PLACEMENT
In Automatic swing mode, an H or L marker is placed at the historical pivot bar after that pivot becomes confirmed.
The diagonal anchor leg connects the actual origin and terminal bars. However, the horizontal Fibonacci levels do not begin before the complete structure became available to the script. They begin from the availability point rather than being extended backward through bars where the completed pair was not yet knowable.
This distinction is intentional:
- The anchor marker shows where the pivot occurred.
- The level start shows when the active structure became available.
A marker on a historical pivot bar should not be interpreted as evidence that the pivot was known on that original bar.
If a high pivot and low pivot are both confirmed from the same chart bar, finalized OHLC data cannot prove which extreme occurred first inside that bar. When a previous terminal type exists, the engine prefers the opposite candidate to preserve alternation. It does not invent an intrabar order that the available data cannot establish.
PAST-CHART STUDY
When Use visible right edge in past charts is enabled and the chart is scrolled away from the latest bar, the visible right edge becomes the study endpoint.
Inside the configurable local window, the script first looks for a recent accepted confirmed swing. If a suitable pair is not available, it uses a bounded local high-low range ending at the visible right edge.
This prevents historical study from automatically expanding to the absolute high and low of an excessively large viewport.
Past-chart auto-follow is retrospective. The completed visible period is already known. Therefore:
- Sequential touch-response statistics are disabled.
- Price-event alerts are disabled.
- The readout changes from Response to Study.
For chronology-sensitive historical testing, use Automatic swing with TradingView Bar Replay. Pivots will become available only after the configured right-side confirmation bars.
CONFIGURABLE FIBONACCI LEVELS
The script contains ten independently editable ratio slots.
The default enabled ratios are:
- 0.000
- 0.236
- 0.382
- 0.500
- 0.618
- 0.786
- 1.000
The following ratios are available but disabled by default:
- 0.650
- 0.705
- 0.886
Each slot can be enabled, disabled, or changed. Inputs accept values from -2.000 to 3.000, allowing custom retracement or extension research.
The script does not assume that a custom ratio is predictive or statistically significant.
DEPTH BANDS
Three optional visual bands organize the interior of the active retracement.
By default, they represent:
- 38.2% to 50.0%
- 50.0% to 61.8%
- 61.8% to 78.6%
The bands are built from configurable ratio slots. Changing those inputs changes the corresponding band boundaries.
The readout classifies proportional location as:
- Shallow
- Mid
- Deep
- T+ for beyond the terminal
- O+ for beyond the origin
These labels describe location only. They do not describe trade quality or reversal probability.
DISTINCT TOUCH EPISODES
Reaction research is available for enabled interior ratios greater than 0 and less than 1.
A level is contacted when the bar range intersects the configured tolerance around that price. Tolerance can be defined using:
- ATR
- A percentage of the active leg
- Minimum ticks
The script does not count every consecutive bar near a level as a separate reaction.
After an initial touch, price must move completely outside the wider re-arm envelope before another touch can be counted. This separates repeated contact into distinct touch episodes and reduces inflated counts caused by several bars remaining near the same price.
The latest counted touch for each level can be marked on the chart.
Touch statistics belong only to the current active anchor structure. They reset whenever the active origin or terminal changes.
FIXED-HORIZON RESPONSE RESEARCH
Each new touch episode creates an independent pending measurement.
After the configured number of chart bars has elapsed, the script measures the closing price relative to the touched level and normalizes the result by the active leg size.
The sign is aligned with the active leg direction:
- A positive response means the horizon close moved toward the terminal direction.
- A negative response means the horizon close moved toward the origin direction.
The readout uses:
- T for counted touch episodes.
- R for completed fixed-horizon measurements.
The displayed average is the arithmetic mean of completed measurements for the nearest enabled ratio within the current active structure.
This measurement is not:
- A bounce rate.
- A support or resistance score.
- Maximum favorable excursion.
- Maximum adverse excursion.
- A win rate.
- A probability estimate.
- A strategy result.
If the active anchors change before a pending response reaches its horizon, that pending measurement is discarded with the other statistics from the previous structure.
LARGER-RANGE RATIO PROXIMITY
The script can calculate a second Fibonacci structure from a longer rolling high-low range.
Each enabled primary level is compared with every enabled level in the larger-range structure. Proximity tolerance can be defined using:
- ATR
- A percentage of the primary leg
- Minimum ticks
When a primary level is sufficiently close to a larger-range ratio:
- Its line is highlighted.
- Its line width is increased.
- A diamond is added to its label.
This is a distance comparison only. It does not mean that the level is stronger, that price will reverse, or that the level will hold.
VISUAL OUTPUT
The default visual structure includes:
- A directional origin-to-terminal anchor leg.
- H and L anchor markers.
- Configurable Fibonacci level lines.
- Ratio and price labels.
- Three optional depth bands.
- A current-depth cursor.
- Latest-touch markers.
- Larger-range proximity diamonds.
- A compact bold context readout.
The readout summarizes:
- Active anchor engine and leg span.
- Current retracement depth.
- Nearest enabled level and ATR-normalized distance.
- Touch and response information, or historical study scope.
- Larger-range proximity and event-timing context.
Detailed explanations are available through cell and label tooltips so the visible panel can remain concise.
The readout also reserves a transparent horizontal edge-clearance lane. This keeps TradingView High/Low labels and price-scale markers visible when the panel is placed at a chart edge. The default clearance is 6% and can be adjusted in Settings.
Colors, line style, line widths, label content, label size, table position, table size, edge clearance, band opacity, and individual ratios are configurable.
ALERTS
The script provides factual alert conditions for:
- New confirmed Fibonacci swing structure
- Confirmed Fibonacci terminal revision
- Fibonacci level touch episode
- Core Fibonacci band entered
- Fibonacci origin crossed
- Fibonacci terminal crossed
The core band is defined by the Ratio 4 and Ratio 5 inputs.
Dynamic touch alerts are also available. When enabled, create a TradingView alert using Any alert() function call. The message reports the touched ratios, symbol, chart timeframe, and current close.
Confirmed-bar event evaluation is enabled by default.
Past-chart retrospective mode does not generate these price-event alerts.
Alerts report observed chart events only. They are not trade recommendations.
SUGGESTED WORKFLOWS
For current-market observation:
1. Keep Anchor engine on Automatic swing.
2. Keep Evaluate events on confirmed bars only enabled.
3. Select Wicks or Closes according to the research definition.
4. Adjust pivot left and right bars to control swing sensitivity.
5. Use Minimum leg ATR and Minimum bars between alternating pivots to reduce minor structures.
6. Use Automatic local window bars to control the warm-up and historical fallback horizon.
7. Read current depth and responses as descriptive context, not as an entry instruction.
For chronology-sensitive historical study:
1. Keep Anchor engine on Automatic swing.
2. Start TradingView Bar Replay before the period being studied.
3. Advance one bar at a time or at a controlled speed.
4. Observe when pivots become confirmed and when the Fibonacci grid becomes available.
5. Review touch episodes and completed fixed-horizon responses as replay advances.
For fast retrospective study:
1. Keep Use visible right edge in past charts enabled.
2. Scroll to the historical period.
3. Adjust the chart so the desired local structure is near the visible right edge.
4. Adjust Automatic local window bars if more or less structural context is required.
5. Review the Past swing or Past range readout state.
For a user-defined structural start:
1. Select Manual origin.
2. Set or reset the paired Origin point.
3. Choose Auto from point, Up leg, or Down leg.
4. Choose whether to snap to the selected bar or use the exact selected price.
5. Keep closed-bar terminal updates enabled for the more stable live behavior.
For an objective fixed-window range:
1. Select Rolling range.
2. Set the desired lookback.
3. Increase Minimum range span bars when short high-low pairs create excessive changes.
WHAT MAKES THIS IMPLEMENTATION DISTINCT
Fibonacci ratios and arithmetic retracement geometry are established public concepts. This script does not claim ownership of them.
Its distinct implementation choices include:
- Separation of historical pivot location from the later time when the structure becomes available.
- Availability-gated horizontal levels rather than unrestricted backward extension.
- Automatic confirmed-swing selection with a bounded finalized-bar warm-up fallback.
- Local past-chart auto-follow that avoids forcing the absolute extremes of a large viewport.
- Optional manual-origin and rolling-range engines in the same open implementation.
- Minimum spacing, ATR size, range-span, and tick-based terminal-revision filters.
- Distinct touch episodes controlled by a re-arm envelope.
- Independent fixed-horizon measurements normalized by active leg size.
- Direction-aligned descriptive responses rather than predictive bounce scores.
- Larger-range ratio proximity with configurable tolerance.
- Explicit separation of live, Bar Replay, and retrospective chart study.
- Compact tooltips and an edge-clearance lane designed to preserve chart-label visibility.
- Factual alerts without entries, exits, or performance claims.
The implementation uses conventional Fibonacci arithmetic and Pine Script built-ins. It does not import another author's library, reproduce a paper-specific model, request outside-market data, or present a proprietary trading methodology.
LIMITATIONS
- Fibonacci levels are proportional reference levels. They do not guarantee support, resistance, reversal, continuation, or any other future outcome.
- Confirmed pivots require right-side bars, so recognition necessarily occurs after the pivot bar.
- The active terminal can be revised when a later confirmed same-side pivot exceeds it by the configured threshold.
- During automatic warm-up, the bounded local-range fallback can change as finalized bars change until a confirmed pivot pair becomes available.
- The script displays one active Fibonacci structure rather than a permanent archive of every historical grid.
- Rolling range changes as its lookback advances and can reset all current-structure statistics.
- Past-chart auto-follow is retrospective and changes when the visible right edge or local-window setting changes.
- Finalized OHLC bars do not reveal the sequence of price movement inside each bar.
- If one bar intersects several levels, each level can be recorded, but their exact intrabar order is unknown.
- If confirmed-bar evaluation is disabled, realtime event states can change before the bar closes. Reloaded historical bars contain finalized OHLC, not the original realtime tick sequence.
- The calculation uses the chart's current symbol, timeframe, session, and price series. It does not request higher-timeframe or external-market data.
- Results depend on the history supplied by TradingView and the selected data provider.
- The Fibonacci calculation is arithmetic in price. Changing the chart to logarithmic scale changes visual spacing but does not change the underlying formula.
- Heikin-Ashi, Renko, Kagi, Line Break, and other non-standard charts can contain synthetic prices. Use standard candles when actual traded-price geometry is required.
- ATR-normalized filters and distances depend on the selected symbol and timeframe.
- Custom ratios can be duplicated, reordered, or placed outside the 0-to-1 interval. Users are responsible for interpreting custom configurations.
- Default settings are general research starting points. They are not optimized for any instrument, timeframe, market, or outcome.
- This is an indicator, not a strategy or backtest engine.
- Nothing displayed by the script constitutes financial or investment advice.
OPEN-SOURCE NOTE
The source is published under the Mozilla Public License 2.0 so users can inspect, verify, modify, and study the implementation.
The script is intended to support transparent chart research without hidden calculations, restricted access, or performance promises. Индикатор

Fibonacci Path Profile [MantisAlgo]Fibonacci Path Profile is a historical swing-path analysis tool that compares the active market structure with similar Fibonacci swing patterns from the past and visualizes the historical distribution of the next D and E swing points.
The indicator combines the current A→B impulse, B→C retracement or extension, and live C→Now progress to continuously refine the historical sample.
🟢 ABC STRUCTURE
The indicator automatically detects alternating swing highs and swing lows and organizes them into an A-B-C structure.
Bullish ABC
A→B = upward impulse
B→C = downward retracement
The next D swing develops upward from C
Bearish ABC
A→B = downward impulse
B→C = upward retracement
The next D swing develops downward from C
A→B is used as the base swing for all subsequent Fibonacci measurements.
🟢 FIBONACCI MATCHING
The B→C movement is measured relative to the A→B impulse:
B→C Ratio = |B − C| / |A − B|
Historical cases are matched using:
Bullish or Bearish ABC direction
B→C Fibonacci range
Live C→Now progress
The B→C ranges are:
0–23.6%
23.6–38.2%
38.2–50%
50–61.8%
61.8–78.6%
78.6–100%
100–127.2%
127.2–161.8%
161.8%+
Up to 100% is classified as a Retrace, while values above 100% are classified as an Extension.
* To preserve a usable historical sample, all B→C values above 161.8% are grouped into a single 161.8%+ matching range rather than being divided into additional extension classes.
🟢 LIVE C→NOW MATCHING
The indicator also measures how far the active move has progressed from C relative to the B→C range.
C→Now = current progress from C relative to |B − C|
As price develops, this progress is used to filter historical cases that remained valid through a similar stage of the move.
🟢 D & E PATH
The profiles show the historical locations of the next two swing points:
D PathDistribution of the next swing point after C.
E PathDistribution of the following swing point after D.
Both D and E locations are normalized relative to the B→C range, allowing historical structures of different absolute sizes to be compared on the same basis.
The E Path is also separated into three structural outcomes:
🟥 B Break — E moves beyond the B level
🟨 No Break — E remains between B and C
🟦 C Break — E moves beyond the C level
The displayed percentages represent the weighted share of each outcome among the currently matched historical cases.
* For the D and E profiles, values beyond the displayed ±161.8% range are grouped into the outermost top or bottom bin rather than split into additional bins.
🟢 REAL-TIME PROFILE
The active profile is continuously recalculated as price develops.
This can update:
C→Now progress
matched historical cases
D Path distribution
E Path distribution
B Break / No Break / C Break probabilities
Because D and E represent the active forward path, both profile boxes are always displayed to the right of the current candle.
🟢 DYNAMIC C
Before a new D swing is confirmed, the B→C retracement may continue to a new extreme.
In that case, the active C point is updated:
Bullish ABC → C moves to a new lower low
Bearish ABC → C moves to a new higher high
This prevents an unfinished B→C leg from being treated as a completed swing.
🟢 WEIGHT
Two weighting methods are available:
Recent
More recent historical cases receive greater weight.
Weight = 1 / (1 + Age / 1500)
where Age is measured in bars.
Equal
Every matched historical case receives the same weight.
Use Recent to emphasize newer market behavior or Equal to view the unweighted historical distribution.
🟢 HOW TO USE
Use the indicator to evaluate how similar historical structures developed from the current setup.
D Path highlights where the next swing historically tended to form.
E Path shows how price developed after that D swing.
B Break / No Break / C Break summarizes the historical structural outcome.
C→Now continuously refines the sample as the active move progresses.
The profiles represent historical swing distributions, not traded volume.
They are designed to provide a probabilistic view of the active structure rather than a fixed Fibonacci price target.
🟢 DISCLAIMER
This indicator is provided for informational and educational purposes only and does not constitute financial or investment advice.
Historical patterns and probabilities do not guarantee future results. All trading and investment decisions remain the sole responsibility of the user. Индикатор

Auto Fibonacci AI - Level Respect Statistics [Dots3Red]📐 AUTO FIBONACCI AI - LEVEL RESPECT STATISTICS
Fibonacci retracement is one of the most widely used tools in trading. It is also one of the least verified. "The 0.618 is the golden pocket" gets repeated everywhere and tested nowhere. This script keeps score — not universally, but specifically for the chart you are actually looking at.
✨ WHY THIS IS DIFFERENT
Every other Fibonacci tool draws the levels and stops there. Whether those levels actually work on this instrument, this timeframe, this market condition is left entirely to assumption. This script treats that as a question worth answering. Every touch of every level is graded: did price reject cleanly, or push through? The results accumulate directly in each level's label:
📊 0.618 | 71% bounced (n=24)
That means: on this chart, at this timeframe, price has touched the 0.618 level 24 times across all the swings this script has processed. 71% of those touches resulted in a genuine rejection. 29% broke through. That is a real measurement, not a theoretical assumption.
⚙️ HOW IT WORKS
📐 Auto swing detection — the script identifies the most recent confirmed pivot high and pivot low using a configurable lookback. A minimum swing size filter (in ATR units) rejects small, noisy movements — only swings that represent genuine market structure anchor the Fibonacci grid. Swings are confirmed only on closed bars, so the anchor never changes retroactively.
📏 Retracement levels — the standard five levels are drawn from the detected swing: 0.236, 0.382, 0.500, 0.618, and 0.786. The 0.618 is highlighted in amber since it receives the most attention from traders and institutions. Each level accumulates its own separate statistics.
🎯 Touch grading — every time price approaches a level within a configurable tolerance, a touch is recorded and enters a pending state. Within the outcome window (configurable bars), it resolves as one of three outcomes:
• Bounce — price moved cleanly away from the level without breaking it
• Break — price closed convincingly through the level
• Timeout — neither happened clearly enough to call; counted as a touch but not a bounce or break
Each resolved touch feeds into that level's cumulative percentage — and the labels update to show the live result.
🟢 Extension targets — when price breaks past the swing's extreme (not just retracing to it but genuinely continuing through), the script activates two extension targets: 1.272 and 1.618. These are the levels most commonly used as continuation targets after a structural break. Each is tracked in its own way: did price actually reach 1.272 after the break? 1.618? Over time, the extension labels show:
📊 1.272 | hit 64% (n=11)
📊 1.618 | hit 41% (n=11)
That's a concrete answer to "how far does price usually go when it breaks the swing?" — specific to this chart, not assumed from theory.
🔒 Non-repainting — pivots only confirm after the required bars on each side have closed. The swing anchor only updates when a new qualifying pivot is confirmed. Grading only happens on confirmed bars. The levels and statistics reflect what actually happened, not what the current bar is doing in real time.
🧭 HOW TO USE
1️⃣ Let the sample size build before trusting the percentages. A level that shows "0% bounced (n=2)" is meaningless — two touches is noise. The labels deliberately show the N= count so you can judge reliability yourself. A consistent reading across 15+ touches is worth paying attention to; 3-5 touches is still developing.
2️⃣ Compare across levels. If 0.382 shows 40% bounced on this chart while 0.618 shows 74% bounced, that's telling you something specific about which pullback depth this market tends to respect. That difference is invisible to a plain Fibonacci tool.
3️⃣ Use extension hit rates for target selection. If 1.272 has been reached in 64% of breakout cases but 1.618 only in 41%, the first extension is the more realistic target on this chart — and the second, while possible, has historically been hit less than half the time. This is not a rule; it is an observation about past behavior on this specific chart.
4️⃣ Adjust settings to the timeframe. The defaults (pivot leg 8, minimum swing 3× ATR) are calibrated for mid-range timeframes — 15-minute through 4-hour — where Fibonacci retracement is most actively watched by swing traders and where enough swings complete regularly to build meaningful sample counts. On faster timeframes, reduce both settings so smaller swings qualify. On slower ones, increase them to filter noise.
5️⃣ The statistics describe the past, not the future. A high bounce rate at 0.618 means price has historically respected this level on this chart. It is not a promise that the current touch will also bounce. Use the percentages as context — one input among many — not as an automatic signal.
🛠️ SETTINGS
📐 Swing Detection
• Pivot Leg — bars required on each side to confirm a swing pivot
• Min Swing Size — smallest qualifying swing in ATR units; filters out noise
🎯 Level Grading
• Touch Tolerance — how close price must come to a level to count as a touch
• Break Buffer — how far past a level close must clear to grade as a break
• Bounce Distance — how far price must move away, cleanly, to grade as a bounce
• Outcome Window — bars allowed for a touch to resolve
• Extension Window — bars allowed for an extension target to be reached after a break
🎨 Visualization
• Show Extension Targets — toggle the 1.272 / 1.618 green lines
• Per-Level Stat Labels — toggle the bounce-rate text on each level
🖥️ Dashboard
• Show / hide, position — swing direction and per-level bounce rates in a compact table
📝 NOTES
The script tracks one active Fibonacci grid at a time — the most recent qualifying swing. When a new swing confirms, the grid shifts and per-level statistics carry forward from all previous swings on the chart. The statistics are global across all swings processed since the indicator was added to the chart, not per-swing.
Statistics are most meaningful on timeframes where Fibonacci retracement is genuinely watched and defended by real market participants — typically 15-minute through 4-hour. Very short timeframes will accumulate sample counts quickly but the measurements may reflect microstructure noise rather than true level respect. Very long timeframes will take extended real-world time to build enough data to be informative.
⚠️ DISCLAIMER
This is an analytical and visualization tool. It does not generate trade signals and does not constitute financial advice. Historical bounce and hit rates do not guarantee how price will behave at any specific future level touch. Индикатор

Fibonacci Trend Continuation Signals [AlgoAlpha]🟠 OVERVIEW
Fibonacci Trend Continuation Signals maps Fibonacci retracement levels inside an adaptive trend structure. It combines a smoothed price midline, volatility-based outer bands, and Fibonacci ratios to show where price is trading within the current bullish or bearish trend range.
The trend changes only when price moves beyond a volatility-adjusted outer band. Once a direction is active, the script projects 0.236, 0.382, 0.500, 0.618, and 0.786 levels between the active outer band and the midline. This creates a moving Fibonacci framework that adjusts as price and volatility change.
Continuation signals appear when price closes back through an enabled Fibonacci level in the direction of the active trend. This lets traders use retracements within an established trend instead of treating each Fibonacci level as a fixed reversal point.
🟠 CONCEPTS
Trend Midline — An exponential moving average of closing price. It forms the central reference for the trend structure and the endpoint of the Fibonacci range.
Volatility Bands — Outer boundaries placed above and below the midline using a smoothed measure of the high-to-low price range. Price crossing an outer band changes the active trend direction.
Fibonacci Trend Range — The distance between the active outer band and the midline. In bullish trends, levels are measured upward from the lower band. In bearish trends, they are measured downward from the upper band.
Fibonacci Levels — The 0.236, 0.382, 0.500, 0.618, and 0.786 ratios divide the active trend range into retracement zones that move with the underlying trend structure.
Continuation Signal — A bullish signal occurs when price closes upward through an enabled Fibonacci level during a bullish trend. A bearish signal occurs when price closes downward through an enabled Fibonacci level during a bearish trend.
🟠 FEATURES
Adaptive Fibonacci Profile — Displays five configurable Fibonacci levels between the active volatility band and trend midline.
Trend Continuation Signals — Shows bullish and bearish markers when price closes through an enabled Fibonacci level in the direction of the active trend.
Current Level Labels — Shows the current price value of each enabled Fibonacci level at the latest bar.
Trend Change Markers — Marks the Fibonacci structure when a new bullish or bearish trend begins.
🟠 HOW TO USE
Identify the active trend structure — A bullish structure projects Fibonacci levels from the lower band toward the midline, while a bearish structure projects them from the upper band toward the midline.
Watch price during a retracement — Use the displayed Fibonacci zones to see how far price has moved through the active trend range.
Look for continuation signals — An upward triangle shows that price crossed above an enabled Fibonacci level during a bullish trend. A downward triangle shows the equivalent bearish close below a level.
Compare signals with price structure — Use nearby swing points, support, resistance, or your existing confirmation method before acting on a continuation signal.
Adjust Midline Length, Pivot Length, and Band Width to control how quickly the trend framework responds to price and how wide its outer boundaries are.
Enable or disable individual Fibonacci levels to keep only the retracement levels relevant to your method.
🟠 CONCLUSION
Fibonacci Trend Continuation Signals combines volatility-based trend detection with adaptive Fibonacci retracement levels and directional continuation signals. It gives traders a moving reference for measuring pullbacks and identifying closes that resume movement in the active trend direction. Индикатор

Auto Fibonacci Retracement, Golden Zone & OTE Levels [LunqFX]Every fibonacci retracement tool draws the same six lines, and every one of them assumes you already picked the right swing. Drag the fib from a different high and the golden pocket lands somewhere else entirely — so the fibonacci level you are about to buy is not a level the market chose, it is a level your cursor chose.
This auto fibonacci indicator takes the swing out of your hands. The leg is anchored to confirmed pivots and re-anchors itself the moment structure makes a new extreme, so the fib retracement on the chart is always drawn from the leg the market is actually trading, and the golden pocket and OTE zone sit where that leg puts them.
And it adds the number no fibonacci retracement indicator has ever given you: how deep this symbol actually retraces.
Included: automatic fibonacci retracement from confirmed swing pivots, an adjustable golden pocket and OTE zone filled on the chart, fibonacci extension targets beyond the leg, gold candles on the bars that traded inside the zone, a measured typical retracement depth for the current symbol, a dashboard reading the live fib retracement, and alerts on the zone.
❶ HOW THE FIBONACCI IS ANCHORED
Swing points come from confirmed pivots, so a leg only exists once the bars on both sides of its pivot have closed. Nothing appears and then vanishes.
The active leg runs from the anchor pivot to the extreme pivot. A new pivot beyond the extreme, in the same direction, extends the leg — the fibonacci retracement stretches with it. A pivot the other way flips the leg and the fib re-anchors to the new one. There is no setting for "which high to use", because the structure decides.
❷ THE GOLDEN POCKET AND THE OTE ZONE
The band between 0.618 and 0.786 is filled, with a soft halo behind it so it reads at a glance on a crowded chart. Smart money traders call this band the OTE — the Optimal Trade Entry — and it is where continuation entries are taken after a pullback, because it is deep enough that the move is discounted and shallow enough that the leg is still intact.
The golden pocket, the narrow 0.618–0.65 strip, sits along the top edge of that band. Both edges are adjustable, so set them to 0.618 and 0.65 if the pocket alone is what you trade, or to 0.5–0.618 if that is your definition of the golden zone. The whole tool follows whatever you set — the depth statistics, the dashboard and the alerts all read from the same two numbers.
❸ EXTENSIONS
Three projections beyond the leg, negative fib values by default at −0.272, −0.618 and −1.0. They are drawn from the same anchors as the retracement, so a target is measured against the same swing the entry came from rather than against a fib you dragged separately.
They ship switched off. A target at −1.0 sits far enough from price that the chart's autoscale stretches to include it and squashes the candles into a band — useful once you are in a trade, in the way while you are reading the chart. Switch them on in the Extensions section when you need them.
❹ A SPENT LEG STOPS SHOUTING
When price trades all the way through the anchor, the leg has done everything it was going to do. The fib cannot re-anchor until the next pivot confirms, so in the meantime the whole drawing fades: the levels dim, the golden zone loses its glow and its label reads spent.
It is a small thing that most tools get wrong. A fib left burning at full brightness over a setup that is already finished is not neutral — it is the chart arguing for a trade that is no longer there.
❺ TYPICAL RETRACEMENT DEPTH — what a fibonacci tool never shows
0.618 is a number from a sequence. It is not a fact about gold, or about the euro, or about this timeframe.
So the indicator measures it. Every time a leg pulls back and then makes a new extreme in the same direction, the depth of that pullback is recorded. The average of those depths is printed on the chart as its own line, and in the panel with the sample size behind it:
Typical depth 0.547 (23 legs)
Read it against the golden zone. When the measured depth sits at 0.55 and the golden zone starts at 0.618, this symbol has been turning BEFORE the golden zone — waiting for 0.618 means the move leaves without you. When it sits at 0.72, shallow entries at 0.5 have been getting run over.
Only pullbacks that were followed by continuation are counted. A leg that reversed outright is not a retracement, and folding those in is how a depth average gets quietly inflated past anything useful. Samples under eight legs are marked with a tilde, because an average of three is not an average.
❻ THE CHART ITSELF
Every candle stands in a soft lit column — an aura drawn behind it, its body stretched across the full range and left almost transparent with its outline switched off. The effect is a neon tube rather than a coloured rectangle.
The glow is not constant. Its brightness is driven by the bar's range against ATR, so a conviction candle burns and a doji barely registers. Strength becomes something you feel across a screen of price action instead of something you measure bar by bar, and the decoration is carrying information rather than existing for its own sake.
The candle on top has a translucent body against a solid outline. That one detail is what makes it read as part of the chart instead of a sticker placed over it: the background shows faintly through while the edge stays crisp.
Five palettes, because one set of colours cannot suit every background. Neon Bloom is turquoise against magenta, a matched pair that leaves gold free for the zone. Midnight Cyan is the common signature dark scheme, Vibrant Neon the high-contrast crypto pairing, Classic Soft the muted everyday version. Cool Blue drops red entirely — a number of full-time traders run blue against grey, since red carries a stress response that gets in the way of reading a chart objectively for eight hours at a stretch.
Bars of the current leg that closed inside the golden zone are drawn in gold, so the OTE is visible in the price action and not only in the band behind it. Only the current leg is marked — a highlight left over from a leg that ended months ago sits nowhere near the zone on screen and reads as a fault.
The levels follow the same restraint, in three tiers rather than nine identical lines: the two ends of the leg carry its direction, the levels between them sit back in muted grey, and the accent is spent once, on the golden zone. Candle colouring can be switched off entirely if you would rather keep your own.
❼ THE DASHBOARD
Leg direction and size, the live retracement as a single large number, whether price is inside the golden zone or has not reached it yet, the measured typical depth with its sample count, and the 0.618 and 0.786 prices ready to be turned into orders.
HOW TO USE IT
1 — Wait for the leg, not the level. The fib only exists after a confirmed pivot. That delay is the point: it is what stops you fibbing a swing that is still forming.
2 — Compare the golden zone with the typical depth line. If they overlap, the zone is doing its job on this symbol. If the typical depth sits well above or below it, trade the measured level and treat 0.618 as decoration.
3 — Use the extensions as the other half of the trade. An entry in the golden zone with a target at −0.272 is a defined structure; an entry with no target is a hope.
4 — Change the swing length to change the timeframe of the analysis. A short length gives the fib of the current intraday leg; a long one gives the fib of the swing the whole session is trading inside. Both are valid, and they answer different questions.
HOW IT WORKS
Pivot highs and lows of your chosen length define the leg. Span is the distance between anchor and extreme; a retracement level is the extreme moved back toward the anchor by its fraction of the span, and an extension is the same arithmetic past the extreme. The live retracement is the current close expressed in that same fraction. Depth statistics keep a rolling window of completed pullbacks and report their mean.
Works on any symbol and any timeframe. On higher timeframes raise the swing length so the fib tracks the swing rather than the noise inside it.
SETTINGS
▸ Swing — pivot length and how far levels extend to the right. ▸ Retracement Levels — each level individually switchable. ▸ Golden Zone / OTE — fill on or off, and both edges of the band. ▸ Extensions — three targets, any fib values you like. ▸ Depth Statistics — on or off, and how many legs are remembered. ▸ Visuals — labels, line width, five candle palettes plus off, aura glow and its strength, gold OTE bars, dashboard position.
ALERTS — price entered the golden zone, 0.618 reached, leg fully retraced, and fib re-anchored. All fire on closed bars.
NON-REPAINTING — the fib is anchored to confirmed pivots, which means a leg is only drawn after the bars either side of its pivot have closed. The depth record is built from completed pullbacks and never changes retroactively.
WHY THESE PARTS ARE ONE SCRIPT
The auto-anchoring, the golden zone and the depth measurement describe one object. Auto-anchoring alone gives you a fib that is correctly placed but still generic. The golden zone alone is a band drawn on an assumption. The measurement exists only to tell you whether that assumption holds on the symbol in front of you — and it needs the anchoring to have legs to measure. Remove any one and the other two lose their point.
This indicator is an educational market-analysis tool, not financial advice. The depth statistic describes pullbacks that have already happened on the loaded chart; it does not predict the next one. Always confirm with your own analysis and manage your risk.
Индикатор

Fibonacci Confluence Suite [AxeAlgo]Fibonacci Confluence Suite
OVERVIEW
Fibonacci Confluence Suite is an automatic Fibonacci retracement and extension toolkit. Instead of requiring you to manually draw a Fibonacci tool on every swing, it detects swing highs and lows on its own using fractal price structure, draws the retracement/extension grid between them, and keeps that grid updated in real time as new swings form.
On top of the standard retracement levels, this script adds several layers of context that are normally separate, manually-maintained tools: a Golden Pocket highlight, a confluence check against prior swings, a per-level "touch count" strength score, an optional volatility-adaptive lookback, Fibonacci time zones, and a compact on-chart status table. The goal is to let you see not just where a Fibonacci level sits, but how significant that level appears to be.
This is a technical analysis / charting tool. It does not predict price, does not place trades, and is not a signal generator promising entries or exits.
HOW IT WORKS
1. Swing detection: the script scans for fractal highs and lows (a bar whose high/low is more extreme than the two bars on either side of it) within a user-defined lookback Period.
2. Anchors: the most extreme fractal high and fractal low found inside that window become the 0% and 100% anchors.
3. Direction: the detected swing is treated as an up-move or down-move depending on which side price broke out of most recently; you can flip this with the Reverse input if you prefer levels measured from the opposite end.
4. Grid: every retracement/extension ratio you enable is calculated from those two anchors and drawn as a labeled horizontal line, with the current price and touch count shown directly on the label.
5. Confluence: each time the swing flips, the prior swing's high/low is stored. Newly drawn levels are checked against the Fibonacci levels of those earlier swings, and any level that lines up within your tolerance is marked and drawn wider so overlapping structure stands out.
KEY FEATURES
- Automatic fractal-based swing detection, no manual drawing required.
- Base lines (0.000 / 1.000) plus up to nine independently configurable extension ratios, each with its own show/hide toggle and value.
- Adjustable line style, width, color, and extension direction (none / left / right / both) for base and extension lines separately.
- Golden Pocket highlight (0.618-0.65) with adjustable fill color, useful as a classic confluence/reaction zone.
- Multi-swing confluence detection: compares the current Fibonacci grid against up to five prior swings and flags levels that overlap, with an adjustable tolerance (as a percentage of the swing range) and a visual marker on confluent levels.
- Level strength via touch counts: each level tracks how many times price has traded through it since that specific swing grid was drawn, shown directly in the line label.
- Optional volatility-adaptive sensitivity: scales the effective lookback window using current ATR relative to its own baseline, so the swing detection can loosen or tighten automatically across changing volatility regimes instead of relying on one fixed Period. Disabled by default; when disabled the script behaves exactly like a fixed-Period fractal Fibonacci tool.
- Fibonacci time zones: optional vertical lines placed at Fibonacci bar-count offsets from the start of the current swing, for traders who also watch time-based confluence.
- Status table showing current trend direction, swing high/low, nearest level to price, the strongest (most-touched) level, and the lookback period actually in use.
- Built-in alerts: a per-level alert whenever price trades through any visible base or extension line, a dedicated Golden Pocket alert, and grouped "any base line" / "any extension line" alert conditions for the classic Alert dialog.
HOW TO USE IT
- Period / Delay: Period sets how many bars back the script searches for the swing high/low. Delay sets how many bars of confirmation a fractal needs before it can be used; it must be smaller than Period. Larger Delay values produce more reliable fractals at the cost of a slower reaction to new swings.
- Line Extension: controls whether the drawn levels extend left, right, both directions, or not at all.
- Reverse: flips which anchor (swing high or swing low) is treated as the 0% origin, letting you view the same swing from the opposite bias.
- Base Lines / Extension Lines groups: toggle, color, style, and set the ratio of each level independently.
- Golden Pocket: toggle and recolor the 0.618-0.65 zone highlight.
- Level Strength: toggle whether touch counts are appended to each label.
- Multi-Swing Confluence: toggle, choose how many prior swings to compare against, set the matching tolerance, and set how much extra line width and which marker confluent levels get.
- Adaptive Sensitivity: enable to let ATR-based volatility scale the effective lookback automatically; adjust the ATR length and baseline length used for that comparison.
- Time Zones: enable vertical Fibonacci time markers, choose how many zones to draw, and toggle multi-color cycling versus a single accent color.
- Status Table: toggle visibility and choose its screen position.
Set alerts using "Any alert() function call" on this indicator to receive all per-level, Golden Pocket, and roll-up alerts, or use the named alert conditions in the Alert dialog if you only want a subset.
IMPORTANT NOTES AND LIMITATIONS
- Repainting: this script can repaint on the most recent, unconfirmed swing. Because a fractal only confirms after the Delay setting's worth of bars closes, the swing high/low anchors — and therefore every level drawn from them — can still shift on the last few bars until the current fractal fully confirms. Once a swing has confirmed and the trend has flipped, that swing's levels are fixed and will not repaint further. Increasing Delay reduces how often this happens, at the cost of reacting more slowly to fresh swings. Please account for this when reading the most recent levels on the chart, and avoid relying on unconfirmed levels for time-sensitive decisions.
- This tool identifies swing structure and Fibonacci confluence; it does not forecast direction, does not manage risk, and does not constitute a complete trading system on its own. It is intended to be used as one input alongside your own analysis, risk management, and market context.
- Touch counts and the confluence marker describe historical interaction with a level on this chart; they are not a probability estimate and do not guarantee how price will react at that level going forward.
- As with any lookback-based tool, results and appearance will vary by symbol, timeframe, and the Period/Delay settings chosen. Please test on your own instruments and timeframes before relying on it.
DISCLAIMER
This script is provided for educational and informational purposes only and does not constitute financial advice. Trading involves substantial risk of loss and is not suitable for every investor. Past behavior of any indicator, including this one, is not indicative of future results. Always do your own research and consider your own risk tolerance before making any trading decisions. Индикатор

Fibonacci Vault [JOAT] JackOfAllTrades presents — Fibonacci Vault
A self-anchoring Fibonacci engine that locks onto the latest impulse leg and keeps the Golden Pocket glowing — no manual drawing.
━━━━━━━━━━━━━━━━━━━━━━━━━━━━━
◆ WHAT IT IS
Drawing Fibonacci by hand means re-anchoring every time structure changes. Fibonacci Vault does it for you: it identifies the most recent confirmed impulse leg , lays the retracement shelves automatically, and treats the Golden Pocket (0.618–0.65) as a first-class zone rather than a single line. It is a pure confluence tool — it maps levels, it does not print buy/sell signals.
This is 100% original code, written from scratch. It does not reuse any other author's Fibonacci script.
━━━━━━━━━━━━━━━━━━━━━━━━━━━━━
◆ HOW IT WORKS
1. Leg detection. The tool tracks confirmed swing highs and lows (using your chosen strength) and defines the active leg between the two most recent. Leg direction is inferred from which swing printed first — a low-then-high sequence is an up-impulse, and vice versa.
2. Size filter. A leg is only used if it is large enough — a minimum size expressed in ATR multiples — so the Vault anchors to meaningful impulses and ignores insignificant wiggles. As structure evolves, the anchor re-arms itself automatically.
3. The shelves. From the active leg, the standard retracements are projected: 0.236, 0.382, 0.5, 0.618, 0.65, 0.786, plus the 0 and 1 leg endpoints. Optional extension shelves at 1.272 and 1.618 project continuation targets beyond the leg.
4. The Golden Pocket. The 0.618–0.65 band is rendered as a glowing zone , and price trading inside it can optionally tint the background — the area many traders watch for reactions.
━━━━━━━━━━━━━━━━━━━━━━━━━━━━━
◆ WHAT YOU SEE
• Auto-anchored retracement shelves with optional price tags
• A glowing Golden Pocket zone and optional 1.272 / 1.618 extensions
• An impulse-leg line marking the anchor
• A resizable dashboard showing the active leg and direction, leg size in ATR, how far price has retraced (with a gauge), the Golden Pocket range and whether price is inside it, the nearest shelf, and the projected extensions
━━━━━━━━━━━━━━━━━━━━━━━━━━━━━
◆ HOW TO USE IT
• Use the shelves as confluence for entries, targets and invalidation — not as standalone signals.
• The Golden Pocket is the tool's focal zone; combine a pocket tap with your own trigger for a pullback entry.
• Extensions give objective targets once an impulse resumes.
• The retraced % readout tells you at a glance how deep the current pullback is.
• Works on all symbols and timeframes. Raise swing strength and the minimum leg size to anchor to larger structure only.
━━━━━━━━━━━━━━━━━━━━━━━━━━━━━
◆ NOTES & LIMITATIONS
Because the leg re-anchors on confirmed swings, the active leg updates as new structure is validated. Fibonacci levels are reference zones, not predictions — the tool is not financial advice and cannot guarantee a reaction at any level. Use it as confluence within your own method and risk plan.
— made with passion by officialjackofalltrade
Индикатор

Fib Trend & Legs (BoaBias)█ OVERVIEW
Fib Trend & Legs (BoaBias) draws Fibonacci structure on two nested scales at once: a parent fib across the full market-structure trend cycle (trend-up ↔ trend-down), and child fibs on the BOS / CHoCH swing legs inside that trend. Optional golden / deep zones plus a CT-fade Edge panel (ALMA overheat · MTF EMA overheat · fib-anchored VWAP · golden proximity) with matching overlays. Structural context for discretionary work and alert workflows — not a black-box signal service.
█ WHY UNIQUE
Most Fib tools lock to a single hand-picked or last-swing range. This map keeps parent trend and child legs alive together : the parent tracks the whole structure trend cycle while child legs lock on each confirmed BOS/CHoCH segment (plus an optional forming leg). The Edge panel is a CT-fade confluence over that map: ALMA run overheat and MTF EMA above/below overheat (same lengths as BoaBias public EMA/ALMA), proximity to the parent golden zone, and a VWAP anchored at the parent fib start — so stretch + pullback context sit on one overlay instead of juggling three scripts.
█ HOW TO USE
First use: If the indicator appears in the wrong scale (squashed or fullscreen), right-click the indicator → Pin to scale → Pin to right scale.
Leave Show Parent Fib and Show Child Fibs on; tune Pivot Length so swings match your timeframe (higher length = fewer, larger structure events).
Watch Golden Zone / Deep Zone on the parent for pullback context; enable the same zones on child legs when you trade inside-leg retracements.
Use Pattern Edge (top-right) for parent-fib CT-fade confluence and Child Edge (bottom-left) for the active leg — high when pullback-side ALMA/EMA is stretched into golden near fib VWAP. Not a standalone entry trigger.
Alerts: Chart → Create alert → this indicator → choose a condition (Golden/Deep entry, Strong Edge, Cross Fib VWAP, Break 0%, Full Retrace, Trend Up/Down, BOS, Upsweep/Dnsweep). Prefer Once per bar close for cleaner automation.
█ HOW IT WORKS
Market structure: Pivot highs/lows feed a trend state. Trend flips (and BOS / CHoCH / optional liquidity sweeps) define when ranges update. Algorithm mode: Extreme Points or Adjusted Points.
Parent fib (Trend): Anchored to the full active trend cycle — from the cycle origin to the opposing extreme — with retracements, optional extensions, and zone fills between configurable ratios (defaults emphasize 61.8–78.6 golden and 78.6–88.6 deep).
Child fibs (Legs): Each leg = protective origin (CHoCH / last protect wick) → running extreme ( ms.main wick). Locked on BOS with those bars frozen. L1 = newest locked, L2 = previous, Lf = forming. Optional H/L anchor marks show the two wicks. Parent trend flip clears child history.
Edge layer (CT fade): Two panels — Pattern (parent fib) and Child (active leg). Each scores golden proximity (≤25) + ALMA pullback CT (≤25) + EMA pullback CT (≤25) + fib-start VWAP (≤25). ALMA/EMA CT use the chart timeframe only (panel shows e.g. ALMA 1D). For a bull fib, CT scores short / below-EMA stretch; bear fib scores the opposite. Optional plots: chart-TF ALMA SuperTrend, enabled EMAs, Pattern + Child fib VWAPs.
Sweep markers: Optional “x” markers when structure detects upsweep / dnsweep liquidity grabs (style group for color, size, max count).
█ CTA
More BoaBias public Scripts: TradingView → Goldfinch_song → Scripts .
Ideas that use this stack: profile → Ideas tab.
█ LIMITATIONS
Pivot-based structure lags until pivots confirm; forming parent/child ranges can update until the next structure event.
Fib levels and zones are structural maps , not guaranteed support/resistance or trade signals.
Edge score is a confluence helper on the loaded history — descriptive, not predictive.
Heavy child history + many levels can hit drawing limits — lower Max Completed Child Legs or disable unused levels.
Educational / research overlay. Not financial advice.
Pine Script v6. License: MPL-2.0 . Индикатор

Smart Auto Fibonacci Retracement [JPT] 🔷 OVERVIEW
Smart Auto Fibonacci Retracement is an original Pine Script® v6 indicator that automatically detects confirmed Swing Highs and Swing Lows, identifies the current market trend, and draws dynamic Fibonacci Retracement and Extension levels without requiring manual drawing.
The indicator creates an organized Fibonacci framework using the latest confirmed swing structure, helping traders identify potential pullback zones, continuation areas, support, resistance, and profit targets.
🔷 HOW IT WORKS
The indicator continuously scans price using confirmed pivot swings.
Bullish Trend
When a valid Swing Low is followed by a Swing High, the indicator recognizes an uptrend and automatically draws Fibonacci retracement levels from the Swing Low to the Swing High.
This allows traders to monitor potential pullback zones during bullish market conditions.
Bearish Trend
When a valid Swing High is followed by a Swing Low, the indicator recognizes a downtrend and automatically plots Fibonacci retracement levels from the Swing High to the Swing Low.
This helps identify possible resistance and continuation levels during bearish trends.
All Fibonacci levels update automatically whenever a new confirmed swing structure forms.
🔷 VISUAL FEATURES
• Automatic Swing High Detection
• Automatic Swing Low Detection
• Automatic Trend Detection
• Dynamic Trend Line
• Automatic Fibonacci Retracement Levels
• Fibonacci Extension Levels
• High & Low Swing Labels
• Right-Side Fibonacci Labels
• Colored Fibonacci Zones
• Trend Background Color
• Clean Professional Layout
• Customizable Colors
🔷 FIBONACCI LEVELS
The indicator automatically plots the following retracement levels:
• 0.000
• 0.236
• 0.382
• 0.500
• 0.618
• 0.786
• 1.000
Extension levels include:
• 1.272
• 1.618
• 2.618
These levels automatically adjust whenever a new confirmed swing is detected.
🔷 TREND ENGINE
The built-in Trend Engine automatically determines whether the market is currently bullish or bearish based on the latest confirmed swing structure.
Bullish Trend
• Fibonacci drawn from Low → High
• Green trend background
• Bullish trendline
Bearish Trend
• Fibonacci drawn from High → Low
• Red trend background
• Bearish trendline
This provides an easy-to-read visual representation of the prevailing market direction.
🔷 INPUTS
Available settings include:
• Swing Strength
• Show Trend Line
• Show Trend Background
• Show High/Low Labels
• Extend Fibonacci Lines
• Enable Individual Fibonacci Levels
• Bullish Color
• Bearish Color
🔷 ALERTS
Built-in alerts are available for:
• Buy Signal
• Sell Signal
• Price Crossing Key Fibonacci Levels
Alerts can be connected directly to TradingView's notification system.
🔷 COMMON WORKFLOW
A typical workflow is:
Wait for a confirmed Swing High and Swing Low.
Allow the indicator to identify the current market trend.
Observe the automatically generated Fibonacci retracement and extension levels.
Monitor pullbacks into key Fibonacci zones such as 0.382, 0.500, or 0.618.
Use extension levels as potential profit targets.
Combine Fibonacci levels with your own market analysis before making trading decisions.
🔷 MARKETS
This indicator can be used on:
• Forex
• Gold (XAUUSD)
• Cryptocurrency
• Stocks
• Indices
• Futures
• Commodities
Compatible with all TradingView-supported timeframes.
🔷 BEST PRACTICES
Many traders combine Fibonacci analysis with:
• Trend Analysis
• Support & Resistance
• Break of Structure (BOS)
• Change of Character (CHoCH)
• Fair Value Gaps (FVG)
• Order Blocks
• EMA 50 / EMA 200 Trend Filter
• Higher Timeframe Analysis
These techniques can provide additional confirmation when evaluating Fibonacci retracement and extension levels.
🔷 UPCOMING FEATURES
Future updates may include:
• Auto Visible Range Detection
• Multi-Swing Fibonacci Mode
• EMA 50/200 Trend Filter
• Premium & Discount Zones
• Auto Entry Price
• Stop Loss Calculation
• TP1, TP2, TP3 Auto Targets
• Risk/Reward Visualization
• Dashboard
• Advanced Alert System
🔷 DISCLAIMER
This indicator is provided as a technical analysis tool for educational and informational purposes only. It automatically identifies confirmed swing structures and calculates Fibonacci levels based on historical price action. It does not predict future market movements or guarantee trading results. Always perform your own analysis, apply sound risk management, and consider additional market factors before making trading decisions. Индикатор

Fibonacci Retracement [AFD]Fibonacci levels that find their own two points, and keep finding them.
THE PROBLEM WITH DRAWING THEM BY HAND
A retracement is two clicks and a judgement call. The judgement is the hard part - which high, which low, and whether the leg you just measured is one move or two glued together. Then the session rolls over and the answer changes, so you do it again.
This draws the grid from the chart's own data instead. You tell it which range matters and it finds the two points itself, every bar, forever. Come back after the open and it has already re-anchored to the new day.
PICKING THE RANGE
Four choices, and they are all self-maintaining.
Current Day is the default and it is the one most intraday traders want - today's high and low, re-anchoring at each session open. Previous Day is yesterday's, and it draws from yesterday's start rather than today's, so the geometry sits over the data it came from. Current Week is the same idea one period up.
Latest Swing is the interesting one. It takes the last confirmed swing high and low, and it insists they alternate.
That insistence matters more than it sounds. ta.pivothigh() and ta.pivotlow() are independent detectors, and a real chart prints two, three, four highs in a row with no qualifying low between them. Take the most recent of each and you get a "leg" whose high end is simply the latest high, not the highest one in the span - so the grid measures a move that never happened as a single push, and 0.618 lands somewhere with no relationship to anything. Here, a pivot on the same side as the last one replaces it only if it is more extreme, and a pivot on the opposite side starts the next leg. On clean impulses this changes nothing at all. On ragged ones it pulls the anchor back to the extreme the leg actually reached.
Swing Strength sets how many bars have to print either side of a pivot before it counts. Higher means fewer and more significant swings, and a longer wait.
WHICH WAY THE LEG RUNS
Fib Direction is Auto, Long or Short, and it is the one control that stays live no matter what else you switch off - because it governs both grids, not just the near one.
Auto works out the direction from the range you actually chose. It looks at the two extremes that range uses and puts 0.00 at whichever one printed later, on the reasoning that the more recent extreme is the one the move ended on. So on Current Day, a day that made its low at 10:15 and its high at 15:50 gets 0.00 at the high and a grid you read downwards. Force it with Long or Short when you disagree.
THE MINUS SIGN, AND WHY THE EXTENSIONS HAVE ONE
Everything on this chart is numbered from the leg end. 0.00 sits at the recent extreme that finished the move, 1.00 at the point it started from. That way the number you read is retracement depth, and it means the same thing whichever direction the leg ran.
The extensions continue that same line past 0.00, which is why they are negative. -0.618 sits 0.618 of the leg's range beyond the 0.00 line, in the direction the leg was travelling - exactly the way 0.618 sits 0.618 of the range on the other side of it. One ruler, and the sign tells you which side of the origin you are on.
If that looks unfamiliar, put TradingView's own Fib Retracement tool on the same two points. Its tags read the same: -0.618, not 1.618. The 1.618 reading belongs to the Trend-Based Fib Extension tool, which measures from the leg origin instead - a perfectly good convention, but putting both on one chart gives you two rulers running opposite directions from the same 1.00 line, and sooner or later you read the wrong one.
Six ratios are on offer - -0.272, -0.414, -0.618, -1.00, -1.618, -3.236 - and they ship switched off. They are levels, not targets. They are arithmetic on the leg. This script says nothing about whether price gets to one, marks no entry or exit, and has no alerts of any kind.
THE SECOND GRID
Switch on Show HTF Context and a second grid draws behind the first, anchored to the latest confirmed swing on a higher timeframe and dimmed so it stays context rather than competing for your attention. It ships off, so a fresh add gives you one clean grid.
HTF Mode is where this differs from most higher-timeframe overlays. Adaptive , the default, does not hold a fixed interval - it takes the next one up from whatever chart you are on. A 5-minute chart anchors to the 15-minute swing, a 1-hour chart to the 4-hour. Change timeframe and it follows you, and because it always resolves to something strictly higher, it cannot silently resolve to nothing.
Custom lets you name the timeframe instead, which is what you want when a specific one matters - the 4-hour swing while you scalp the 5, say. The catch is that it has to be strictly higher than the chart. Set Custom to 240 and drop to a 4-hour chart and the grid disappears with no warning label, because 240 is not higher than 240.
Both grids keep their own level checkboxes, line width, label size and text colour, so you can make the context layer as quiet as you like. The extension ratios are the exception: which ratios get drawn is shared by both grids, while which grids draw them is not. Each layer has its own extension toggle. The tooltips say which is which, because a control that looks global and is not is worse than one that plainly is.
THE SETTINGS ACTUALLY WORTH YOUR TIME
Most of the 63 inputs are the ordinary colour-and-width kind. These are the ones that change how the thing reads.
Color Mode defaults to Gradient, and it is doing real work. Each level takes its colour from its own ratio, so hue states depth - the shallow end and the deep end are different colours, and the 0.618-0.786 span reads as a region instead of two more identical lines. There are five presets plus Custom. Single Color reverts to one colour per grid if you prefer the classic look, and either way whatever transparency you pick in the colour picker is the transparency you get.
Enable Glow draws every level twice - a wide, near-transparent halo under a thin bright core. It costs nothing but line objects and it is the difference between a grid you can see on a busy chart and a set of hairlines you lose against the candles. Turn it off when the chart is crowded.
Fill Between Levels shades the intervals. OTE Band, the default, shades only 0.618-0.786. All Bands shades everything, Custom Bands lets you pick, and Off is off. The fills are independent of the line checkboxes, so you can shade a band whose boundary lines are hidden.
Highlight Golden Zone at Price is the one piece of reactive styling here. While the last close is between the 0.618 and 0.786 prices, that band draws more opaque and lifts off the chart. It creates nothing new - no box, no zone object, no centre line, no label - it just restyles the band the fill control already drew, and Highlight Strength sets by how much. It is arithmetic on two numbers already on your screen.
HTF Layer Dimming adds transparency to the whole context grid on top of whatever its colours already carry, which is how the second grid stays behind the first instead of doubling the clutter.
Extension Fade fades each extension a little further as it travels away from the leg, so the near ones read as more prominent than the far ones. It counts only the extensions you actually enabled, not their slot in the ladder - so if you turn on just the far ones, the nearest of them is still drawn at full strength rather than arriving pre-dimmed.
Ratio Label Format switches the tags between decimal and percent - 0.618 or 61.8%, minus signs intact either way. Show Price Labels adds the actual price beside each ratio; it is off by default because eight prices is a lot of text.
Line Extension Left/Right and Label Right Offset control how far the grid reaches and how far past it the tags sit. The defaults keep the tags in the empty margin, clear of both the candles and the price scale.
One last thing: any control that cannot do anything greys itself out. Switch the context grid off and its settings dim. Switch to Gradient and the single-colour pickers dim. There is no control in this script that looks live, takes a value, and quietly does nothing.
GETTING STARTED
Add it. You get one grid on today's range, gradient-coloured, golden zone shaded.
Want a different range? Anchor Range. Leave Fib Direction on Auto until it tells you something you disagree with.
Want context from above? Show HTF Context, and leave HTF Mode on Adaptive unless a specific timeframe matters to you.
Want the extensions? Turn them on for whichever grid you want them on, then pick your ratios.
Too busy? Glow off, Fill Between Levels off. You are back to plain lines.
THINGS THAT WILL LOOK LIKE BUGS AND ARE NOT
Swing anchors arrive late. A pivot is not a pivot until Swing Strength bars have printed after it, so on Latest Swing and on the context grid you are always looking at the last confirmed pivot, not the bar in front of you. When a newer one confirms, the anchor moves. That is the price of anchoring to something you can only recognise in hindsight, and it is the same trade every swing-based tool makes.
The day and week ranges are live. Current Day and Current Week use the period's running high and low, so the grid re-scales when the session makes a new extreme. It is showing you the range as it stands, not a finished one.
It draws one grid, not a history of them. You get the current grid, redrawn as things move. There is no trail of old ones behind you.
Higher-timeframe data uses the documented confirmed-value form - the expression is offset by one bar and the request passes barmerge.lookahead_on. Together, that is the pattern the Pine Script documentation gives for reading a higher timeframe without pulling unclosed data into historical bars. The source is open, so you can read the call rather than take my word for it.
Custom HTF at or below the chart timeframe draws nothing at all , and says nothing about it. Worth remembering before you conclude the context layer is broken.
A 12-month chart draws no context grid. 12M is the top of TradingView's interval list, so Adaptive has nothing left to step up to. 3-month and 6-month charts both work.
Prices come from standard OHLC via ticker.standard(), so your levels are the same on Heikin Ashi, Renko, Kagi, Line Break and Point and Figure as they are on candles. The synthetic geometry of those chart types can still put the lines somewhere you would not expect.
WHAT IT DELIBERATELY DOES NOT DO
No alerts. No signals. No scores, ratings or probabilities. No zones, no nested zones, no centre line. It draws Fibonacci levels, labels them honestly, and stops. If you want something that tells you when to act, this is not it.
WHY IT IS DIFFERENT
Four self-maintaining ranges instead of a two-point drag you place today and replace tomorrow. Two independently configured grids on one continuous number line, with the higher one dimmed to sit behind rather than on top. Extensions numbered on the same ruler as the retracements, matching the tags TradingView's own tool gives those prices, rather than a second scale running the other way. A swing range that is genuinely one leg, because the pivot pair is kept alternating. And colour that carries information - a level's hue states its depth - instead of a palette applied to identical lines.
Open source under the Mozilla Public License 2.0. Индикатор

TL Elliott Wave Pro - Rule Checked 12345 ABC Count + Fibs + FVGTL ELLIOTT WAVE PRO — the complete Elliott Wave rule set in one indicator: the count, the three golden rules, the three guidelines, all four fibonacci tools and the fair value gap that turns a level into a trade.
Elliott Wave is usually taught as a picture and traded as a feeling. This indicator turns it into something you can actually check: it labels the impulse, it tells you which of the three golden rules currently hold, it measures every wave against the fibonacci relationships the theory is built on, and the moment a rule breaks it says so instead of quietly redrawing the count into something that still looks right.
Everything below comes from the classic rule set. Nothing is invented, nothing is hidden.
━━━ ① THE WAVE COUNT ━━━
A ZigZag builds the alternating pivot sequence, and the engine reads the most recent structure the rules allow:
· ①②③④⑤ — the five wave impulse: three impulses with the trend, two corrections against it
· ⒶⒷⒸ — the correction that follows: an impulse down, a correction up, an impulse down
Impulse legs are drawn SOLID, corrective legs DASHED. That is not decoration — it is the definition the whole model rests on: impulsive waves are larger and move with the trend, corrective waves are smaller and move against it. The wave that has not happened yet is projected as a dotted gold line straight to its first fibonacci target.
Finished counts are frozen in faded gold exactly where they were found, so you can scroll back through the chart and study how the reading developed instead of only seeing today's answer.
━━━ ② THE THREE GOLDEN RULES — a hard validity gate ━━━
❶ Wave 3 must be the longest impulse wave, and it can never be the shortest
❷ Wave 2 must not surpass the start of wave 1
❸ Wave 4 cannot overlap with wave 1's price territory
Each rule gets a live ✓ / ✗ in the panel. If one of them breaks the count is not "weaker" — it is invalid, and the indicator behaves accordingly: the setup is cancelled, a COUNT INVALID tag goes on the chart with the reason, an alert fires, and the next confirmed pivot starts a fresh count. Rule 1 has a strict and a relaxed reading, switchable in the settings.
━━━ ③ THE THREE GUIDELINES — a soft quality score ━━━
❶ When wave 3 extends as the longest impulse wave, wave 5 typically approximates the length of wave 1
❷ Wave 2 and wave 4 alternate between a flat and a sharp correction — the indicator classifies each correction by depth and duration and shows you the pair, e.g. S / F
❸ After a five wave impulse advance, ABC corrections commonly end near the prior extreme of wave 4 — that level is projected as the C target
Guidelines are informational by default, because that is what they are. You can require one, two or all three before a signal is allowed to fire.
━━━ ④ THE FOUR FIBONACCI TOOLS, WITH THEIR CORRECT ANCHORS ━━━
Wave 2 retracement — 0 % at the end of wave 1, 100 % at its start
· typical 50.0 % and 61.8 %, plus the 60 % average line
Wave 3 extension of wave 1 — projected from the wave 2 extreme
· typical 161.8 % and 261.8 %
Wave 4 retracement — 0 % at the end of wave 3, 100 % at its start
· typical 23.6 %, 38.2 % and 50.0 %, plus the 30–40 % average band
Wave 5 — two separate targets
· 100 % of wave 1 projected from the wave 4 extreme
· 161.8 % of wave 4, anchored 0 % at the wave 4 extreme and 100 % at the wave 3 extreme
The level the market actually turned at is highlighted in gold, and the panel prints the measured value next to the expected one, so you can see at a glance whether this count is textbook or stretched.
━━━ ⑤ +FVG — the confluence that makes it a trade ━━━
A fibonacci zone on its own is a level. A fair value gap sitting inside that zone is a reason. The indicator scans for unfilled three-candle gaps inside the wave 2 and the wave 4 retracement zone, draws them as a +FVG box, and marks the signal accordingly. You can leave it as a quality tag or make it mandatory.
━━━ ⑥ THE TRADES — always in the direction of the impulse ━━━
Trading in the direction of the impulse waves is what pays, so that is all this indicator signals:
WAVE 3 ENTRY — buy the wave 2 correction in an uptrend, sell it in a downtrend
· stop behind the wave 2 pivot, or at the rule 2 invalidation
· TP1 161.8 % of wave 1, TP2 261.8 % of wave 1
WAVE 5 ENTRY — buy the wave 4 correction, sell it in a downtrend
· stop behind the wave 4 pivot, or at the rule 3 invalidation
· TP1 wave 5 = wave 1, TP2 161.8 % of wave 4
Three trigger models per trade: momentum close out of the zone, zone tap for limit-style entries, or a break of the last minor swing for the latest and safest fill. Minimum reward/risk filter, ATR stop buffer, break even at a chosen R. The counter-trend ABC entry exists but is OFF by default, on purpose.
━━━ WHY EVERY SIGNAL EXPLAINS ITSELF ━━━
Hover any signal pill and you get the full reasoning: the exact count with its prices, which golden rules hold, how deep the correction actually went against the typical values, which guidelines are satisfied, whether a fair value gap was inside the zone, plus entry, stop, both targets, risk in pips, reward in pips and the R multiple.
Every wave label carries its own tooltip — what that wave is, how far it travelled, which rule it has to respect and whether it does. Every fibonacci line explains its anchoring. Setups that were found and then rejected get a NO TRADE tag with the reason, so you learn the filter instead of wondering why nothing fired. There is a HOW TO READ THIS card and an honest BEFORE YOU TRADE THIS card on the chart.
━━━ COCKPIT PANEL ━━━
Live count stage, symbol, chart timeframe, ZigZag settings and the size of wave 1 · the three golden rules with ✓ / ✗ / pending · the three guidelines with the flat-sharp alternation pair · every wave measured against its expected fibonacci value · a five step setup checklist that fills in as the trade builds · the open position with stop and target · a large status line · a rough win / loss / break-even tracker and the last signal timestamp.
━━━ ALERTS AND AUTOMATION ━━━
Every event fires a clean JSON payload ready for a webhook: entry, stop, both targets, the direction of the count, the measured wave 2 retracement, the wave 3 extension, the wave 4 retracement, which rules held, whether an FVG was present, the R multiple, symbol, exchange, timeframe, volume and an optional account field. Events: ENTRY, TP1, SL, BE, INVALID, IMPULSE_COMPLETE. Six plain-language alertconditions are included as well for anybody who just wants a notification.
━━━ SETTINGS WORTH KNOWING ━━━
· ZigZag pivot strength and a minimum swing size in ATR — this pair decides the degree of the count and therefore everything else
· Every fibonacci percentage is editable
· Rule 1 strict or relaxed, rules 2 and 3 on or off, kill-on-invalidation on or off
· FVG optional or mandatory, minimum gap size in ATR
· Full TL chart theme: navy background, mint / red candles, corrective legs dimmed — or switch it off and keep your own
· Panel, animated 3D logo and the right-hand extension of the lines are all configurable
Tip: if the candles cover the panel, right click the indicator → Visual order → Bring to front. That is a TradingView layer setting, not something Pine can control.
━━━ HONEST NOTES ━━━
Elliott Wave is not a standalone technique, and its subjective nature has put a lot of traders off it. Two competent analysts label the same chart differently. This indicator picks ONE reading — the most recent one the three golden rules allow — and tells you the moment that reading dies. It does not pretend the ambiguity is gone.
The count re-reads itself on every new pivot. A label that moves is not a bug; it is the engine refusing to defend a count the market has stopped supporting.
The ZigZag pivot strength decides everything. Too small and you count noise, too large and you only see the count after the move is over. Change it and watch the whole picture change — that is the honest lesson of Elliott Wave, and no indicator can take it away from you.
The percentages are averages, not laws. Corrections come in slightly smaller and slightly larger than the textbook numbers all the time.
The win / loss counter in the panel is a rough on-chart tracker. It assumes a fill at the marked price and resolves target before stop inside the same bar. It is not a backtest and it is not a performance claim.
This indicator is a study tool. It is not financial advice.
━━━ CREDIT ━━━
The rule set is classic Elliott Wave Theory as it is taught publicly. The wave engine, the rule and guideline checks, the fibonacci anchoring, the FVG confluence, the panel and the design are original work.
Open source — read it, change it, learn from it.
Индикатор

Индикатор

Geometric Matrix Intelligence [GMI]Description:
Welcome to the Geometric Matrix Intelligence + Market Structure indicator. This script is a hybrid trading tool that merges advanced structural concepts (BOS/CHoCH) with geometric probability levels and volatility-based trend analysis.
Core Features:
Geometric Probability Levels (GMI):
When a shift in trend direction is detected based on our custom ATR volatility filter, the script automatically projects forward geometric expansion levels (Φ1 to Φ4). These levels are highly versatile:
Reversal Zones: Price often reacts directly at these mathematical levels, creating excellent pivot or bounce areas.
Take Profit (TP) Targets: Once you are in a trade, these expansion lines provide objective, dynamic targets to scale out or close your positions.
Market Structure (BOS / CHoCH):
Automatically identifies structural pivot highs and lows using a fractal length (defaulted to 12).
Plots pending "Candidate" structure lines (in blue by default).
Confirms Break of Structure (BOS) or Change of Character (CHoCH) when the price breaks these pivots, updating dynamically on your chart.
VWAP Integration:
Includes a built-in Volume Weighted Average Price (VWAP) as a primary institutional baseline to help gauge overall intraday or multi-day bias. (Enabled by default).
Interactive Trend Dashboard & Shading:
An on-chart dashboard tracks the immediate trend status, the initial trigger entry price, maximum projected targets (Φ4), and current ATR volatility.
Visual trend shading allows for immediate macro-trend recognition.
How to Use:
Watch for Market Structure shifts (BOS/CHoCH) aligning with the GMI generated levels.
Use the projected Φ levels as primary take profit targets when trading a newly confirmed structural break.
Monitor the VWAP to ensure your structural trades are on the correct side of the institutional volume average.
Disclaimer:
This script is provided for educational and informational purposes only. It is not intended to be a financial advice, investment recommendation, or a signal to buy/sell any asset. Trading in financial markets involves significant risk of loss. Always do your own research and test any indicator or strategy in a paper-trading environment before committing real capital. Индикатор

LIQS and FIBS Scalp SystemOverview
The "LIQS and FIBS Scalp System" is an advanced Smart Money Concepts (SMC) and Price Action indicator designed for traders seeking high-probability scalping and day trading setups. Instead of relying on lagging indicators, this system dynamically maps critical liquidity sweeps, structure shifts, and optimal trade entry zones based entirely on pure price action.
Key Features
HTF Market Structure Bias (No EMA Lag):
The core of the system determines the main trend bias by tracking the most recent Break of Structure (BOS) or Change of Character (CHoCH) on your selected Higher Timeframe (HTF). If the HTF just broke a swing high, your bias is firmly Bullish. If it broke a swing low, your bias is Bearish. This ensures you are always trading in alignment with true institutional market structure, not a delayed moving average.
HTF Sweeps & Reversals:
Automatically identifies liquidity sweeps at Higher Timeframe highs and lows. It monitors price action around these key historical pivot levels and highlights potential reversal pinbars right at the sweep zones.
LTF BOS & CHoCH Logic:
Detects micro Break of Structure (BOS) and Change of Character (CHoCH) patterns to spot short-term momentum shifts in real-time, helping you catch the very beginning of a new leg.
Deep Fibonacci Setups & Runner Targets:
Following a valid CHoCH, the indicator automatically draws Fibonacci retracement zones (0.318 - 0.618) representing optimal entry points. It dynamically projects logical Stop Loss zones and extends up to Target 6 for runners to capture massive long-term trends:
Target 1 & Target 2 for short-term scalps.
Target 3 & Target 4 (3.618 - 4.236 extensions) for day trades.
Target 5 & Target 6 (5.618 - 6.854 extensions) to hold your runners and ride extreme trend continuation.
A-Plus Setup Filter & VWAP:
To protect you from fake breakouts and low-probability trades, the system validates every entry.
Pro-trend setups that align with both the HTF Structure Bias and the VWAP are highlighted with colored entry and target boxes.
Counter-trend or low-probability setups are visually muted (grayed out) so you can easily ignore them.
Built-in alerts notify you only when a micro CHoCH perfectly aligns with the HTF trend direction!
How to Use
Wait for price to sweep an HTF liquidity level, watch for a valid CHoCH in the opposite direction, and set your limit orders inside the highlighted 0.318 - 0.618 Fibonacci reaction box. Trust the colored boxes (A-Plus setups) and ignore the gray ones. Take partial profits at T1 and T2, then leave runners for the deeper T3 to T6 targets!
Disclaimer
This script is provided for educational and informational purposes only and does not constitute financial advice. Trading in financial markets involves a high degree of risk and may not be suitable for all investors. Past performance is not indicative of future results. Always conduct your own research, use strict risk management, and perform thorough backtesting before trading with real funds. Индикатор

Advanced Fibonacci Golden Zone [HexaTrades]Advanced Fibonacci Golden Zone automatically finds the market's significant swing legs and projects the Fibonacci Golden Zone, the 0.5 – 0.618 retracement pocket of the latest leg. That band is where trend-continuation entries are classically hunted. No manual fib drawing: the script detects the swing, anchors the retracement correctly for both directions, draws the zone the moment the swing confirms, manages the setup's whole lifecycle, and drives a duplicate-free alert stream.
⭐️How it works
True late-zone detection:
When a swing confirms, the script scans every bar from the actual pivot through the confirmation bar (wicks or closes, per Zone Touch Source). If the price has already reached the zone's near edge anywhere in that window, the zone is late and is skipped; no zone is ever painted behind a reaction that already happened. Strict rule: exactly touching the edge counts as late.
Superseded setups :
A skipped candidate retires the previously active setup immediately: status “Superseded”, zone frozen/faded, and total silence no false “Invalidated” alert (that one is reserved for setups price actually broke).
Invalidation frozen ATR buffer:
A setup dies when a bar closes beyond the protective swing by more than the Invalidation Buffer (× ATR). The buffer is measured once, at setup creation, and the invalidation price stays fixed for the setup's lifetime; later ATR changes can't move it. Dead zones gray out instantly and can never alert again; a broken leg is “poisoned” so its later extensions can't spawn a fresh setup.
Zone anchoring retracements vs projections
Bullish (up-leg): Retracement anchored at 0.0 at the high, 1.0 at the low → the 0.5–0.618 band sits below price as potential support.
Bearish (down-leg) : Mirror-anchored → the 0.5–0.618 band sits above the price as potential resistance.
Retracements (0–1.0) and continuation projections (1.272× / 1.618× of the impulse, beyond the extreme) are computed by separate functions and labelled separately projections are targets, not retracement ratios.
True late-zone detection :
When a swing confirms, the script scans every bar from the actual pivot through the confirmation bar (wicks or closes, per Zone Touch Source). If the price has already reached the zone's near edge anywhere in that window, the zone is late and is skipped; no zone is ever painted behind a reaction that already happened. Strict rule: exactly touching the edge counts as late.
Superseded setups:
A skipped candidate retires the previously active setup immediately: status “Superseded”, zone frozen/faded, and total silence no false “Invalidated” alert (that one is reserved for setups price actually broke).
Invalidation frozen ATR buffer:
A setup dies when a bar closes beyond the protective swing by more than the Invalidation Buffer (× ATR). The buffer is measured once, at setup creation, and the invalidation price stays fixed for the setup's lifetime; later ATR changes can't move it. Dead zones gray out instantly and can never alert again; a broken leg is “poisoned” so its later extensions can't spawn a fresh setup.
⭐️ Features
- Automatic Golden Zone (default 0.5 – 0.618, both ratios configurable)
- Optional fib levels: retracements 0 · 0.236 · 0.382 · 0.5 · 0.618 · 0.786 · 1.0 + separately labelled 1.272× / 1.618× projections
- ZigZag + HH / HL / LH / LL structure labels with live structure bias
- Historical zones stay frozen & softened; optional “One zone per leg” replaces same-leg drafts in place (off by default)
- Zone lifecycle: Waiting → Inside Zone → Rejected / Broke Out → Invalidated / Superseded dead zones gray out and go permanently silent
⭐️How to use it
- Wait for a fresh zone in the direction of the structure (HH+HL → longs, LH+LL → shorts).
- Let price come into the zone covered by the “Price Enters Golden Zone” .
- Look for the rejection: a candle that gets into the zone and closes back out in the trend direction.
- Targets & invalidation: Target 1 = the 0.0 level (the impulse extreme), Target 2 = the 1.272× projection, Target 3 = the 1.618× projection; status “Invalidated” (close beyond the protective swing + buffer) is the classical exit.
⭐️Alert
1 · Golden Zone Invalidated: close beyond the protective swing + frozen ATR buffer — kills the setup
2 · 1.618× Projection Reached: continuation target hit (also completes 1.272× if reached directly)
3 · 1.272× Projection Reached: continuation target hit
4 · Bullish / Bearish Rejection: candle gets into the zone, closes back out in trend direction (completes the entry latch too)
5 · Zone Breakout: price closes straight through the zone
6 · Price Enters Golden Zone: first touch of the zone
No zone-interaction alert can fire on the candle that creates a setup; signals are eligible from the following confirmed candle.
Bar-close confirmation is enforced in code (barstate.isconfirmed is part of every alert condition); alerts cannot trigger intrabar regardless of the frequency you pick. Still select “Once Per Bar Close”.
Advanced Fibonacci Golden Zone combines confirmed market structure, automatic Fibonacci mapping and complete setup management in one tool. It helps traders identify fresh retracement opportunities without manually drawing Fibonacci levels while keeping invalidation, projections and alerts consistent. Use it alongside trend context, price action and proper risk management—not as a standalone entry signal.
We would love to hear your suggestions. If you have ideas for new features, indicators, analytics, or improvements, please share your feedback. Your input helps guide future updates and improve the indicator for all traders.
Wedge pattern detector indicator is for educational and analytical purposes only. It is not financial advice. Trading involves risk. Always use proper risk management and combine this indicator with your own analysis before taking any trade.
Индикатор

Fibonacci Levels Engine [StrixEDGE]What It Does
Fibonacci Levels Engine automatically detects the most recent swing high and swing low within a configurable lookback window, draws the standard Fibonacci retracement grid (0 %, 23.6 %, 38.2 %, 50 %, 61.8 %, 78.6 %, 88.6 %, 100 %) plus the 127.2 % and 161.8 % extensions, and projects every level into the future so you can see where price is heading relative to the structure.
What separates this indicator from a plain Fibonacci overlay is the Edge Analysis layer — three original components that work together to tell you how meaningful a given Fibonacci zone is right now, not just where it sits on the chart:
1. Edge Score (0–100) — A composite confluence gauge displayed in the dashboard.
2. Proximity Heatmap — Dynamic line opacity that makes levels glow as price approaches them.
3. ATR Volatility Band — A band around the Golden Zone midpoint that adapts to current volatility.
How It Works
Core: Swing Detection & Fibonacci Grid
The indicator scans the last N bars (default 20, configurable 5–300) to find the highest high and lowest low. It determines trend direction by comparing which extreme occurred first: if the swing low is further back in time than the swing high, the structure is bullish (price moved from low to high); otherwise it is bearish. Fibonacci ratios are then calculated from that range and drawn as horizontal levels from the swing origin to a user-defined projection length (default 30 bars into the future).
Two shaded zones highlight areas of interest:
- Golden Zone (0.618–0.786) — the highest-probability retracement area in classical Fibonacci theory.
- Deep Zone (0.786–0.886) — often the last line of defense before a full retracement.
Both zones, the 50 % midline, and the extension levels can be toggled on or off independently.
Edge Score — Confluence Gauge
The Edge Score combines three independent measurements into a single 0–100 reading:
RSI Momentum Alignment | 0–35 | In a bullish structure, a low RSI (below 35) scores highest because it signals oversold conditions near support. In a bearish structure, a high RSI (above 65) scores highest. Intermediate RSI values receive proportionally lower scores. |
| Proximity to Golden Zone | 0–35 | Measures the absolute distance between the current close and the Golden Zone midpoint as a ratio of the total Fibonacci range. The closer price is to the midpoint, the higher the score. |
| EMA Trend Alignment | 0–30 | Checks the stacking order of the 8, 21, and 55-period EMAs. A fully aligned stack (e.g., EMA 8 > EMA 21 > EMA 55 in a bullish structure) scores 30; partial alignment scores 20; misalignment scores 10. |
The resulting score is classified as STRONG (≥ 75), MODERATE (≥ 50), WEAK (≥ 25), or LOW (< 25) and displayed with a color-coded label in the dashboard. A high Edge Score means RSI, price proximity, and trend direction are all converging at the Fibonacci zone — not just that price touched a line.
Proximity Heatmap
Every Fibonacci level's line opacity is recalculated on each bar based on how far the current close is from that level. When price is near a level, the line becomes more opaque (visually brighter); when price is far away, the line fades. This is computed as a transparency value derived from the ratio of (distance to level) / (total Fibonacci range), scaled between 10 and 75. The effect lets you instantly see which levels are "active" without scanning numbers — the relevant lines stand out on their own.
ATR Volatility Band
A translucent band is drawn around the Golden Zone midpoint, extending ± 0.5 × ATR (default 14-period). This addresses a practical problem: a Fibonacci level is a single price, but real entries need a buffer that accounts for market noise. The band widens in volatile conditions and contracts in quiet ones, giving you a dynamic "fair value area" inside the Golden Zone rather than a fixed line.
Dashboard Panel
A compact table in the top-right corner of the chart displays:
- Trend — Current structural direction (Bull / Bear) with color coding.
- Edge — The composite Edge Score and its label.
- RSI — Current RSI value, color-coded for overbought/oversold extremes.
- G-Zone — Live status showing ✅ with the midpoint price when the close is inside the Golden Zone
or ⏳ Waiting when it is outside.
- ATR — Current Average True Range value.
- Range — The total Fibonacci range (swing high minus swing low).
Dashboard text size is adjustable (Tiny / Small / Normal / Large).
How to Use It
Identify the structure — Add the indicator to your chart. The dashboard immediately tells you whether the current swing structure is bullish or bearish and shows the Edge Score.
Watch the Golden Zone — When price pulls back toward the 0.618–0.786 area, check the dashboard: a high Edge Score (50+) means RSI and trend EMAs are aligned with the retracement, which increases the odds of a bounce. The G-Zone row will switch from ⏳ to ✅ when price enters the zone.
Use the Volatility Band for entries — Rather than placing a limit order on the exact 0.618 or 0.786 line, use the ATR band as your entry zone. It automatically adjusts to current volatility, giving you a wider buffer in choppy markets and a tighter one in clean trends.
Read the heatmap — Glowing lines tell you which levels price is currently interacting with. If a line is bright and the Edge Score is high, that level carries more weight. If the line is faded, price is far away and the level is not in play.
Settings Overview
- Pivot Lookback (5–300, default 20) — Number of bars scanned for swing high/low detection.
- Right Projection (5–200, default 30) — How far levels extend into the future.
- Golden Zone / Deep Zone / 50 % / Extensions — Toggle individual level groups.
- Edge Score Panel — Show or hide the dashboard.
- ATR Volatility Band — Show or hide the dynamic band.
- Proximity Heatmap — Enable or disable the distance-based line opacity effect.
- ATR / RSI Length — Periods for the ATR and RSI calculations used in the Edge Score and Volatility Band.
- Style — Full color customization for bullish/bearish, zones, bands, levels, labels, and line width.
Set alerts — Four built-in alert conditions are included:
- Price enters the Golden Zone (0.618–0.786)
- Price enters the Deep Zone (0.786–0.886)
- Edge Score reaches 75 or above (strong confluence)
- Price crosses the 0 % or 100 % level (breakout / full retracement) Индикатор