HoneyPotFVGs, IFVGs, Order Blocks. The script was created to help aid in the right direction for entering a trade off of an order block or FVGsИндикаторот TradariusC99
Price to Sales Ratio [Gabremoku]Price to Sales Ratio is a valuation indicator designed to help investors analyze how expensive or cheap a stock is relative to its revenue. The script calculates the P/S ratio using market capitalization divided by total trailing-twelve-month revenue, then enriches that raw valuation with historical averages, rolling Z-score, percentile ranking, 52-week extremes, and sector benchmark comparison. The price-to-sales ratio is commonly used as a revenue multiple, especially for companies where eaИндикаторот Gabremoku18
Market Direction Model (developed by Dr. K.)Market Direction Model (by Chris Kacher as known as: Dr. K.) (Recommended to be used on Nasdaq Composite Index IXIC or S&P500) - Follow-Through Day (FTD): Gain >= 2% on higher volume between day 4 and 7 of a rally attempt. - Distribution Day (DD): Down >= 0.2% on higher volume. - Sell Signal: When price breaks the low of the 5th distribution day within the last 20 days. - Market Phases: Accumulation, Markup, Distribution, Markdown with corresponding trading posture. Never forget: You - only yoИндикаторот OktayUruncu17
ICT Engine: GunnyBadgerLiquidity FVGs IFVGs This Indicator Provides Visuals of Market inefficiencies are left open. it also marks out swing Highs and lows as Liquidity. its meant to be a time saving tool for ICT tradersИндикаторот marnusgrob58
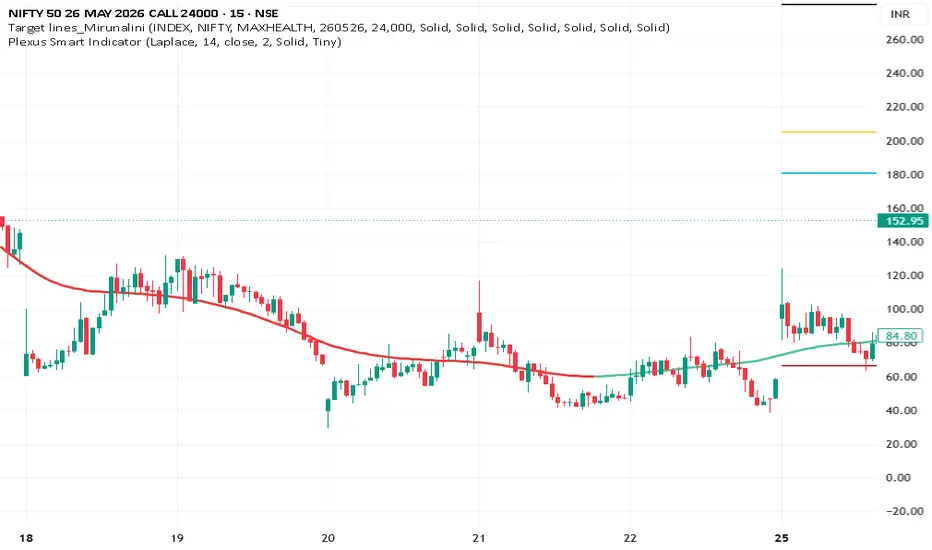
Plexus Smart IndicatorKernel regression is a non-parametric statistical technique used to estimate the relationship between variables without making strict assumptions about the underlying data structure. Instead of fitting a single rigid line (like standard linear regression), it calculates a weighted average of nearby data points, where points closer to your query location have the greatest influence.Индикаторот mirunalinilokeshwaran210
MTF Confirmation Dashboardmulti time frame; 15 min, 1 hr., 4 hr., and 1 day; confirmation overlay using EMA to determine trend, RSI and MACD to determine momentum. Индикаторот jayjetty1970Обновлено 21
Sessions + 7:30-7:45 Range (Denver Time) by Jason Gthis indicator is for 15 mins open candles and must use the fixed volume range profile and ICT concept for forecasting entry.Индикаторот JGtraderguyОбновлено 17
% From Open Watermark% From Open Watermark displays the current percentage change from the session open as a large, semi-transparent watermark overlaid on your chart. It calculates the move from the daily, weekly, or monthly open (your choice) to the current close and updates in real time as price moves. The text color shifts automatically, turning green when you're up on the session, red when you're down, and gray when flat. This gives you an at-a-glance read on session performance without having to do mental math Индикаторот CONDORTANGOОбновлено 3
NVDAX Grid - Long IndicatorNVDAX Grid — Long Indicator 🔷 What it does: This is a signal-only indicator that mirrors a price-grid long workflow on NVDAX / USDT between two fixed bounds. It tracks up to 56 independent virtual slots between a configurable High and Low — each slot fires a webhook-ready buy signal when price crosses down through it, and a paired sell signal when price subsequently crosses up through the slot immediately above. The indicator computes a running average entry, total deployed capital, and open PnИндикаторот 3Commas8
AetherEdge - Sentiment-Proxy Correlation Mapper🖊️ Overview A psychology-focused engine that infers crowd emotion without any social or news feed — purely from price action. It builds sentiment proxies — volume anomaly (panic/euphoria), volatility (fear), price velocity (momentum drive), wick asymmetry (greed vs. fear at extremes), and run-length (FOMO / capitulation) — then uses a NeuraLib correlation map to learn how these proxies move together and weighs them into a single Fear ⇄ Greed sentiment score. A self-adapting mapping continuouslyИндикаторот AetherEdge123
Zone to Zone Trader M15Likvidálált demand illetve supply zóna után ad 1:3 pozíciótИндикаторот dobos_e_v_9553
Dobos Richard m15 1:3 M15 alapján ad csak jelet , kiütött demand illetve supply zóna után. Индикаторот dobos_e_v_957
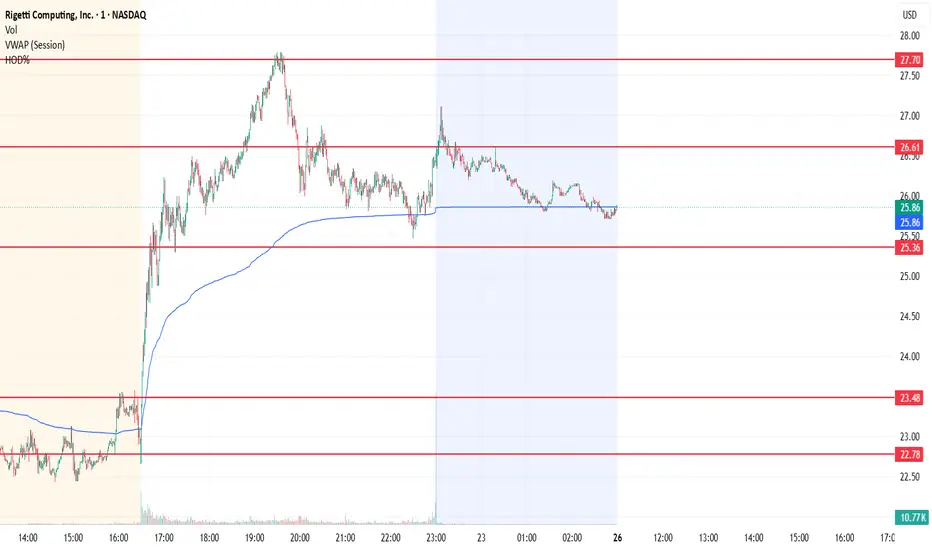
HOD%HOD% shows how far the current price is from the current intraday High of Day. The value is calculated as: HOD% = ((High of Day - Current Price) / Current Price) * 100 How to read it: 0.00 = price is exactly at High of Day 1.00 = price is about 1% below High of Day 3.00 = price is about 3% below High of Day This indicator is useful for momentum traders who want to find stocks trading close to their High of Day. Lower values usually mean stronger intraday momentum. Suggested usage: HOD% <= 1Индикаторот shalom_jana16
NVDAX Grid Bot - Long StrategyNVDAX Grid Bot — Long Strategy 🔷 What it does: This is a long-only price-grid strategy that harvests volatility on NVDAX / USDT through repeated round-trips on a pre-defined ladder of price levels between two fixed bounds. Each level is an independent slot: when price crosses down through a level, the strategy opens one slot; when price subsequently crosses up through the level immediately above, that slot is closed for a fixed round-trip profit. The grid is generated geometrically by default, Стратегияот 3Commas17
Risk Manager [SkaleHub]Overview The ultimate capital preservation tool. This indicator calculates mathematically secure stop-loss placements based on real-time market volatility (ATR) and features a dynamic dashboard that tells you the exact position size to take to protect your account. The Edge Amateurs blow accounts by guessing their lot sizes and placing arbitrary stop-losses. This tool professionalizes your risk. By adjusting your position size relative to the asset's current volatility, it ensures that whether Индикаторот SkaleHub4
Price Density Clouds [EXCAVO]Continuous Kernel-Density Map of Where Price Has Actually Traded The Price Density Clouds builds a smooth, continuous probability density of price over a lookback window and paints it as gradient clouds directly behind the candles. Dense, saturated clouds mark value zones - the equilibrium levels where the market has spent the most time and where price tends to stall and revert. Thin, transparent gaps mark inefficiency zones - levels price travels through quickly. A dashed POC line marks the Индикаторот EXCAVO1101
TON Grid - Long IndicatorTON Grid - Long Indicator 🔷 What it does: This is a signal-only indicator that mirrors a price-grid long workflow on TON / USDT between two fixed bounds. It tracks up to 67 independent virtual slots between a configurable High and Low — each slot fires a webhook-ready buy signal when price crosses down through it, and a paired sell signal when price subsequently crosses up through the slot immediately above. The indicator computes a running average entry, total deployed capital, and open PnL frИндикаторот 3Commas5
TON Grid Bot - Long StrategyTON Grid Bot — Long Strategy 🔷 What it does: This is a long-only price-grid strategy that harvests volatility on TON / USDT through repeated round-trips on a pre-defined ladder of price levels between two fixed bounds. Each level is an independent slot: when price crosses down through a level, the strategy opens one slot; when price subsequently crosses up through the level immediately above, that slot is closed for a fixed round-trip profit. The grid is generated geometrically by default, so sСтратегияот 3Commas13
Multi-Session Levels (Exclusive Logic)Overview Multi-Session Levels (Exclusive Logic) is a specialized technical analysis tool designed for intraday traders who rely on session-based liquidity and reference levels (Highs, Lows, Opens, and Pivots). Unlike standard session indicators that often clutter the chart with overlapping historical data, this script utilizes a custom "Exclusive Display Logic" to ensure that traders only see the most relevant historical context based on the current time of day. The primary innovation of thiИндикаторот TradedailywithsebОбновлено 18
MTIDDescription MTID is an all-in-one overlay built for swing and position traders who want price action, key statistics and fundamentals on a single pane. Six configurable moving averages, a "big move" marker, a live stats dashboard, and an 8-quarter fundamentals table are combined into one indicator with independent toggles for every section. WHAT'S ON THE CHART • Six moving averages — each with its own length, type (SMA/EMA), color and timeframe-visibility filter (All / Intraday+Daily / WeeklИндикаторот atticsaltОбновлено 17
Price to Gross Profit (Diluted shares oustanding) - Main Chartplots on chart a signal of price to gp of 7 or less. feel free to change in the code urself. compares price (marketcap) to gross profit.Индикаторот ValuePig110
Price to Gross Profit (Diluted Shares outstanding)compares market cap (price) to gross profit. help when looking at growing companies that are not PE profitable yet or investing heavy into capex or R&D. Индикаторот ValuePig6
Historical Events for DXYИсторические события для DXY для NZT Индикатор сырой, хотелось бы доработать с вашей помощьюИндикаторот askhat_balguzhinОбновлено 259
EMA MTF Watchlist Alert ScannerEMA MTF Watchlist Alert Scanner with customizable table and alert creation Recommended Settings EMA Length = 13 Match Mode = All Enabled Timeframes Scan Direction = Either Use TF1 = 5 Use TF2 = 15 Use TF3 = 60 Use TF4 = 240 Use TF5 = OFF Use TF6 = OFFИндикаторот olujojomofe41